Technical indicators are mathematical patterns derived from historical data that technical traders and investors use to forecast future price trends and make trading decisions. They derive data points from past price, volume, and open interest data using a mathematical formula.
A technical indicator is displayed graphically and compared to the corresponding price chart for analysis. The mechanics of a technical indicator capture the behaviour and sometimes the psychology of investors to hint at future price activity trends.
Cycle volumes, momentum readings, volume patterns, price trends, Bollinger Bands, moving averages, Elliot waves, oscillators, and sentiment indicators are technical indicators used in technical analysis to forecast future price movements.
Besides providing valuable insight into the price structure, a technical indicator shows how to profit from price movements.
So, In today’s blog, let us discuss different types of technical indicators that can be used when trading in the stock market:
- What are Technical Indicators?
- How Do Technical Indicators Work?
- Types of Technical Indicators
- Bottom Line
- Frequently Asked Questions (FAQs)
What are Technical Indicators?
Technical indicators are heuristic or pattern-based signals generated by a security’s or contract’s price, volume, and open interest used by traders who employ technical analysis.
Technical analysts use indicators to forecast future price movements by analysing historical data.
Some technical indicators generate signals independently, while others work in tandem. They are used in technical analysis to assess a security’s strength or weakness by focusing on trading signals, patterns, price movements, and other analytical charting tools.
Although there are non-specific market technical indicators, some technical indicators are intended to be used for a specific financial market.
How Do Technical Indicators Work?
Technical analysis is a trading discipline that uses statistical trends gathered from trading activity, such as price movement and volume, to evaluate investments and identify trading opportunities.
Unlike fundamental analysts, who attempt to determine a security’s intrinsic value using financial or economic data, technical analysts use price movement patterns, trading signals, and other analytical charting tools to assess a security’s strength or weakness.
Any security with historical trading data can benefit from technical analysis. This includes stocks, futures, commodities, fixed-income securities, currencies, and other financial instruments.
Technical analysis is far more common in commodities and forex markets, where traders are concerned with short-term price movements.
Types of Technical Indicators
Technical Indicators can be divided into-
- Momentum Indicators
- Trend Indicators
- Volume Indicators
- Volatility Indicators
- Breadth Indicators
So, let us discuss these indicators in detail:
Momentum Indicators
Momentum indicators are tools traders use to understand better how quickly or slowly the price of security changes. Momentum indicators should be used with other indicators and tools because they do not identify the direction of movement but only the timeframe in which the price change occurs.
Momentum indicators help the traders to understand the speed at which the price of certain stocks changes. In addition, these indicators help us understand the strength of price movements.
Sometimes the stock prices fall fast, but at other times they might fall slow. We can analyse the speed of the fall or rise in particular stocks by using the momentum indicators.
Below are some of the popular momentum indicators which help traders in gauging the speed of the prices:
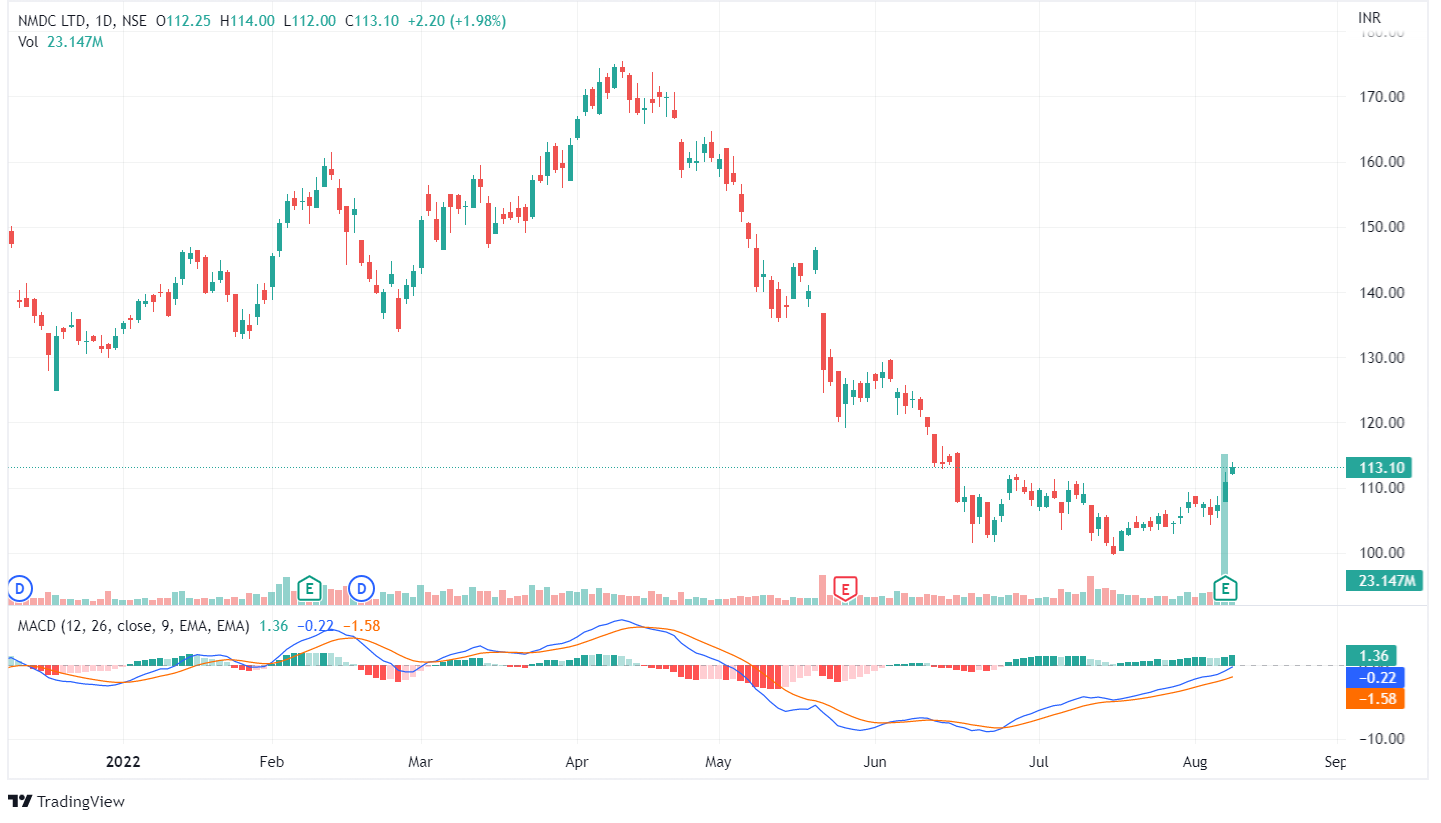
1. Moving Average Convergence Divergence (MACD)
MACD is a momentum indicator which shows the relationship between the two moving averages, i.e. 26 EMA and 12 EMA.
It consists of the MACD line and the signal line. The MACD line is the difference between the 26 EMA and 12 EMA, and the signal line is 9 EMA.
The buying signal is generated by MACD when the MACD line crosses the signal line from below, and the selling signal is generated when the MACD line crosses the signal line from above, as shown below:
MACD also generates the buy and sell signals by bullish and bearish divergences.
2. Relative Strength Index
The Relative Strength Index (RSI) is another popular momentum indicator that acts as a metric for price changes and the speed at which they change for a particular period.
The indicator oscillates between zero and 100. Traders can spot signals when they look for divergences and when the indicator crosses over the centreline, which is 50. When the RSI crosses above 50, it signals positive and uptrend momentum; though, if it hits 70 or above, it indicates overbought conditions.

On the other hand, RSI readings that cross below 50 show negative and downtrend momentum. If RSI is below 30, though, it indicates oversold conditions.
3. Average Directional Index (ADX)
The Average Directional Index (ADX) created by Welles Wilder established the Directional Movement System, which consists of the ADX, the Minus Directional Indicator (-DI), and the Plus Directional Indicator (+DI).
These indicators as a group are used to help measure both the momentum and the direction of price movements.
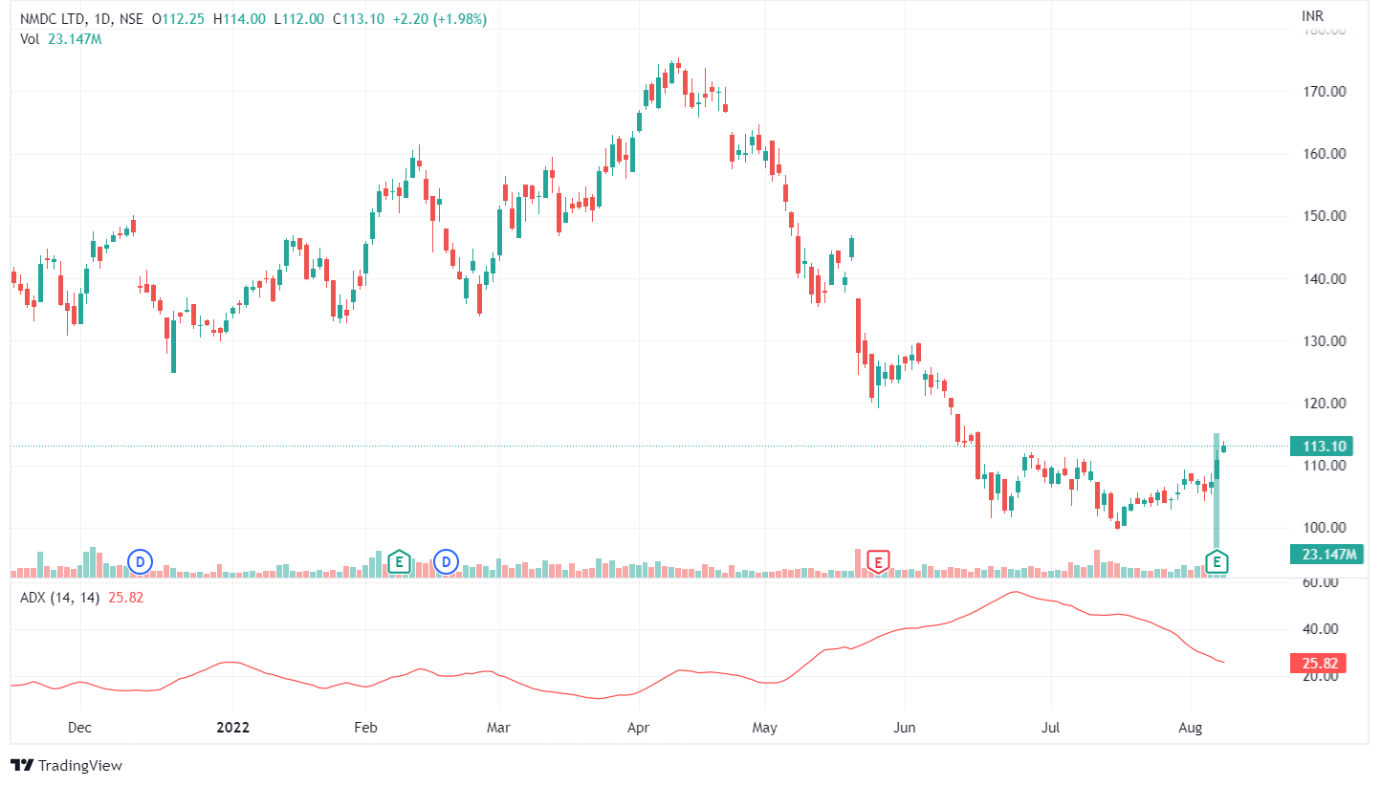
Traders should note that the ADX values of 20 or higher indicate that the market is trending, and for any reading less than 20, the market is viewed as “directionless” or consolidated.
4. Rate of Change
The rate of change is the speed at which the price changes over time. This indicator is expressed as a ratio between a change in one variable relative to the change in another.
A stock with high momentum has a positive ROC, whereas a low momentum stock has a negative ROC and is likely to decline in value, indicating a sell signal.
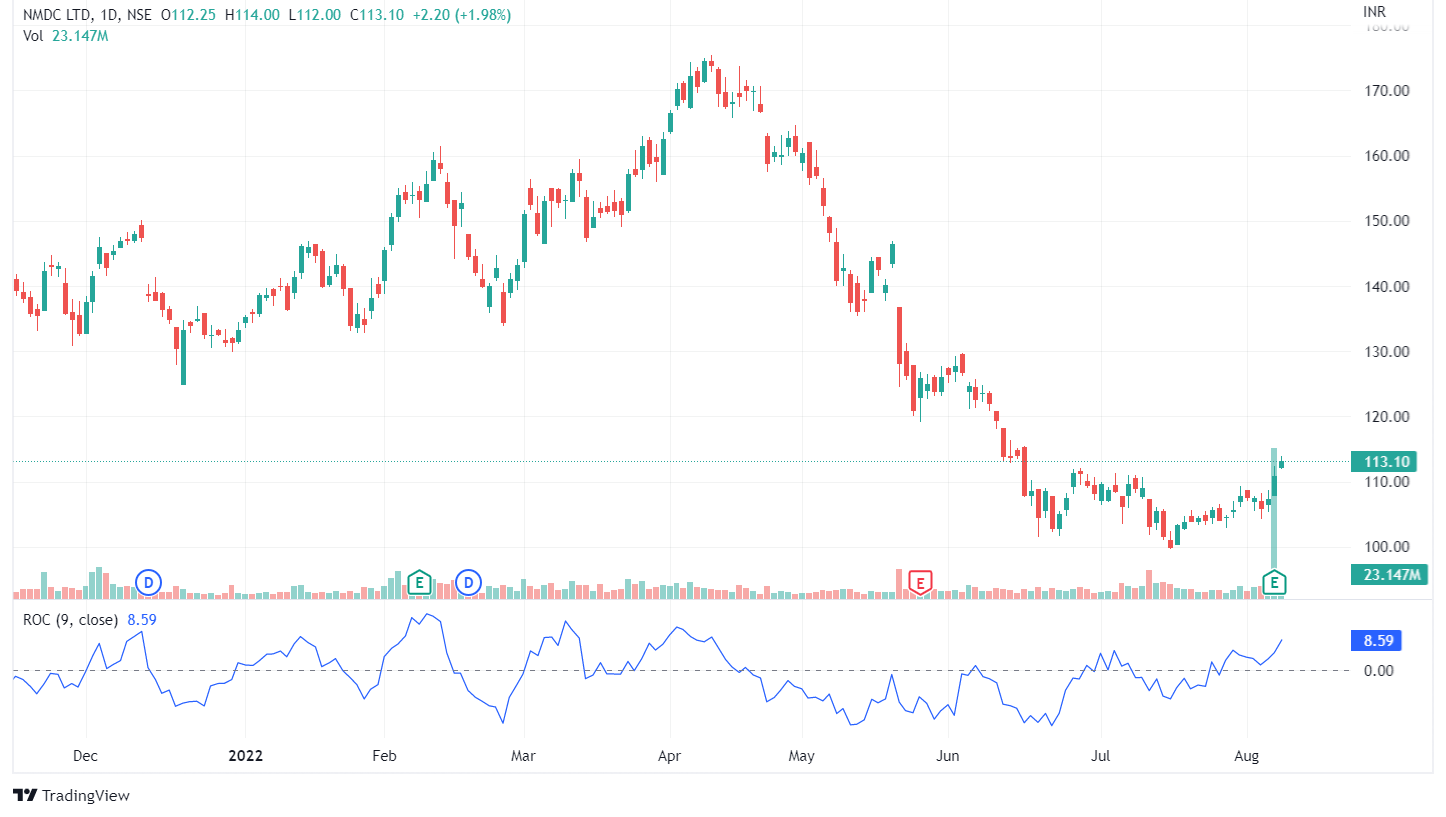
The buy and sell signals are also generated by the divergence between the prices and indicators.
5. Stochastic
Traders use the stochastics momentum indicator to compare the current closing price of a stock over a particular period.
It tracks the momentum and speed of the market and does not consider volume and price.
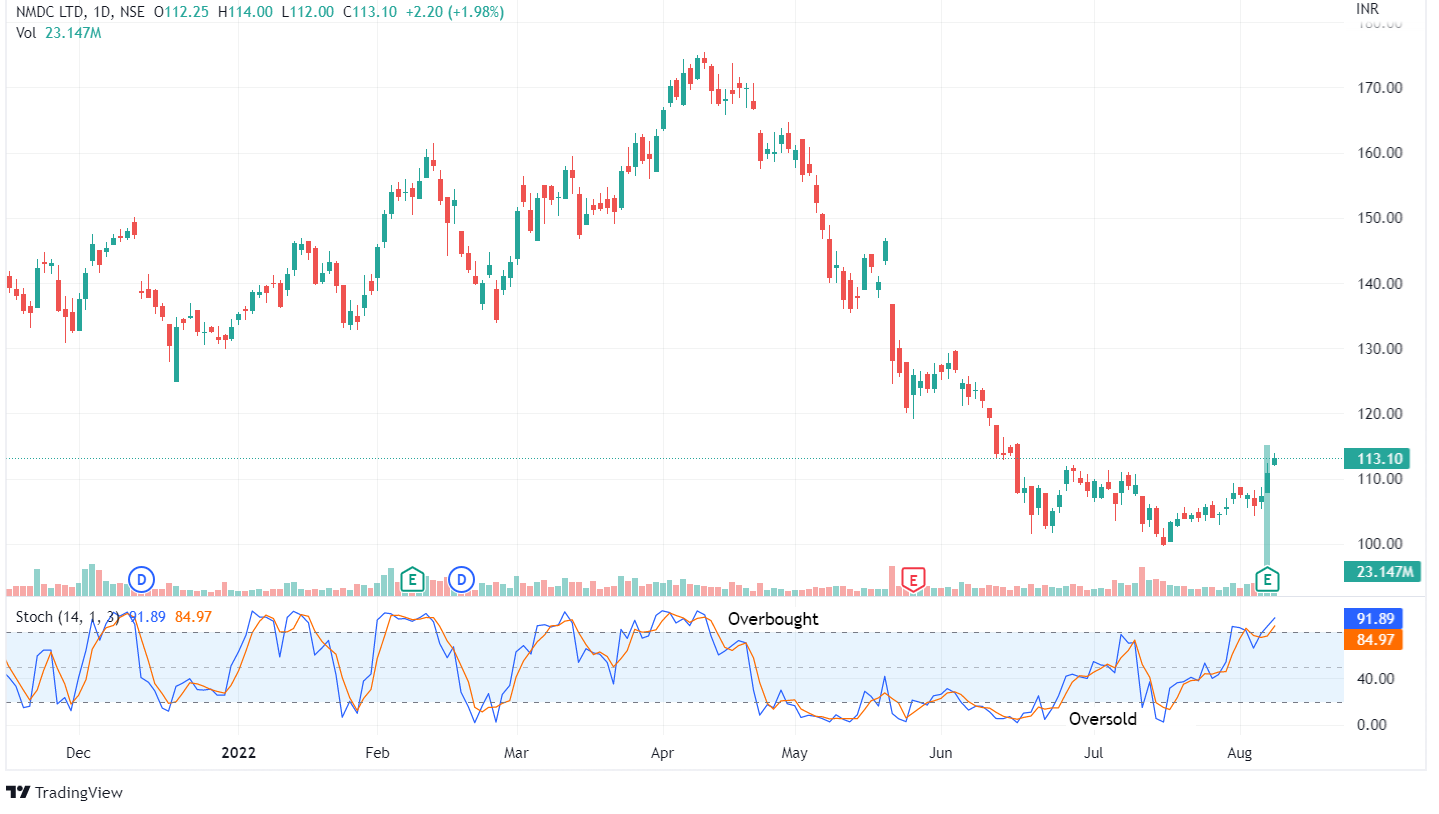
Stochastics help in identifying the overbought and oversold zones and oscillates in the range of 0 and 100. When this indicator is above 80, it is considered an overbought zone; when it is below 20, it shows an oversold zone.
6. Relative Strength
Relative strength refers to the measurement of the stock’s performance as compared to its benchmark or another stock. RS compares the performance of stock “X” vs “Y”, measured over a period. For example, “X” may increase more or less than “Y” in a rising market, or “X” may fall more or less as compared to “Y” in a falling market. It is one of the tools for momentum investing.
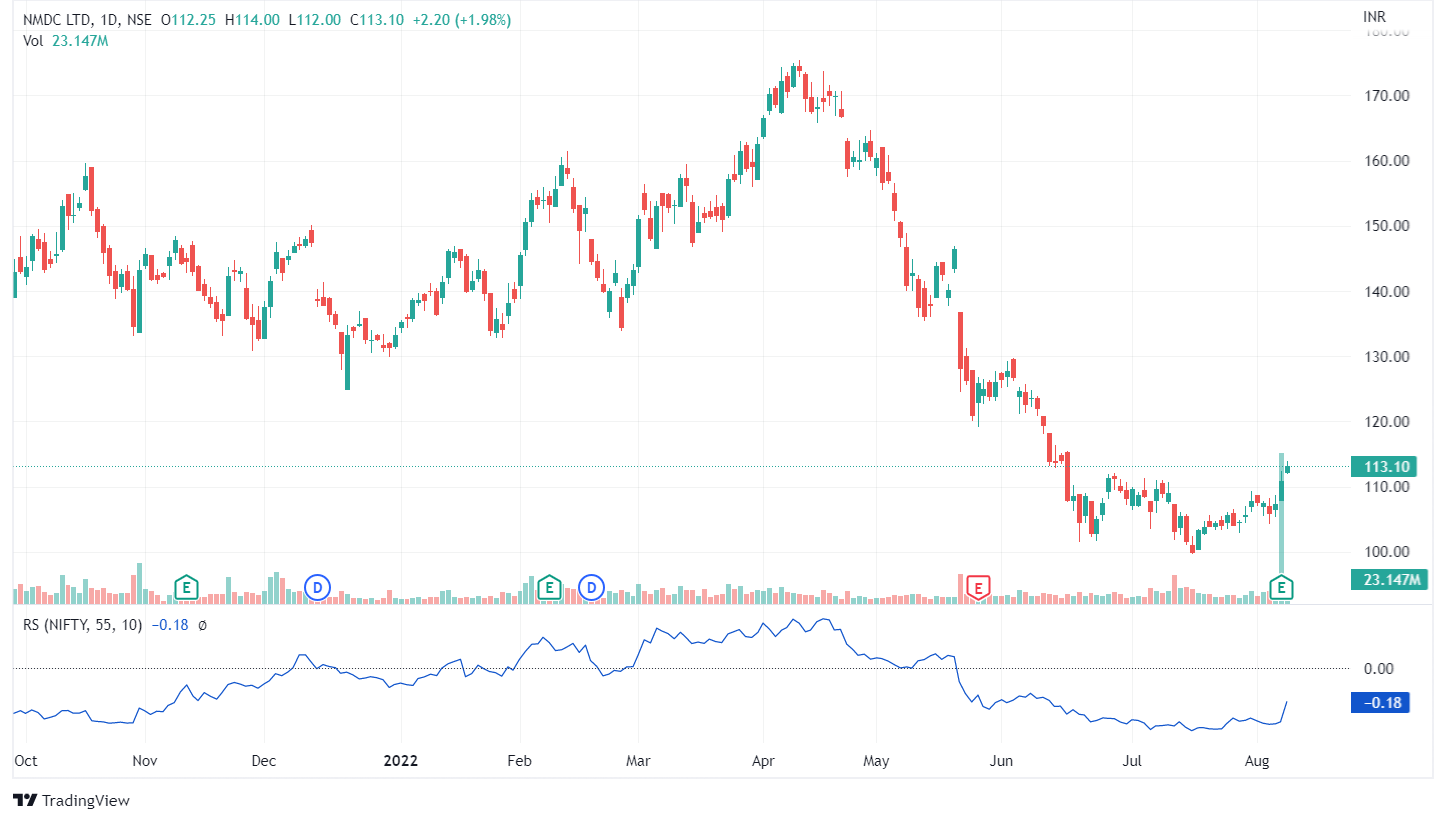
This measure helps us identify the strongest and the weakest securities or asset classes within the financial market.
Usually, stocks that display strong or weak RS over a given period tend to continue. One should note that RS analysis can be applied to domestic or international stocks, stock indexes, fixed income indexes, currencies, commodities, and other asset classes.
Watch Our Video on Momentum Indicators
Trend Indicators
Traders who follow trend trading enter a long position when the stock is trending upward. Whereas trend traders enter a short position when an asset is trending downward.0
Trend traders gain profit from trading with the trends. This trend trading method captures profits through the stock momentum analysis in a particular direction.
Trend indicators help traders analyse whether the trends will continue or reverse. Although no single technical indicator will help you gain profits, traders also need well-defined risk management and trading psychology.
1. Moving Averages
Moving average is a trend indicator that smooths out price data constantly by making average prices. On a price chart, a moving average is a flat line that reduces variations because of random price fluctuations.
The average can be of any period– say 10 days, 30 minutes, one week, or any other period the trader chooses. For long-term trend traders, the 200-day, 100-day, and 50-day simple moving averages are popular moving averages.
There are many ways to trade with the moving average:
- First, traders can analyse the angle of the moving average. If it is mostly moving horizontally, then the price ranges.
- If the moving average line angles up, the current trend is an uptrend. However, moving averages don’t predict a stock’s future value; they just reveal what the price is doing over time.
- Crossovers are another way of analysing the moving averages. Traders can plot a 200-day and 50-day moving average on the chart. A buy signal occurs when the 50-day moves above the 200-day. A sell signal occurs when the 50-day drops below the 200-day, as shown below:

2. Supertrend
As the name suggests, Supertrend is a trend indicator and indicates that the direction of the price movement in a market is trending,
A super-trend indicator is plotted either above or below the closing price. The indicator changes colour based on the change in the direction of the trend.
If the super-trend indicator moves below the closing price, then the indicator turns green and gives a buy signal. Conversely, if a super-trend closes above, the indicator shows a sell signal in red.

3. Parabolic SAR
Parabolic SAR is another famous trend indicator that highlights the direction in which a security is moving. The indicator looks like a series of dots placed either above or below the price bars on a chart.

A dot below the price indicates a bullish signal, and a dot above the price shows that the bears are in control and that the momentum may remain downward.
When the dots reverse, it indicates that a potential change in price direction will take place.
Other than the above trend indicators, one can also use Relative Strength Indicators and MACD as trend indicators.
Watch our video on Trend Indicators
Volume Indicators
Volume indicator analysis is an important technical parameter ignored by traders, especially novice traders. Yet, volume plays an important role in technical analysis that helps confirm trends and patterns.
It also indicates how many stocks were bought and sold in the market at a given period. Again, this helps us in gauging how other traders perceive the market.
One of the main benefits of volume is that it leads to the stock’s price movement, i.e., it gives us early signals when the price movement will continue or reverse. Hence volume indicators are helpful measures for a trader.
1. On-Balance indicator
On Balance Volume (OBV) is the volume indicator that calculates the buying and selling pressure as a cumulative indicator which sums up the volume on up days and subtracts volume on down days.
When the stock closes higher than the previous close, all of the day’s volume is considered up-volume. Similarly, when the stock closes lower than the previous close, then all of the day’s volume is considered down-volume. Rather than the value, one should focus on its direction.
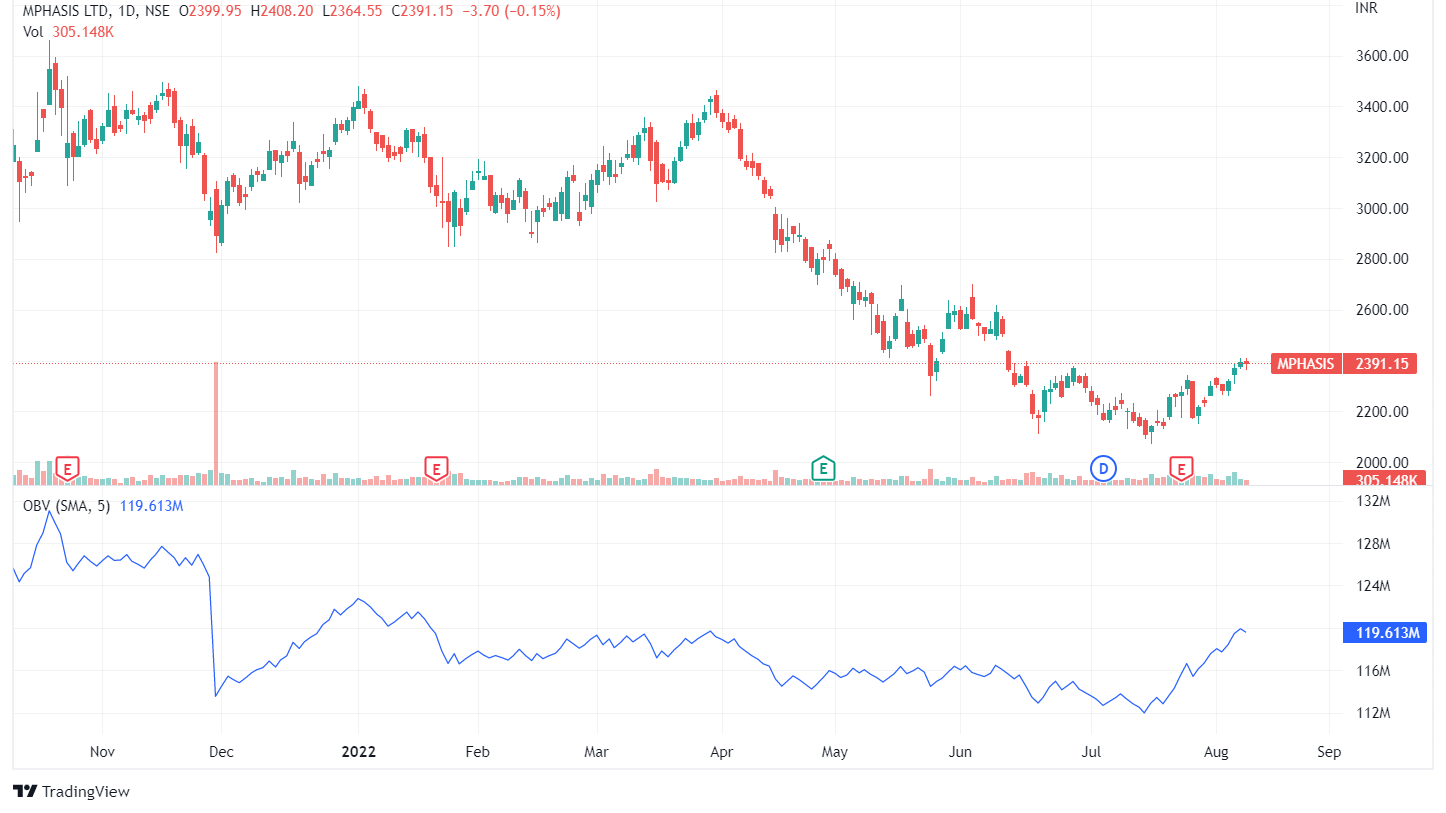
- When both prices, as well as OBV, are making higher peaks and higher troughs, then the upward trend is likely to continue, as shown below:
- When both prices, as well as OBV, are making lower peaks and lower troughs, then the downward trend is likely to continue, as shown below:
- When price continues to make higher peaks, but OBV makes lower peaks, the upward trend is likely to fail, known as negative divergence.
- When price continues to make lower troughs and OBV makes higher troughs, the downward trend will fail, known as positive divergence.
This indicator is calculated by adding the day’s volume to a cumulative total when the security’s price closes up and subtracting the day’s volume when the security’s price closes down.
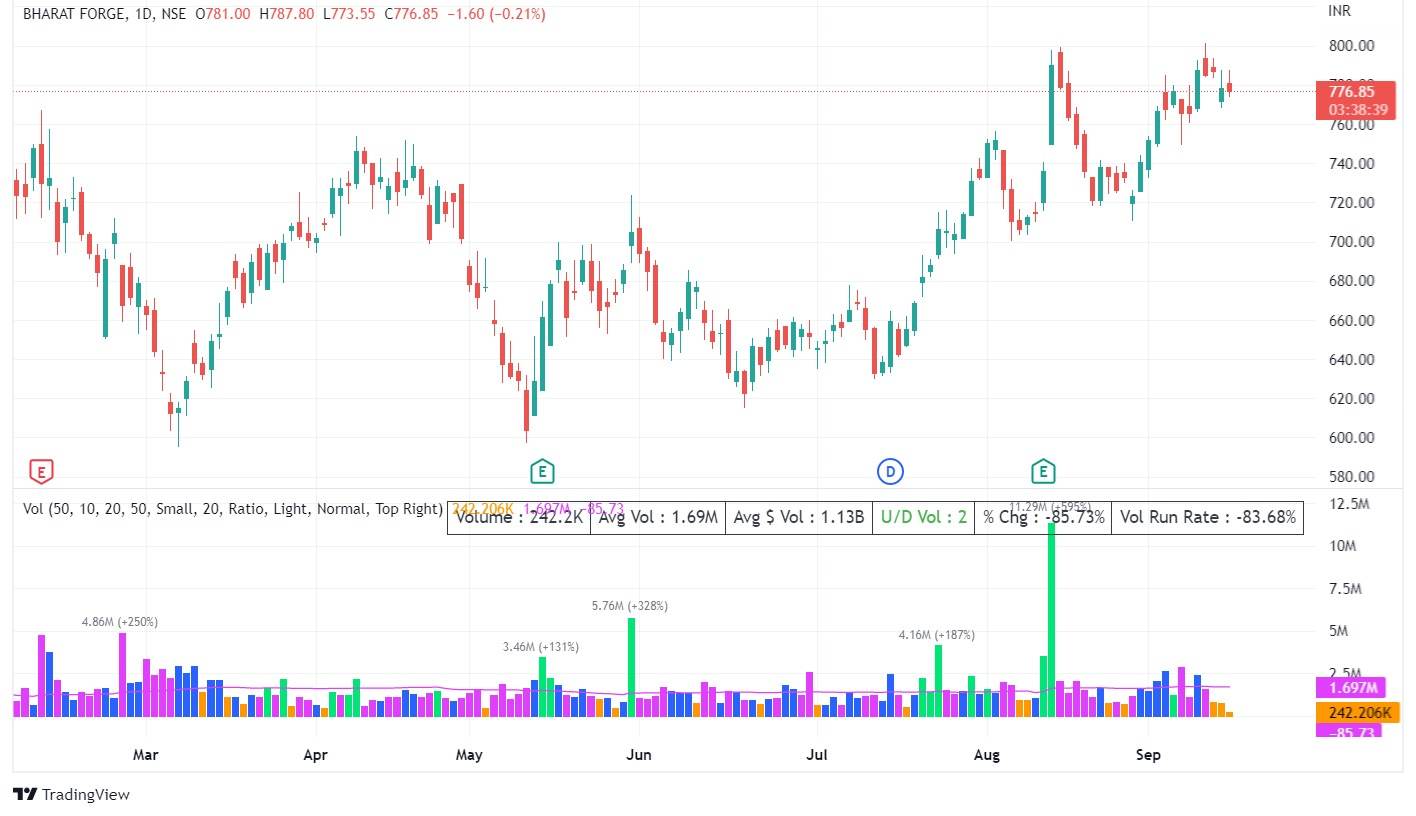
2. Trader’s Lion Enhanced Volume
The following features of TraderLion’s Enhanced Volume are highlighted below.
- High Relative Volume Bars: For the best volume interpretation on your Daily & Weekly Charts, clearly highlight high relative volume bars with a high closing range in lime green.
- Low Relative Volume Bars: Use a down arrow to clearly label low relative volume days on your daily and weekly charts to interpret constructive price and volume action.
- Volume Labels: High volume days are labelled to show two things: the total number of shares traded and the percentage above the average.
- Highest Volume in Over a Year: To identify this powerful characteristic, look for the letters HV on top of the volume bar.
- Simple Moving Average: Use a SMA overlay on your volume to save indicator slots.
- High Relative Volume Alerts: Set alerts that trigger when the volume surpasses the High Relative Volume Threshold.
3. Volume Price Trend Indicator
The volume price trend (VPT) indicator is a volume indicator that helps in determining a stock’s price direction and also the strength of price change.
The indicator consists of a cumulative volume line that adds or subtracts a multiple of the percentage change in a share price’s trend and current volume based on the security’s upward or downward movements.
This indicator is similar to the on-balance volume (OBV) indicator, i.e. it measures the cumulative volume and also provides traders with information about a security’s money flow.
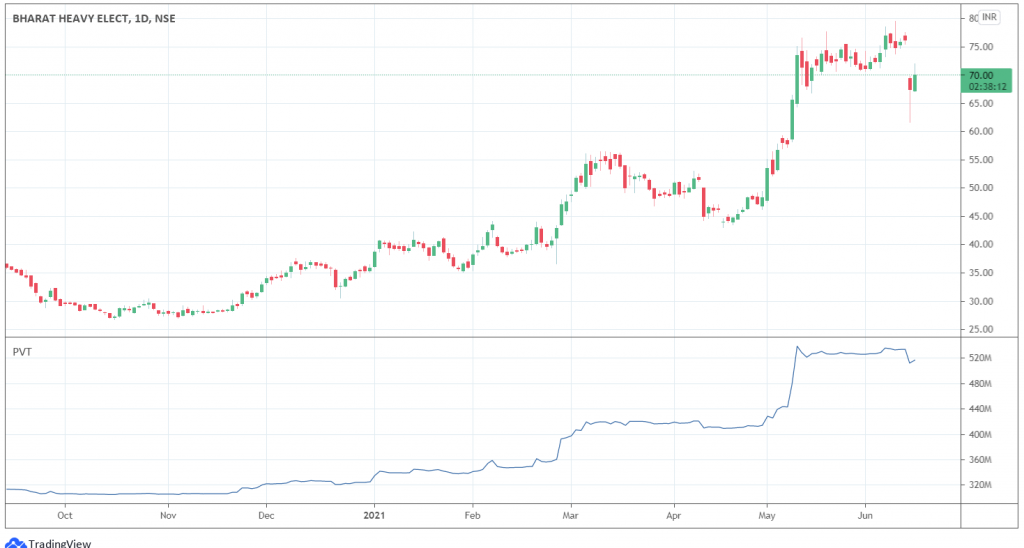
The interpretations of the VPT can be summed up as follows:
- An increase in price and volume confirms the price trend upward.
- A decrease in price and volume confirms the price trend downward.
- An increase in price accompanied by a decreasing or flat volume trend is a negative divergence suggesting that the downward price movement is weak and may reverse.
- A decrease in price accompanied by an increasing or flat volume trend is a positive divergence suggesting that the upward price movement is weak and may reverse.
4. Money flow index
Money Flow Index (MFI) is a movement and volume indicator which analyses both time and the price for measuring the trading pressure – buying or selling.
It is also known as the volume-weighted Relative Strength Index (RSI), as it includes volume, unlike RSI, which only incorporates price.
The Money Flow Index (MFI) can be interpreted similarly to RSI. Trading signals are generated by this indicator when the stock signals bullish or bearish divergence, crossovers and when the stock is in the overbought or oversold zone.

5. Chaikin Money Flow Indicator
The Chaikin Money Flow indicator is a volume indicator that helps measure the amount of Money Flow Volume over a particular period.
Chaikin Money Flow adds Money Flow Volume for a particular look-back period, typically 20 or 21 days. This indicator fluctuates above/below the zero line similar to an oscillator.
According to this indicator, when the closing price is near the high, then more accumulation takes place. Similarly, when the closing price is near the low, more distribution occurs.
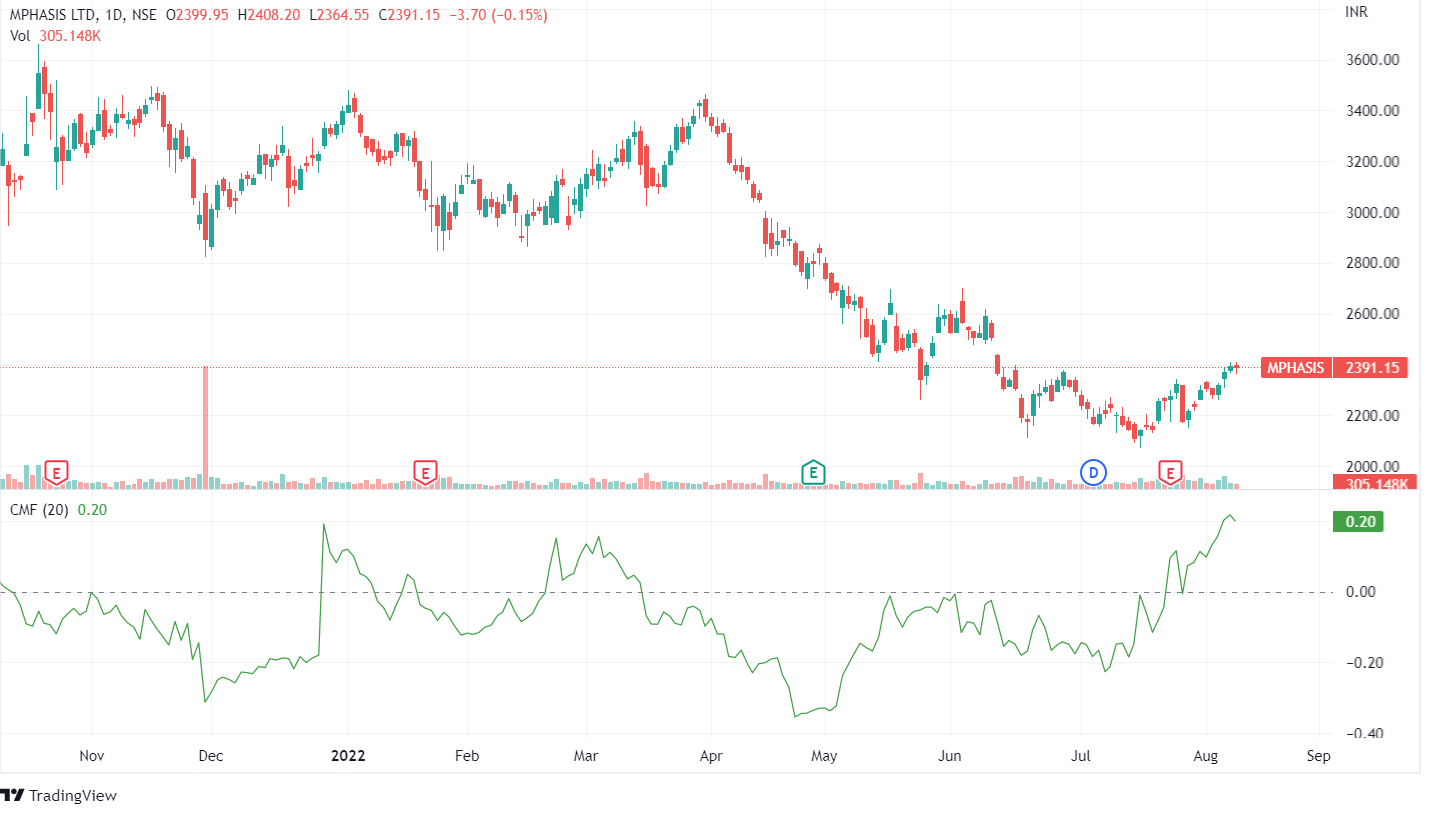
- A CMF value above the zero line signals strength in the market, whereas a value below the zero line signals weakness in the market.
- One should wait for the CMF to confirm the breakout direction of price action; for example, if a price breaks upward through resistance, then one should wait for the CMF to have a positive value for confirming the breakout direction.
- A CMF sells signal occurs when the price makes a higher high into overbought zones, with the CMF diverging with a lower high, which is known as negative divergence.
- A CMF buys signal occurs when the price makes a lower low with the CMF diverging with a higher low with positive divergence.
6. Accumulation/Distribution
The Accumulation Distribution Line is a volume indicator which measures the cumulative flow of money into and out of stock.
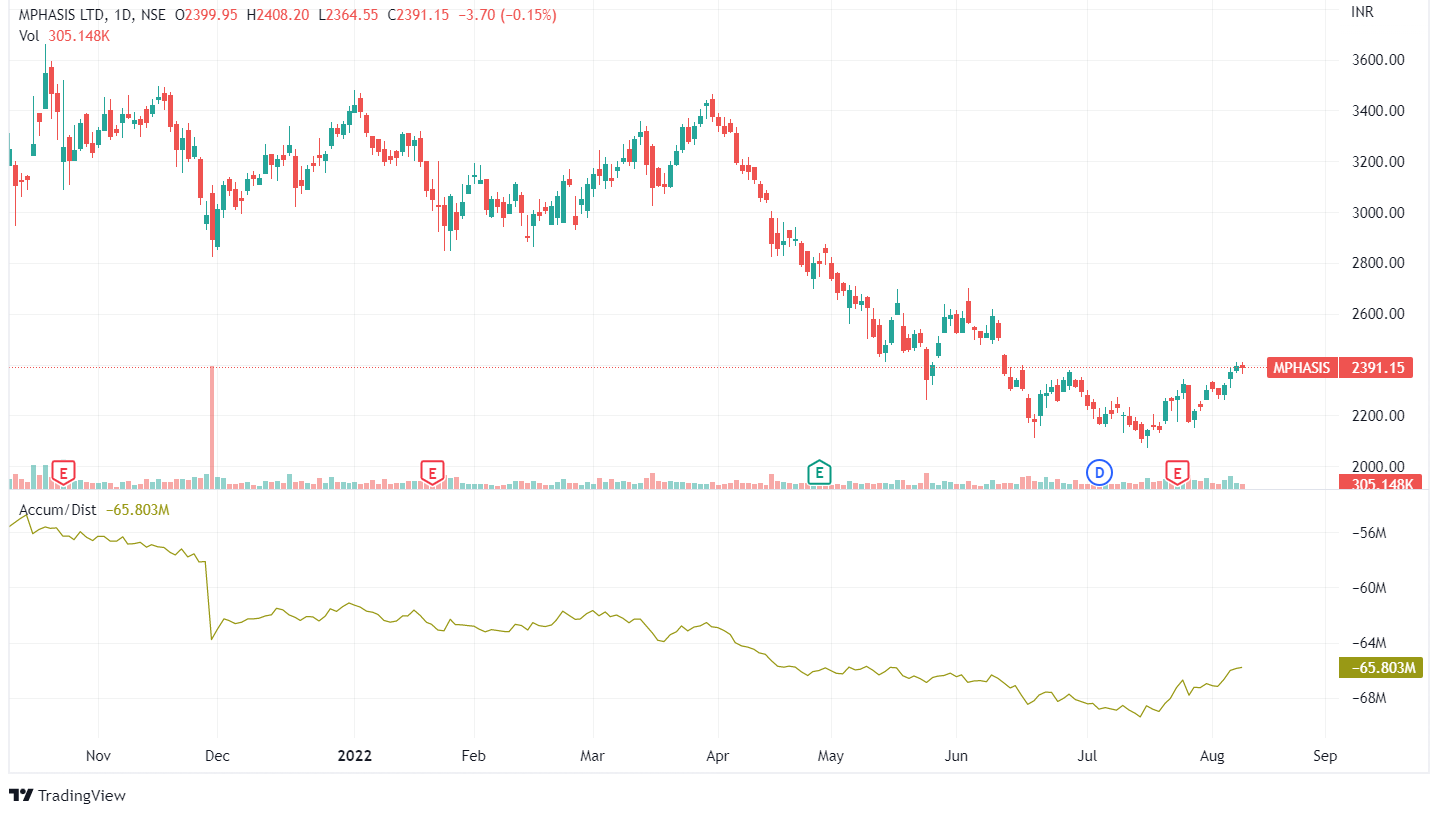
A high positive multiplier with high volume indicates strong buying pressure, which pushes the indicator higher. On the other hand, a low negative number with high volume indicates intense selling pressure, pushing the indicator lower.
This indicator tries to detect positive or negative divergences in price and volume data which signals an advanced warning of future price movements.:
A trader who is accumulating stock is simply purchasing stock. Also, a trader who is sharing stock with the market is selling.
Thus, accumulation/distribution indicators size up demand and supply, which drives price movement.
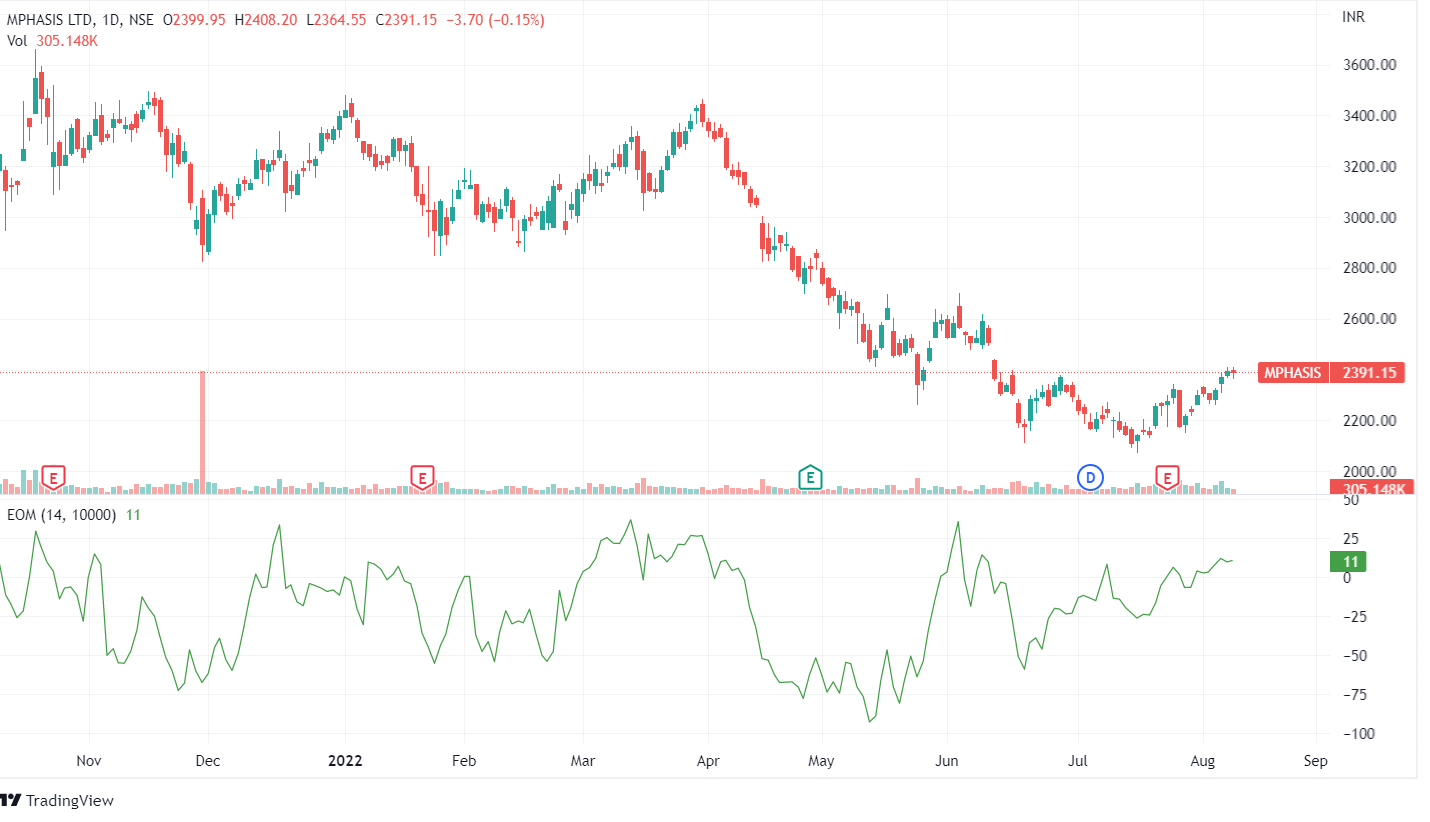
7. Ease of Movement
The Ease of Movement indicator, another important volume indicator, helps measure the ‘ease’ with which a stock price moves between different levels based on volume trends. An easy-moving price continues in its trend for a particular period.
This indicator works best in volatile markets where the trends cannot be clearly seen. This indicator is best when it is used for longer time frames, like a daily chart, as it identifies trends based on volume averages. This indicator generates buy and sell signals when it crosses the 0 centreline or makes bearish or bullish divergences, as shown in the chart below:
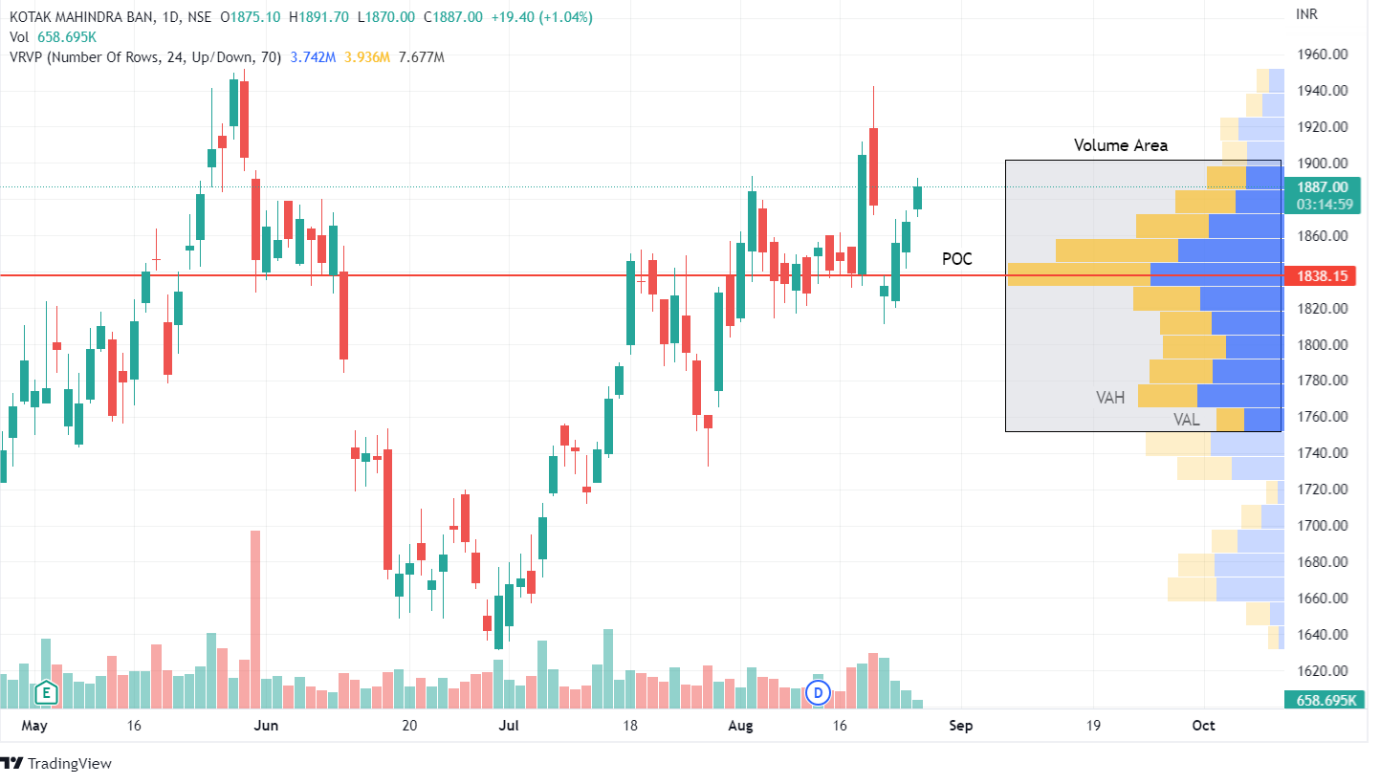
8. Volume at Price
A volume profile is a horizontal graph depicting the volume traded at a specific price over a specified period. What distinguishes this from a traditional horizontal volume profile at the bottom of your chart?
Here’s a comparison of the volume profile to the more traditional horizontal volume tool.
The benefit of using this volume indicator is that it allows you to see how many trades occurred at each price point for each trading day.
Volume on a time frame is meaningless because it only tells you the buying or selling intensity within the current candle. Traditional horizontal volume is ineffective for trade entry. A volume profile is a vertical breakdown of how many shares are available.
Before we get into explaining this volume indicator, there are some terms which you need to understand:
- The Value Area (VA) is the price range in which 70% of the total volume was traded, and it is frequently coloured differently for easier visualisation.
- Value Area High (VAH) – This is the highest price in the 70% total value area.
- Low-Value Area (VAL) – the lowest price in the 70% total value area.
- The Point of Control (POC) is the single price level where the most volume was traded for the session and represents the area with the most open trading positions.
9. Volume-Weighted Average Price
The volume-weighted average price shows the average price an asset has traded at throughout the trading session when both the price and volume are considered.
This indicator shows the value the security is trading at, indicating if the security was bought or sold at a fair price.
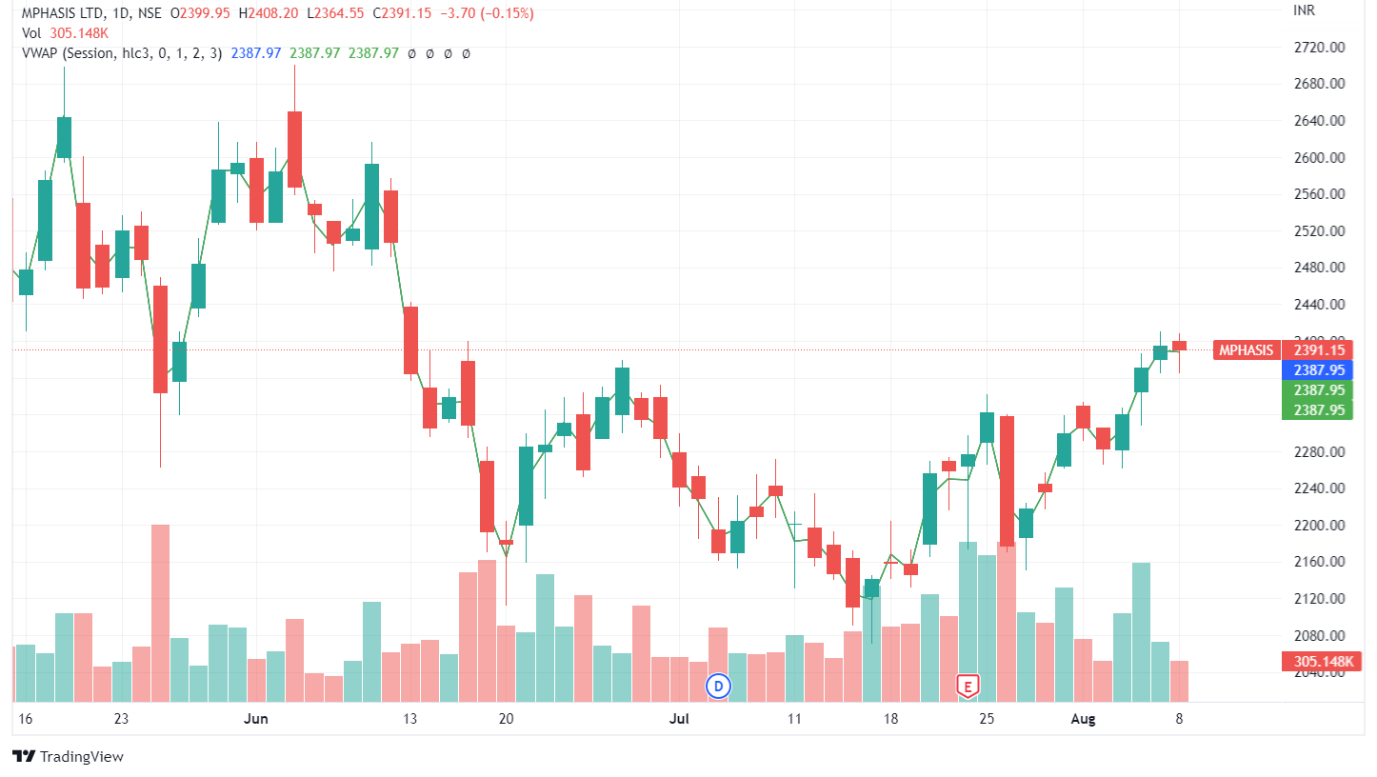
Traders use the VWAP to eliminate the noise in the market to get an idea of what prices buyers and sellers are willing to transact.
Watch our video on Volume Indicators
Volatility Indicators
When trading in the stock market, we should not only look at whether the market is trending or consolidating but also deal with Volatility. Thus, the traders need to understand the volatility indicators, which can help them to trade more effectively.
Volatile periods in the stock markets can create big swings, making it difficult for traders to trade. In addition, extreme Volatility can be seen in the market when certain extreme news comes.
High Volatility can be seen when the market is trending, and low Volatility occurs during the consolidation phase of the market.
Below are the volatility indicators that help the traders to gauge Volatility in the market:
1. Bollinger Bands
Bollinger Bands consist of 3 bands: the upper, lower and middle bands. The middle band is the 20 days or bars moving average, the upper band is +2 Standard Deviation, and the lower band is the -2 Standard Deviation of the middle band.
When the Volatility in the market increases, these bands expand, and when the Volatility decreases, these bands contract. Traders can trade with the Bollinger bands when the prices break out from either side of the upper or lower bands after the low Volatility or consolidation phase.

2. Keltner Channel
Keltner Channels is a volatility-based indicator placed on either side of the stock’s price and helps determine the direction of a trend. The Keltner channel uses the average-true range (ATR) with breaks above or below the top and bottom barriers that signal a trend continuation.
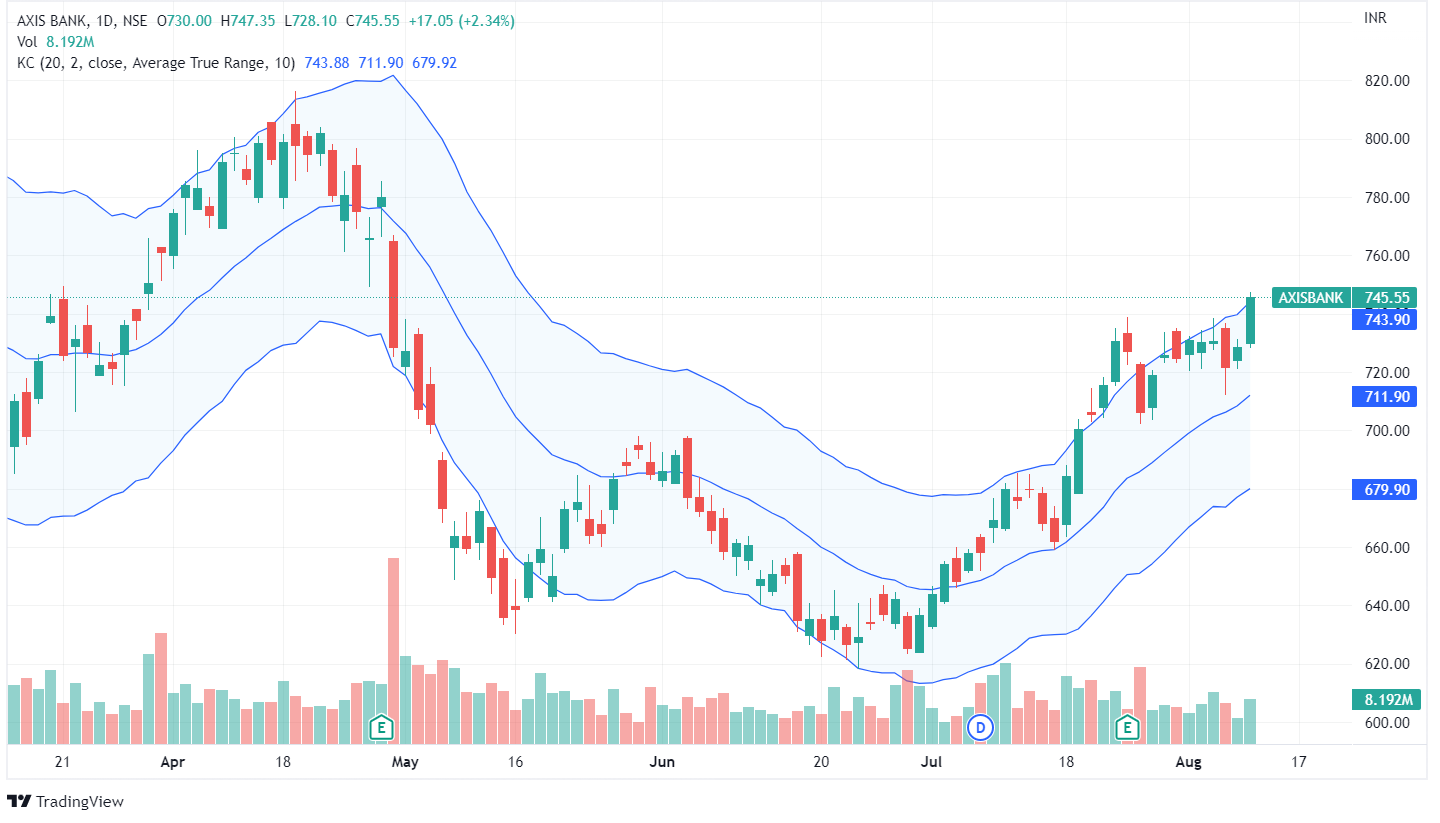
The middle line is an exponential moving average (EMA) of the price. The upper band is usually set two times the ATR above the EMA, and the lower band is set two times the ATR below the EMA. These bands generally expand and contract as Volatility is measured by ATR expands and contracts.
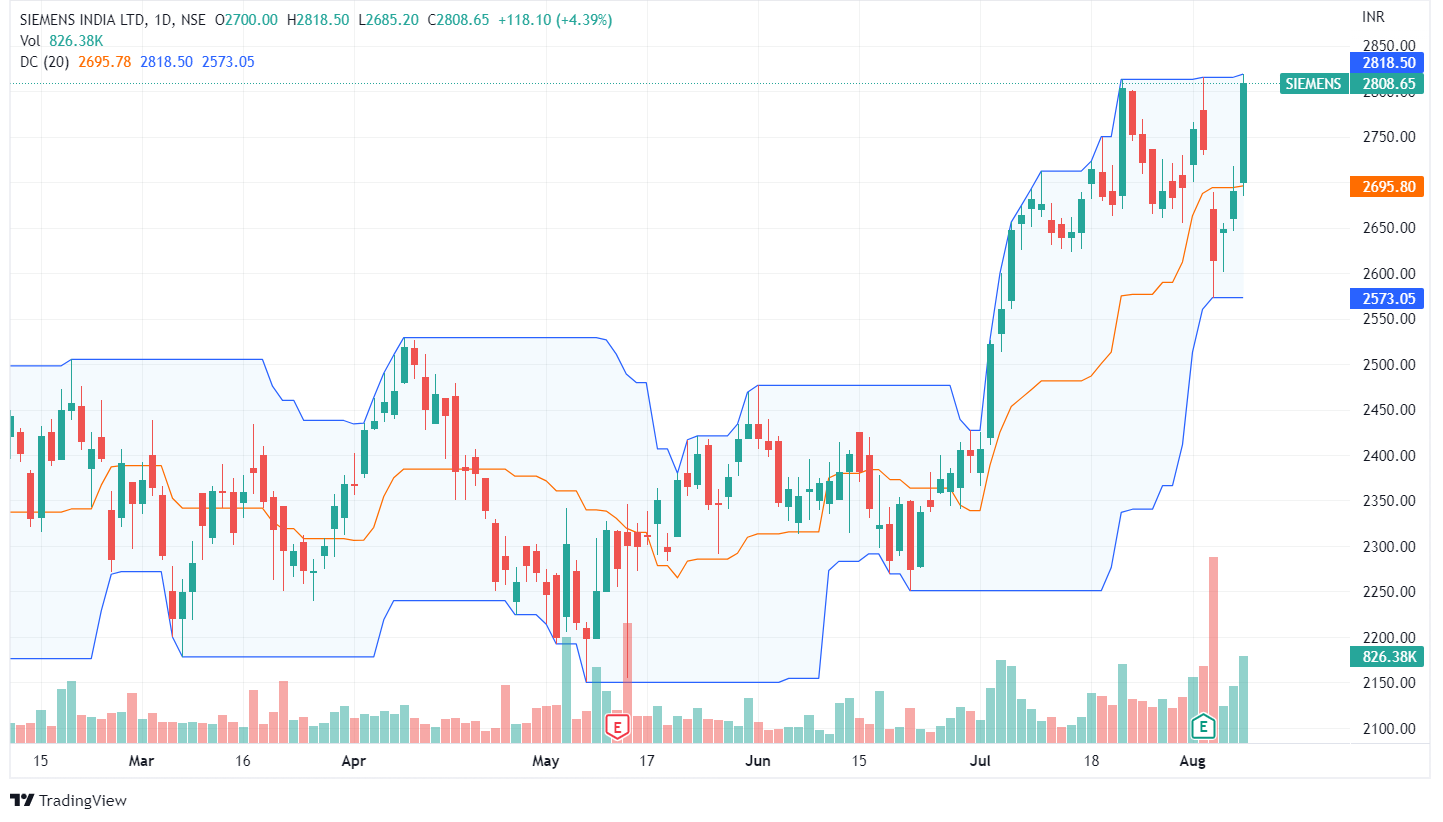
3. Donchian Channel
Donchian Channels is a popular volatility indicator determining Volatility in the market prices. This indicator is created by three lines generated by moving average calculations.
It consists of three bands: upper and lower bands around a median band. The upper band shows the highest security price, whereas the lower band shows the lowest security price over a specific period, usually 4 weeks. The area between the upper and lower bands is the Donchian Channel.
Traders can enter a buy trade when the prices break from the upper band, and they can enter a short position when the prices break from the lower band.

4. Average True Range (ATR)
The ATR measures the true range of a particular number of price bars, usually 14. ATR is a pure volatility measure that does not necessarily indicate a trend. Volatile price movement can occur inside a choppy market during an important news event.
The best way of using the ATR is to indicate the change in the market’s nature. A rise in ATR indicates higher trading ranges and, thus, an increase in Volatility. In contrast, low readings from the ATR indicate periods of quiet or uneventful trading.
Watch our video on Volatility Indicators
Breadth Indicators
What exactly do we mean when we talk about market breadth? The Market Breadth reflects the participants in the market. It can be construed in a number of different ways. The number of stocks participating in a rally can be calculated using breadth. The number of active investors in the market can also be deduced from breadth.
The fundamental question whenever the markets rally is whether the rally is sustainable. The size of the marketplaces determines this.
A market rally is usually accompanied by market breadth, which is considered more sustainable. On the other hand, if the market has been rallying with diminishing width, this is interpreted as a sign of waning confidence in the market.
Below are the breadth indicators:
1. Percent/Number of Stocks Above Moving Average
A breadth indicator gauges internal strength or weakness in the underlying index by the percentage of stocks trading above a specified moving average. Short-to-medium-term periods are covered by the 50-day moving average, while the 150-day and 200-day moving averages cover medium-to-long-term timescales.

Overbought/oversold levels, crossovers above/below 50%, and bullish/bearish divergences can all be used to generate signals. A bullish bias is present when the indicator is above 50%. This means more than half the stocks in the index are above a particular moving average. Conversely, a bearish bias is present when below 50%.
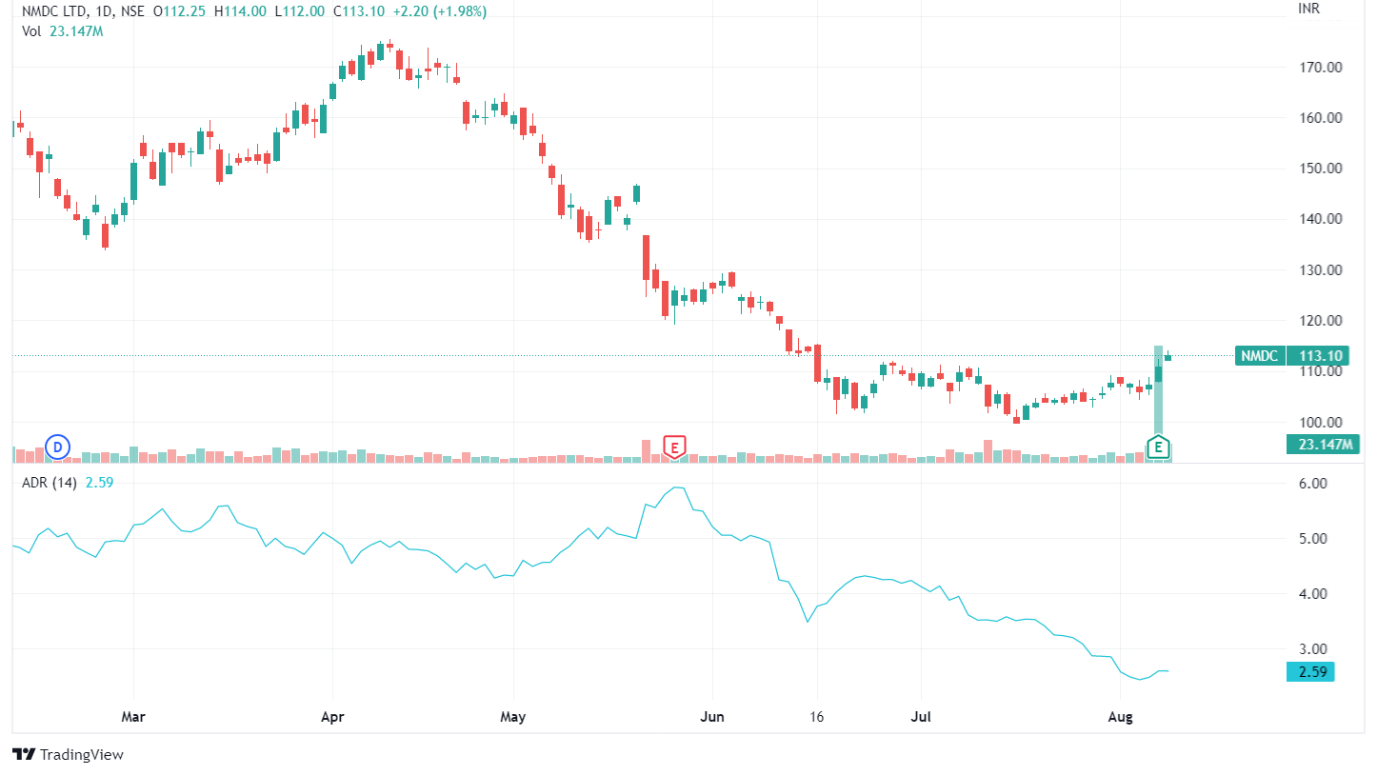
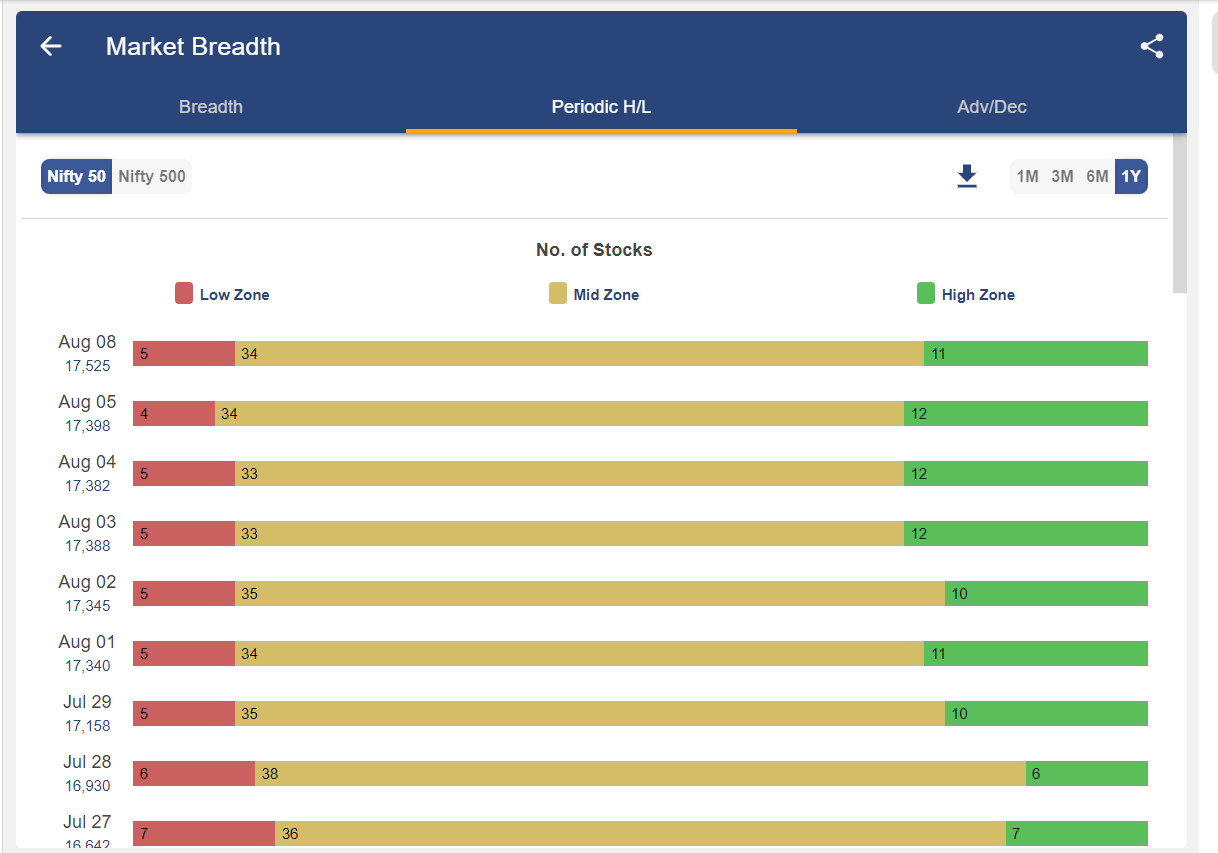
2. Periodic High and Lows
The high and low levels in a specific period are periodic highs and lows. Users can see the number of stocks trading around their periodic high or low for various periods.
When securities trade at a price within 20% of its High-Low range, it is eligible to be included in the Period High/Low Analysis.
3. Advance/Decline
The advance-decline ratio refers to the number of advancing shares divided by the number of declining shares. The advance-decline ratio can be used for various timeframes, such as one day, week or month.
This indicator indicates whether the market is overbought or oversold on a standalone basis. The bar chart shows the advance/decline for different periods of Nifty 50 / Nifty 500.

If advances are greater than declines consistently, an uptrend is indicated and if declines are greater than advances consistently, a downtrend is indicated. As the number of Advances increases, it indicates that stocks are performing better comparatively, and an overall uptrend will come by.
Don’t miss out, enroll today to upskill your trading with our Algorithmic Trading Course. Explore the Best 25 Technical Indicators
Bottom Line
When analysing security, traders frequently employ a plethora of technical indicators. With thousands of different options, traders must select the best indicators and become familiar with how they operate.
To generate trade ideas, traders may combine technical indicators with more subjective forms of technical analysis, such as chart patterns. Given their quantitative nature, technical indicators can also be incorporated into automated trading systems.
Frequently Asked Questions (FAQs)
1. What is a technical indicator?
A technical indicator is a mathematical formula that predicts future changes in the price of financial markets by using previous price, volume, or open interest data.
2. What is the purpose of using technical indicators?
Technical indicators aid in risk management, price confirmation, trend analysis, and the identification of possible entry and exit locations for traders and investors.
3. How are technical indicators categorized?
Based on how they perform, technical indicators can be divided into several groups, such as volume-based indicators, trend-following indicators, momentum indicators, and volatility indicators.


