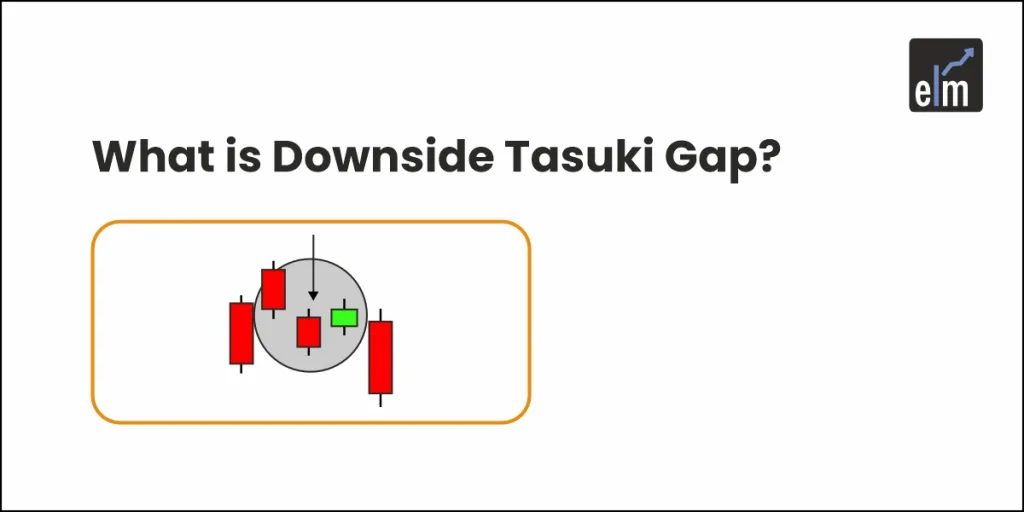
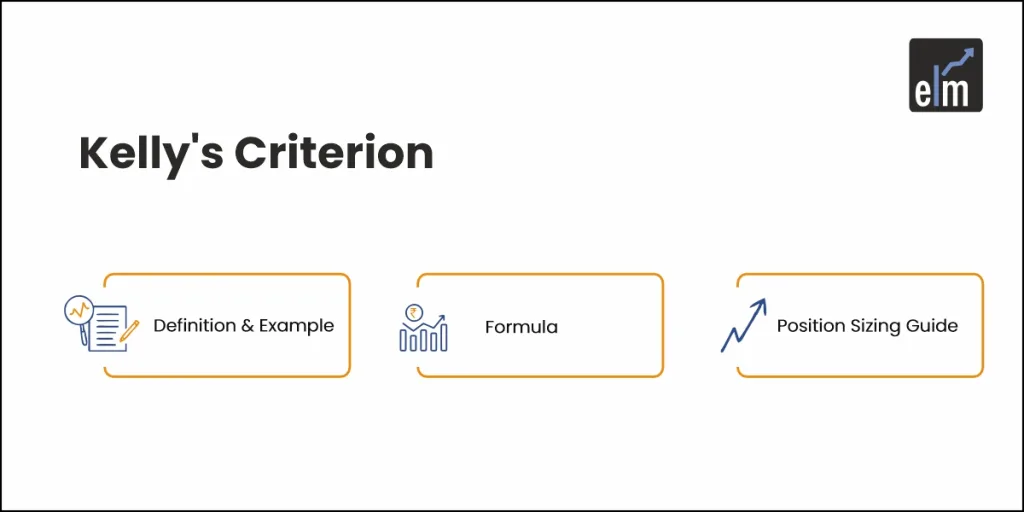
Tag: technical analysis
How to get spot trending moves using Alligator indicator?
The alligator indicator developed by Bill Williams consists of three smoothed moving averages which help in identifying trend and its direction. The three lines are simply placed on the price [more]
Introduction to Bar Chart in Technical Analysis
Technical analysis is one of the important methodologies of stock selection and to make buy or sell decision. Before we start analysing any chart, the first selection we make is [more]
Master Pitchfork channel to improve your trading experience
Pitchfork developed by Alan Andrews is a trend channel tool consisting of three lines- a centre median line and pair of lines above and below the median line which are [more]
5 important roles of Relative Strength Index (RSI)
Relative Strength Index (RSI) is a momentum oscillator, developed by J. Welles Wilder, which measures the speed and velocity of price movement of trading instruments (stocks, commodity futures, bonds, forex [more]
6 Tenets of Dow Theory
Dow Theory is a trading approach developed by Charles Dow who is also known as the father of Technical Analysis. It is still the basis of technical analysis of financial [more]
A comprehensive study on Support and Resistance
Two of the most basic, yet effective, technical patterns are support and resistance. These events are horizontal trendlines which cause a stock’s direction to reverse. When prices are falling, support [more]
Force Index
The Force index measures the strength behind the price move based on three important parameters which includes volume, direction and extent. It was invented by Alexander Elder and this oscillator [more]
15 Gann techniques which every trader should know
Gann Techniques are technical analysis tools that were developed by the renowned financial trader William Delbert Gann (WD Gann), during his career on Wall Street which spanned the first half [more]
How to identify long term trades using Coppock curve?
The Coppock Curve is a momentum based indicator invented by Edwin Coppock in the year 1965. The signals generated by this curve are actually very simple and helps in identifying [more]
How to identify trend and correction using Force Index?
The Force Index measures the strength behind the price move based on three important parameters which includes volume, direction and extent. It was invented by Alexander Elder and this oscillator [more]