Have you ever watched a stock skyrocket in price and thought, “If only I had bought earlier?” That’s where breakout trading comes in.
One of the most sought-after and thrilling methods employed by traders to gain from wild price movements in the financial market is breakout trading. It generally involves spotting future trends at the initial stages and going long or short on them by tracking the crucial levels of support and resistance.
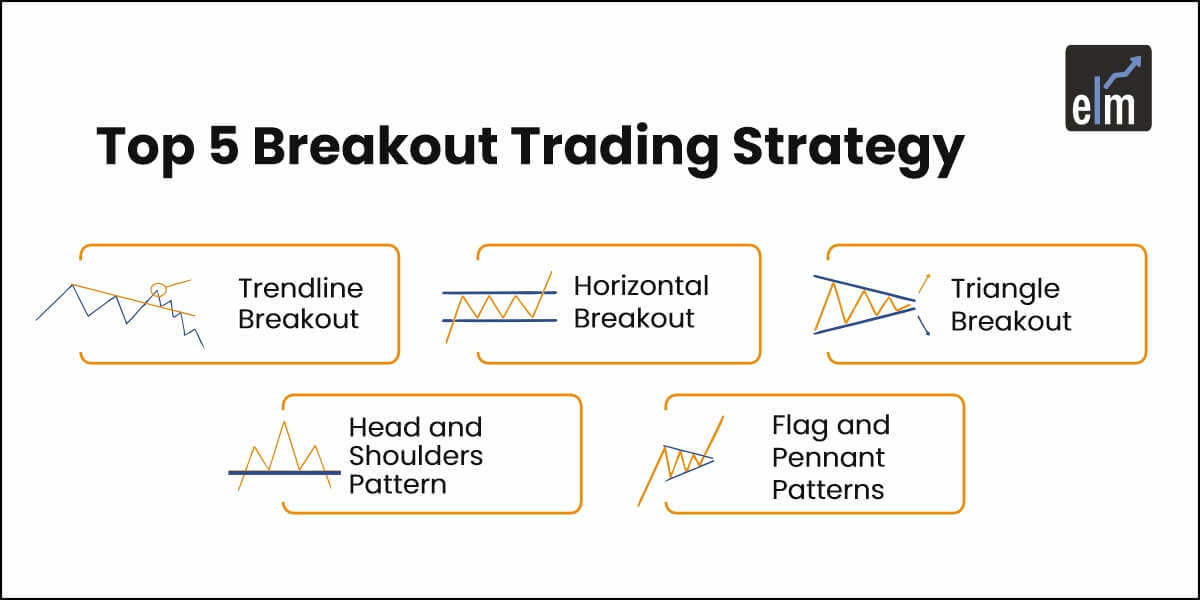
Below are the top 5 breakout trading strategies that will assist you in avoiding typical market risks, realizing maximum gains, and creating momentum.
What is Breakout Trading?
Breakout trading is a trading system that attempts to profit from price action whenever an asset or stock breaks out above or below its defined trading range. Support and resistance levels are employed to define the range, and these are important points or levels where the price of an asset will usually bounce off or break through.
When the price of an asset breaks such levels, it generally indicates a shift in sentiment in the market and the start of a trend.
But remember that not every breakout is worth following. Some are nothing but fakeouts intended to catch traders on the wrong side. How do you then distinguish between genuine breakouts and market noise? More importantly, how do you trade them for profit? Let’s discuss that in greater detail.
How Breakout Trading Works?
Assume you are watching a cricket match and there is a batsman who keeps scoring boundaries. The excitement builds up as he breaks his previous highest score. This is his break moment! In trading, a breakout is very similar.
Breakout trading strategies is to find the critical price points where the stock repeatedly finds support or resistance at the top, i.e., the resistance point or the bottom, i.e., the support point. The traders enter when the price finally breaks out of these points on high volumes, expecting the movement to continue in the same direction.
Let us explore its various main steps:
- Identifying Consolidation Phases: The traders search for the phases when the asset price fluctuates in a narrow or tight range, or in simple terms, stocks consolidating close to resistance or support, reflecting equilibrium between buyers and sellers.
- Tracking Support and Resistance Levels: They are detected with the help of technical analysis tools like trend lines, moving averages, or chart patterns.
- Entering Trades: Traders enter a trade in the direction of the breakout when the price breaks a support or resistance level. If the price breaks above resistance, for instance, traders go long; if it breaks below support, they go short.
- Risk Management: Stop-loss orders are utilized by traders to contain potential loss and adjust or redirect their profit targets as the trade develops.
How to Read Breakout Indicators?
To validate a breakout, the following are some major indicators that traders can use:
- Volume Analysis:
Volume expansion on the breakout is a positive sign that the move is justified and an indicator of high market participation. Low-volume breakouts, by contrast, will be weaker because they are grounded on the opinion of fewer participants than the entire market.
- Technical Indicators:
- Moving Average Convergence Divergence (MACD): MACD detects changes in momentum. A breakout that is accompanied by a bullish or bearish MACD cross can support the case for a long-term move.
- Relative Strength Index (RSI): The RSI gauges the magnitude of recent price action to determine whether they are overbought or oversold. A break with an RSI that is not in an extreme area (e.g., below 30 or above 70) can be more authentic.
- Bollinger Bands: They are used to measure volatility and can be used to identify breakouts. Prices moving above or below the bands usually indicate a dramatic change.
- Chart Patterns:
Breakouts usually occur near major support or resistance levels. A support breakout or a resistance breakout can be employed to confirm the trend. Trend lines can also serve as dynamic resistance and support points, and a trend line breakout can caution one of potential trend continuation or reversal.
- Candlestick Patterns:
- Engulfing Candles: These patterns, in which one larger candle engulfs the previous candle, could indicate a strong and heavy breakout.
- Hammer or Shooting Star: Reversal charts like these might be marking the start of the break-through in the event they occur at pivotal prices.
- Momentum Indicators:
Stochastic Oscillator is one of the indicators that measure the closing price in relation to its price range during a specified time frame. A confirmed breakout by a stochastic oscillator exiting the oversold or overbought area may be more reliable.
- Price Action:
This includes gap breakouts, where a big price rise without intervening trading levels may reflect a sudden shift in market mood.
5 Breakout Trading Strategies and its Types
- Trendline Breakout
A trendline breakout happens when the price moves above or below a major trendline plotted by connecting some highs or lows on a chart. It may indicate continuation or a reversal of the ongoing trend. Trendlines may prove extremely useful in uncovering hidden support and resistance levels.
How to Trade:
- Plot a trendline along the highs or lows of a pullback within an uptrend or downtrend.
- Begin a trade when the price breaks through this trendline, i.e., either the sellers or the buyers are in control.
Risk Management: Use the trendline as a moving stop-loss level to track your position and contain possible losses.
- Horizontal Breakout
Horizontal breakouts occur when an asset’s price crosses a strong horizontal support or resistance level. This usually happens after a lengthy period of trading inside a small range, indicating a change in market sentiment.
How to Trade:
- Locate and identify strong horizontal support or resistance levels where the price has bounced several times.
- Enter a trade when the price firmly breaks through these levels, as shown by higher volume and a retest of the broken level.
Risk Management: To manage risk in this breakout trading strategies, place stop losses immediately beyond the broken level.
- Triangle Breakout
Triangular breakouts occur when the price breaks out of a triangular pattern formed by converging trend lines. This pattern might be descending, ascending or symmetrical, and a break from it typically indicates a strong shift in direction.
How to Trade: Wait for the price to break above the higher trendline for a long trade or below the lower trendline for a short trade. Use the increased volume to confirm the breakout.
Risk Management: Set stop-losses immediately beyond the opposing trendline of the triangle.
- Head and Shoulders Pattern
The head and shoulders pattern is a reversal pattern that may indicate a breakout. It consists of a peak (the head) and two small peaks (the shoulders). A breakthrough below the neckline (the line that connects the shoulders) can imply a decline, but a breakout above can indicate an upward trend.

How to Trade: Locate and identify the head and shoulder design and create a neckline. If the price falls below the neckline, enter a short trade; otherwise, enter a long trade.
Risk Management: Place stop-losses above or below the neckline, based on the direction of the trade.
- Flag and Pennant Patterns
Flag and pennant patterns are continuing patterns that develop or form during a trend. A flag is a rectangular design, but a pennant is triangular. A breakout from these patterns frequently extends the previous trend, allowing traders to enter or add to positions.
How to Trade: Recognise these patterns during a strong trend. When the price breaks out of the flag or pennant, enter a trade in the trend’s direction, which is usually accompanied by increasing volume.
Risk Management: To limit risk, set stop losses just beyond the breakout point.
Advantages of Breakout Trading
Breakout trading offers several advantages, including the following:
- Early Trend Detection: It allows you to enter trades at the beginning of a new trend, potentially maximising your profits.
- High-Profit Potential: Breakout trading can result in significant returns, particularly if traders accurately spot powerful breakouts. This is especially true in volatile markets such as cryptocurrency, where price fluctuations may be swift and significant.
- Applicability Across Markets: Breakout strategies can be applied in various financial markets, including stocks, forex, and commodities.
- Clear Entry and Exit Points: This strategy uses clear signals to enter and exit trades, making it easier to manage positions accurately.
Limitations of Breakout Trading
Despite its advantages, breakout trading also has limitations:
- False Breakouts: Not every breakout is legitimate. False breakouts occur when the price momentarily moves past a support or resistance level before reversing direction, potentially resulting in losses for traders who invested based on the initial breakout.
- Emotional Bias and Overtrading: Trading based on emotions such as fear or greed can impact and influence your decisions, resulting in impulsive trades. Traders may leap into any breakthrough, even in turbulent or sideways markets, resulting in overtrading and unnecessary losses.
- High Trading Costs: Frequent breakthrough trading can incur large trading costs, including brokerage fees. These expenditures might limit profits.
- Dependence on Technical Analysis: This strategy is primarily reliant on technical indicators and chart patterns, which may not always precisely forecast market movements, particularly in the event of unexpected news or events.
Final Thoughts
For individuals who want to profit from emerging market trends, breakout trading is a useful tool. Learning technical analysis can help investors hone their craft and adapt to evolving market conditions by studying the various forms of breakouts, how to spot them, and how to utilize them on the trading floor.
By using good risk management strategies and being cautious of false breakouts, you can succeed in this fast-paced business world. Wish to be a breakout trading expert? With Elearnmarkets, avail breakout trading strategies webinars by our experts that will help you improve your trading skills right away!


