Price and volume are two of the most basic but essential indicators in technical analysis used to predict price movement.
To take care of price and volume data, you may use the Money Flow Index (MFI).
The money Flow Index is a momentum oscillator that identifies the momentum of a stock’s outflow and inflow of money over a given time period.
It is one of the most popular technical tools found on most trading platforms.
What is the Money Flow Index?
A technical analysis instrument used in the stock market to measure buying and selling pressure is the Money Flow Index (MFI). This kind of oscillator indicates if an investment is overbought or oversold by producing signals between 0 and 100.
In contrast to many indicators that just include price, MFI takes trading volume into account to provide a more balanced picture. Strong buying pressure is indicated by higher volume and rising prices, and vice versa.
An MFI of 80 or more is typically regarded as overbought, indicating that a correction in price may be imminent. In contrast, an MFI of less than 20 suggests that the asset may have been oversold. These cutoff points may change based on the state of the market.
Divergences between the indicator and the price can also be found with MFI. A possible reversal in the price trend may be indicated if the MFI is growing while the price is either declining or staying flat.
Transform Your Trading Strategy: Sign Up for Technical Analysis Course and Gain a Deep Understanding of Chart Patterns!
Calculation
The Money Flow Index (MFI) calculation involves the following steps-
1. Typical Price = (High + Low + Close)/3

2. Raw Money Flow = Typical Price x Volume
3. Money Flow Ratio = (14-period Positive Money Flow) / (14-period Negative Money Flow)
4. Money Flow Index = 100 – {100 / (1 + Money Flow Ratio)}
MFI interpretation
MFI is also known as a volume-weighted version of RSI as it is interpreted similarly to an RSI oscillator; however, the main difference in MFI is with regard to volume.
Due to the volume feature, MFI works a little differently than RSI.
Computing the indexed value depending on the number of bars (as specified in the money flow index setting) plots a line on the chart that oscillates between 0 and 100 levels.
With the rise in stock price, the MFI also goes up, which signals increasing buying pressure.
On the other hand, MFI goes down with the decrease in price, signalling decreasing buying pressure. Thus, you may predict the directional movement of the market simply by keeping a watch on MFI.
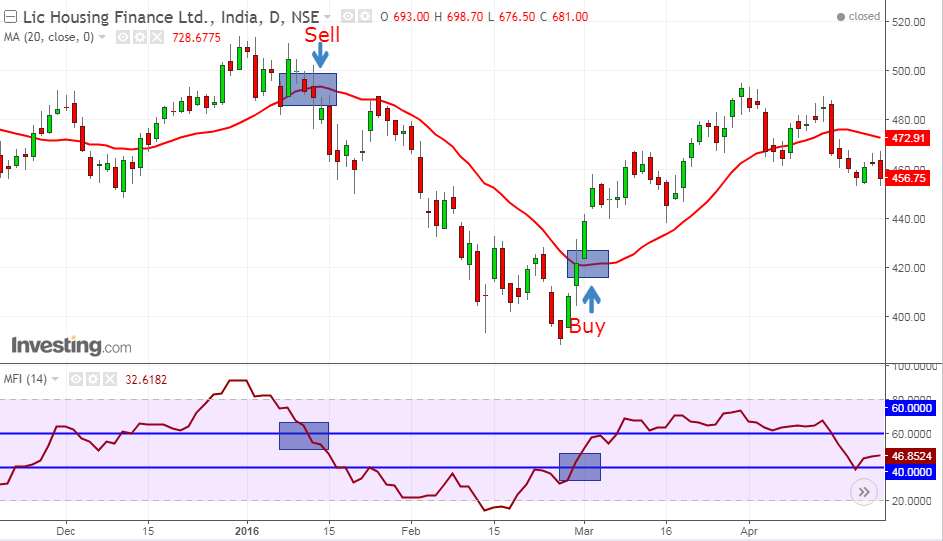
Strategies using MFI
Case 1: When the price cuts above 20 SMA from below and simultaneously, MFI also cuts above the 40 line, it generates a buy signal.
Case 2: Similarly, when the price cuts below 20 SMA from above and MFI also cuts below the 60 line, it generates a sell signal.
Conclusion
Like other technical indicators, MFI should also be used in conjunction with other technical analysis tools like chart patterns, volume and breakouts can be used to get confirmed signals produced by MFI.
In order to get the latest updates on Financial Markets, visit StockEdge
Frequently Asked Questions (FAQs)
1. What is the Money Flow Index (MFI)?
A technical analysis indicator called the Money Flow Index (MFI) gauges the amount of buying and selling pressure influencing a security’s price movement. It determines overbought or oversold situations by taking into account both price and volume data. An oscillator type known as MFI produces values in the range of 0 to 100.
2. How is MFI calculated?
Price and volume data are often taken into account during a 14-day period in a multi-step computation procedure known as MFI. The typical price, money ratio, raw money flow (both positive and negative), and lastly the MFI itself are all calculated.


