The Chaikin Money Flow Indicator is a volume indicator created by Marc Chaikin (as well as the Chaikin oscillator). The indicator measures the amount of money that flows over time. The indicator is the foundation for the accumulation and distribution indicator.
The Chaikin Money Flow is a single line that moves up and down on a chart. It does resemble the A/D indicator. The CMF is shown in green in the chart below, while the A/D is shown in red. As a result, if you know how to use the A/D line, the CMF will be a simple indicator.
Let’s discuss the Chaikin Money Flow Indicator and how to use it.
What is Chaikin Money Flow Indicator?
In the 1980s, Marc Chaikin introduced the Chaikin Money Flow indicator (CMF) as a technical indicator that measures money flow volume over a specific period. The CMF indicator can determine whether the market is under buying or selling pressure.
The indicator is based on the idea that when the closing price is close to the high, there is an accumulation, whereas when the closing price is close to the low, there is a distribution.
The CMF is frequently used to confirm a trend, measure the strength of a trend, or identify potential trend reversals or breakouts.
Calculation
1. Multiplier of money flow
The first step is to calculate the money flow multiplier for each period as follows:
Money Flow Multiplier = ((Close value – Low value) – (High value – Close value)) / (Close value – Low value) (High value – Low value)
2. The volume of money flow
The volume of money flow is then calculated by multiplying the volume for the period by the money flow multiplier obtained in step one. It is typically calculated daily, but it can also be calculated on an hourly or weekly basis.
Money Flow Volume = Money Flow Multiplier x Period Volume

3. CMF
The final step is to compute the CMF value. Simply divide the daily money flow over a given period by the sum of volume over the same period. CMF’s default period length is 21 days, representing the previous month’s trading. (Typically, each month has 21 or 22 trading days.) The following is the formula:
CMF = 21-day average of daily money flow divided by 21-day average of volume
How to read Chaikin Money Flow Indicator?
The Chaikin Money Flow indicator is an oscillator indicator available on most trading platforms and appears below the asset chart as a line that fluctuates around the zero line.
The default setting is for 20 periods, but you can change it based on your preferences and strategy. The CMF can take values ranging from +1 to -1, but it should be noted that it rarely reaches the extreme value.
Above the centre line or zero line is considered a bullish territory, while below the line is considered a bearish territory. As a result, when the CMF values are above zero, it indicates buying pressure. In contrast, when the indicator values are negative, it indicates selling pressure.
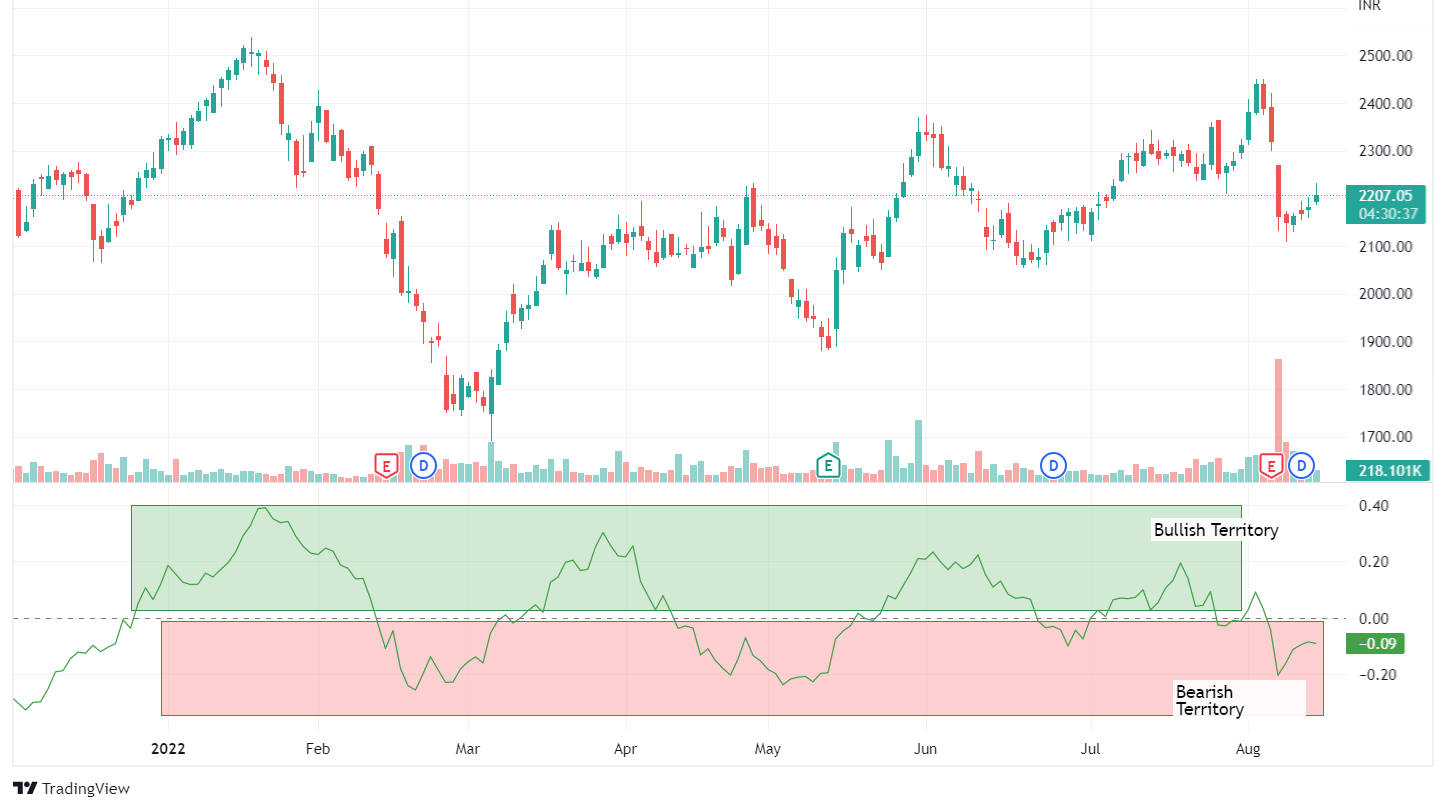
As you can see, when the CMF line is in the green rectangle, it indicates an upward trend, whereas a CMF line in the red rectangle indicates a downward trend. CMF values are typically in the +0.5 to -0.5 range, with only a few exceptions reaching +1 or -1. As a result, it is possible to state:
- When the CMF approaches +1, the buying pressure increases.
- When CMF approaches -1, the selling pressure increases.
Chaikin Money Flow Indicator Strategy
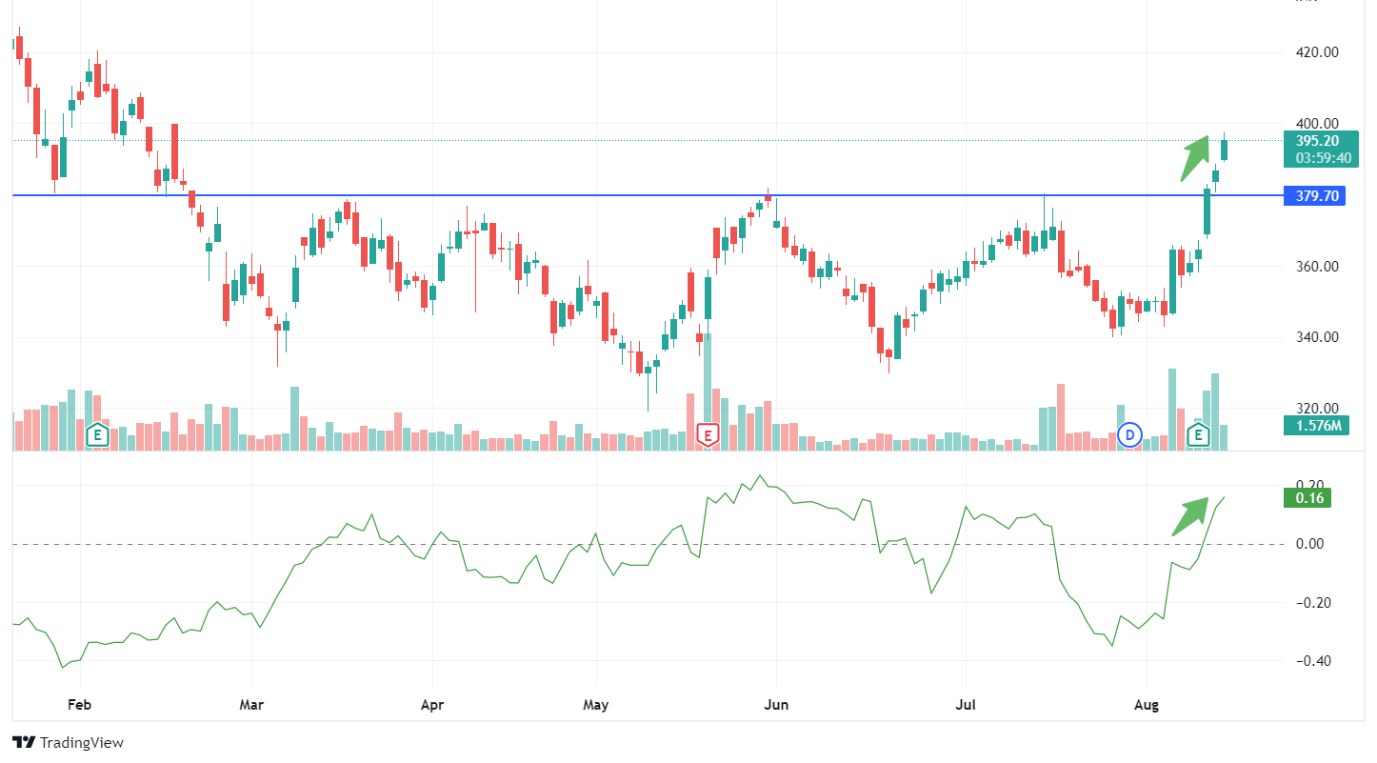
When Chaikin Money Flow confirms breakouts from support and resistance levels, it can be used in conjunction with these levels.
As a result, if the price breaks through the resistance level during an upward trend while the CMF shows higher highs, the trend will continue upward.
In a downward trend, however, when the price breaks below the support level while the CMF hits new lows, it confirms that the downward trend will continue.
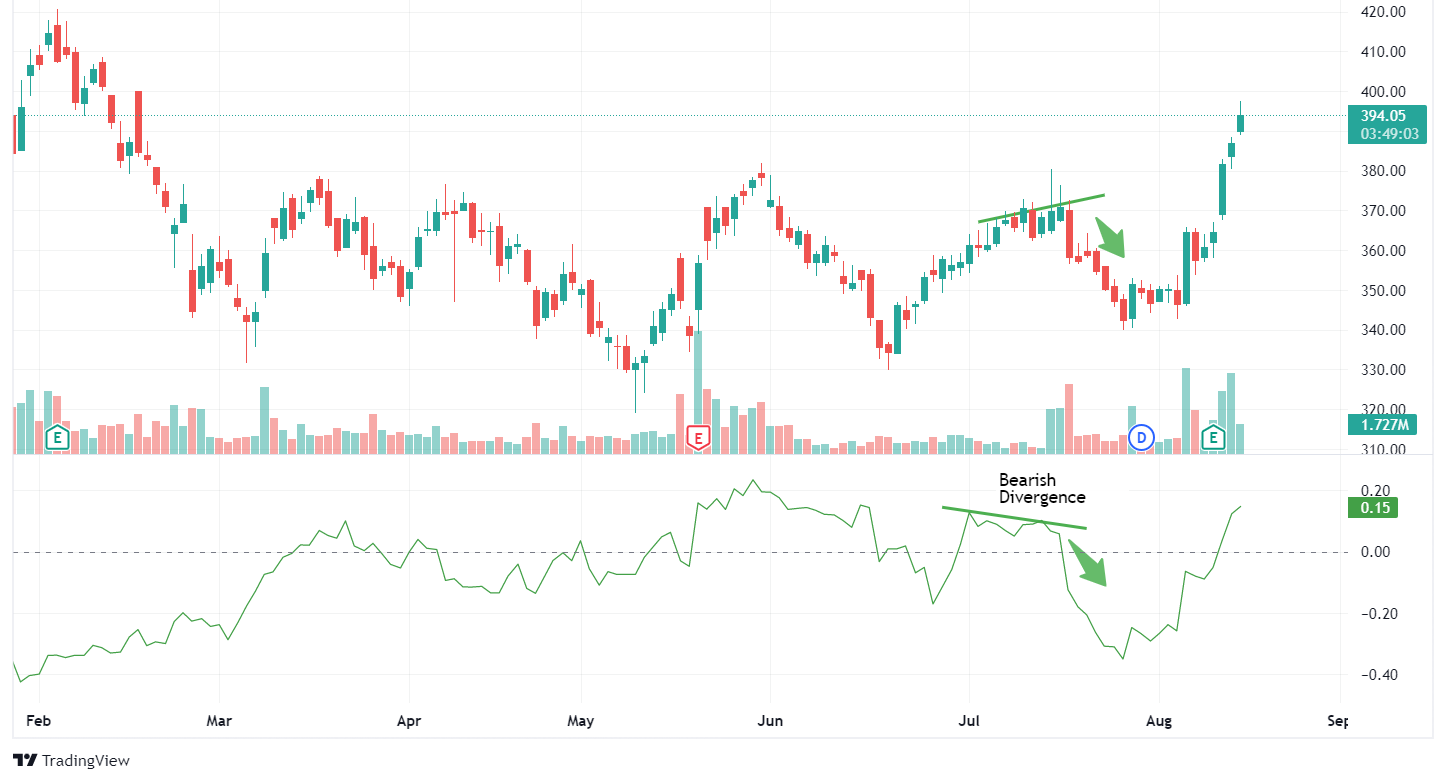
Divergences in price action and the CMF that move in opposite directions can indicate a potential trend reversal. Bullish divergence may appear when the price moves to a new low while the CMF does not follow, indicating the possibility of an upward trend.
A bearish divergence occurs when the price moves to a new high while the CMF remains unchanged or even falls, indicating the possible start of a downward trend.
Although volume traders widely use CMF, it is not particularly reliable as a stand-alone indicator. As a result, you should combine the indicator with other technical analysis indicators to confirm the identified signals and develop your Chaikin Money Flow strategy.
Chaikin Money Flow Indicator vs Money Flow Index
The money flow index differs from the Chaiken money flow oscillator in that it uses volume in conjunction with recent price movements to determine positive or negative momentum. Many traders regard this indicator as a volume-weight relative strength index (RSI), calculated by averaging price gains and losses over time (usually 14 days).

Because the Chaikin oscillator and money flow index is calculated using different elements, the trading signals are quite different. Before using any technical indicator to generate buy and sell signals, it is critical to understand its underlying formula.
You can also join our course on Certification In Online Technical Analysis
Bottomline
We can conclude that during trending markets, the Chaikin Money Flow formula is a useful indicator. It’s an excellent tool for confirming trend direction. When there is a chance of a trend reversal, the CMF can provide possible exit signals.
For Market Updates, Visit StockEdge
Frequently Asked Questions (FAQs)
1. What is the Chaikin Money Flow Indicator (CMF)?
Marc Chaikin created the Chaikin Money Flow (CMF), a technical analysis tool that quantifies the distribution and accumulation of money coming into or going out of a security over a given time frame. It calculates the strength of buying and selling pressure by combining volume and price data.
2. How does the CMF work?
Based on the link between the closing price and the trading range over a given period of time, usually 20 or 21 days, CMF computes the accumulation/distribution line. The indicator is weighted by volume, which highlights times when the price closes in the higher or lower half of the trading range with more volume.
3. What does the CMF indicate?
Positive CMF: Represents pressure to buy. A positive CMF indicates that the security is being amassed because the closing price is above the middle of the trading range and the volume is higher than usual.
Selling pressure is indicated by a negative CMF. Given that the closing price of the security is below the midpoint of the trading range and the volume is higher than typical, a negative CMF indicates that the security is being distributed.


