According to the basic theory of volume, as developed by Charles Dow, volume should rise in the direction of the trend which basically implies that during an uptrend, the volume must rise along with the rising price and in a downtrend the volume must rise when the price goes down.
This rising volume confirms the quality of the trend.
With the passage of time, as more and more research came into the subject, the theory of On Balance Volume (OBV) was developed.
What is On Balance Volume (OBV)?
According to this theory, the volume is correlated with the change in price.
On Balance Volume (OBV) actually measures buying and selling pressure on a cumulative basis which subtracts volume on down days and adds volume on up days.
On Balance Volume was developed by Joe Granville and it is one of the first indicators to measure positive and negative volume flow.
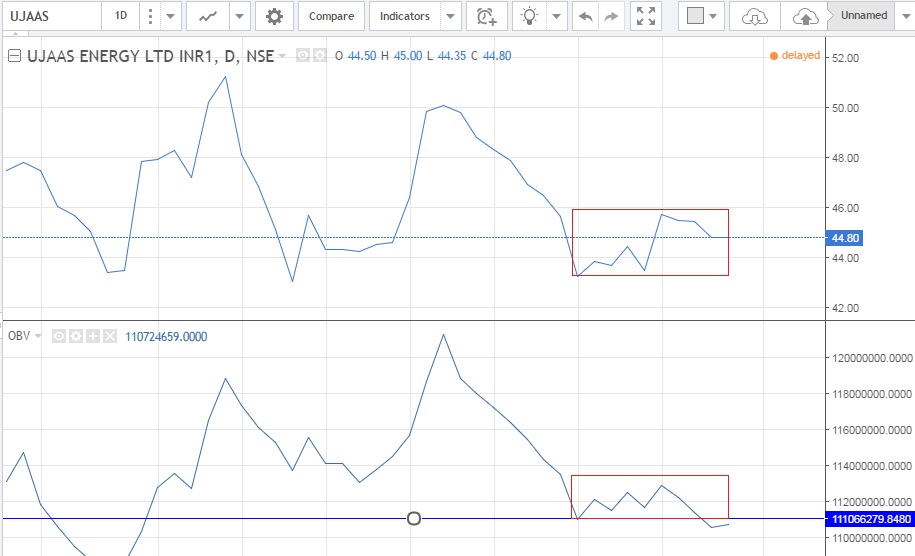
People often use OBV to confirm price trend and also look for divergence between price and OBV.
On Balance Volume (OBV) Calculation
If today’s closing price is higher than yesterday’s closing price, then yesterday’s volume should be added to today’s volume and the total volume should be called On Balance Volume (OBV) for today.

If today’s closing price is lower than yesterday’s, then yesterday’s volume should be subtracted from today’s volume and the net total would be called as today’s OBV.
However, if today’s close is equal to yesterday’s close, then yesterday’s volume should not be touched and whatever OBV we had yesterday, it would remain unchanged for today.
We are not concerned with the absolute figure of daily On Balance Volume, rather what we are concerned about is overall direction of the OBV line.
The OBV line is simply a running total of positive and negative volume.
Trading Rules With OBV Indicator
During an uptrend, on-Balance Volume will follow the price direction and continue making a higher top and higher bottom.
Hence, both charts, i.e., the price chart and the OBV chart, will almost look identical.
As long as both charts move in the same fashion, the trend is said to be perfectly up, i.e., volume supports the rise in price.
On the other hand, during a downtrend, OBV should make a lower top and lower bottom in the same style as the price. This confirms that volume is supporting the downtrend and that it is perfectly intact.
A time will come when Price and OBV will fail to respond to each other. It may take place in any of the following forms-
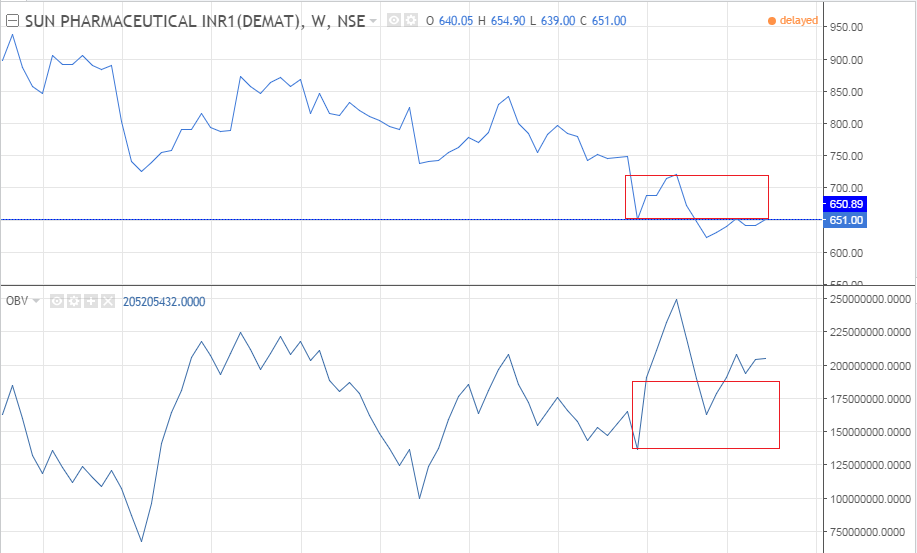
1. Non-confirmation of uptrend
Here, the price will make a new higher top, but On Balance Volume will fail to make a new higher top. This is the first sign of trouble in an uptrend.
It shows that although the price is rising and making a higher top volume fails to maintain that.
It indicates that the rise in price is not supported by the rise in volume.
This is called a non-confirmation and such type of non-confirmation do and can occur at the end of an uptrend.
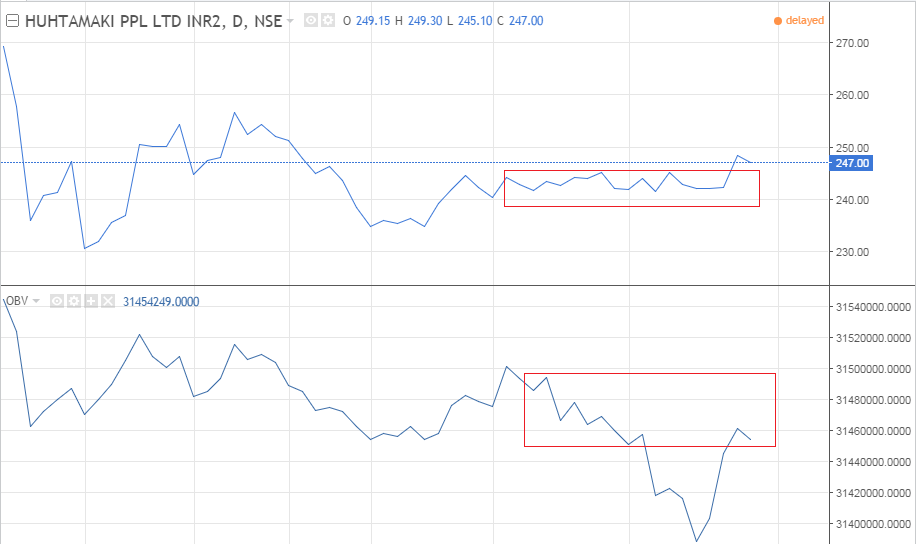
2. Non-confirmation of downtrend
During a downtrend, price and volume are expected to go down in the same fashion, i.e., lower top and lower bottom.
At times, we will find that volume and price are not moving in tandem, i.e., price has broken the bottom, but volume has not.
It shows that the price has broken with the lesser volume.
This is the point of trouble for the downtrend because the volume is no longer supporting the price fall. This is called non-confirmation. This type of confirmation occurs at the end of a bear market.
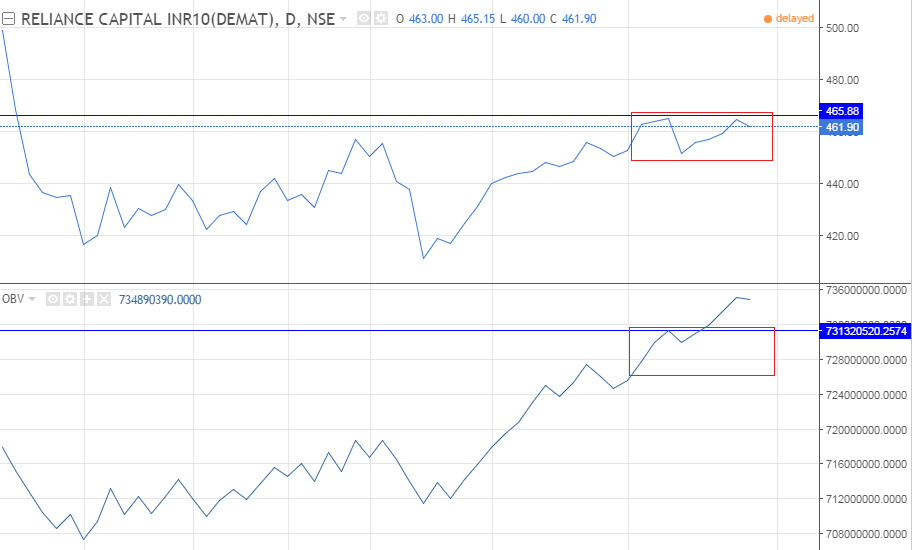
3. Advanced breakout
Another important and interesting factor of On Balance Volume is an advanced breakout.
As price and volume keep on rising together, there seems to be no problem. However, a time will come when we will see that the price could not breach the previous top, but the OBV line has breached the previous top. This is called an advanced breakout.
It shows that although the price has gone up marginally, volume generation is so high that OBV has made an advanced breakout.
This signal tells us that the price will also cross the previous top. In fact, a non-confirmation is a sign of weakness, whereas an advanced breakout is a sign of strength.
4. Advanced breakdown
In a downtrend, Price and on-Balance Volume are expected to move in the same fashion, making lower tops and lower bottoms.
However, at times, the price fails to break the previous bottom, whereas On Balance, Volume breaks the previous bottom. This is called an advanced breakdown.
An advanced breakdown indicates that the price will also break the bottom.
This is a matter of weakness on the part of the price.
Conclusion
When OBV and price both follow the same direction, regardless of the trend, we can draw a trend line in price as well as in volume to watch pattern similarities. Moreover, OBV should always be used in the daily chart in correlation with the closing chart. To make better trades, you may combine it other indicators like Stochastic for better confirmation. You may confirm the advanced breakout with the positive divergence of the Stochastic to place your trade for the upside. On the other hand, you may combine negative divergence with the non-confirmation to bet on the downside price movement.
For Technical Scans, Visit StockEdge
Frequently Asked Questions (FAQs)
1. What is OBV?
Technical analysis indicator OBV adds volume on up days and subtracts volume on down days to determine buying and selling pressure.
2. How does OBV work?
When a price closes higher than it did the day before, the volume is added; when it closes lower, the volume is subtracted. This is how OBV is computed. The OBV line is formed by the cumulative total.


Well articulated. Interesting Info.
Thank You…
Hi,
Thank you for Reading!
Keep Reading
Wow, amazing weblog layout! How long have you been blogging for? you make blogging glance easy. The total glance of your website is magnificent, let alone the content!