- What is the Supertrend Indicator?
- Why is Supertrend Important?
- How to Use the Supertrend Indicator?
- Best Supertrend Indicator Settings
- Supertrend Indicator Formula
- How to Identify Buy and Sell Signal Using Supertrend Indicators?
- Intraday Trading Strategies using Supertrend
- Swing Trading and Long Term Strategies With Supertrend
- Trading Strategy Using Supertrend and Moving Average Crossover
- Best Timeframe to Use in Supertrend Indicator
- Pros and Cons of Supertrend Indicator
- Bottomline
- Frequently Asked Questions
A very common problem with intraday traders is which indicators work well for the intraday trades. Being an intraday trader, chances are that you use technical analysis to identify trades based on different parameters.
However, the first indicator which comes to our mind for intraday trading is the Supertrend indicator due to its simplicity. It can give you precise buy or sell signals in a trending market along with the best super trend strategy for intraday.
What is the Supertrend Indicator?
A Super Trend is a trend following indicator similar to moving averages. It is plotted on price and the current trend can simply be determined by its placement vis-a-vis price. It is a very simple indicator and is constructed with the help of just two parameters- period and multiplier.
When we construct the Supertrend indicator strategy, the default parameters are 10 for the Average True Range (ATR) and 3 for its multiplier. The average true range (ATR) plays a key role in ‘Supertrend’ as the indicator uses ATR to compute its value and it signals the degree of price volatility.
Why is Supertrend Important?
Determining the direction of the dominant trend in the market is the main function of the Supertrend indicator. It establishes whether a trend is bullish or bearish by combining price activity and volatility. This aids traders in following the direction of the prevailing market, which is a key element of profitable trend trading.
How to Use the Supertrend Indicator?
To use this indicator, you need to open the chart of a particular stock that you want to track and set a time interval of 10 minutes when doing intraday trading.
You can use any good charting software. After opening the chart, insert supertrend and keep the settings as 10 and 3.
You can also insert your own settings as well. However, while you using this indicator, you should not avoid putting your stop loss.
For a long position, you can put stop loss right at the green indicator line. For a short position, you can put it at the red indicator line. Using a supertrend along with a stop-loss pattern is the best way to earn the best wealth in trading.
Best Supertrend Indicator Settings
The default parameter is a period of 10 and 3.
You should note that any changes to these numbers can affect the use of the Supertrend indicator.
There is no best setting for any trading indicator. As well, the more settings you change can lead to a trading system that is over-optimized for that point in time.
You should note the following points;
- Smaller settings can make the indicator more reactive to the price, which means more signals
- Higher settings will remove the noise from the market at the risk of fewer trading signals
Supertrend Indicator Formula
The supertrend indicator calculation is shown below –
Up = (high + low / 2 + multiplier x ATR
Down = (high + low) / 2 – multiplier x ATR
Calculation of Average True Range –
[(Prior ATR x 13) + Current TR] / 14
Here, 14 indicates a period. Hence, the ATR is derived by multiplying the previous ATR with 13. Add the latest TR and divide it by period.
Thus, ATR plays an important role in the supertrend technical analysis indicator.
How to Identify Buy and Sell Signal Using Supertrend Indicators?
Super Trend being a trending indicator works beautifully in trending markets (both uptrends and downtrends). The buy-sell signal can easily be identified when the indicator flips over the closing price. A buy signal is generated when the Super Trend closes below the price and the color changes to green. On the other hand, a sell signal is made when the Super Trend closes above the price and the color of Super Trend turns red.
There’s no technical indicator which can be 100% accurate and so is Super Trend also. It also generates false signals in the sideways market, though it gives lesser false signals as compared to other indicators. So you can combine supertrend with other indicators to get better trading signals.
Intraday Trading Strategies using Supertrend
During a single trading day, intraday trading methods that employ the Supertrend indicator can be useful for spotting trend-based opportunities and catching brief price swings. Here are four Supertrend-based intraday trading techniques:
Trading Strategy 1: Supertrend Breakout
Trade on Supertrend breakthrough indications to take advantage of big market momentum developments.
Steps to Follow
Configuration: Utilize the Supertrend indicator on a 5-minute or 15-minute intraday chart. Determine the Supertrend’s direction (bearish or bullish) based on the signal from the indicator.
Entry Requirement: When the Supertrend reverses course, look for a breakthrough above (for long trades) or below (for short trades) the previous high/low.
Verify the breakout using momentum indicators (e.g., RSI, MACD) and higher volume.
Exit Requirements:
- Aim for a price based on significant resistance/support levels or recent price fluctuations.
- If the trend turns back, use a trailing stop-loss or the opposite Supertrend signal to exit the trade.
Trading Strategy 2: Supertrend Pullback
When there are brief retracements within the general trend direction, enter trades at advantageous price points.
Steps to Follow
Setup: Use the Supertrend indicator to determine the direction of the current trend. Await price pullbacks or retracements that go counter to the trend.
Trading Criteria: Whenever the price retracement hits a significant level of support (for long trades) or resistance (for short trades) that is in line with the Supertrend direction, it is time to enter the trade.
For confirmation of the trend’s possible continuation or reversal, use candlestick patterns or other technical indicators.
Exit Requirements:
- Decide on your profit goals based on the opposing Supertrend signal or levels of nearby resistance and support.
- To reduce losses and preserve profits, use a trailing stop-loss.
Trading Strategy 3: Supertrend Range Breakout
Trade breakouts with the Supertrend indicator from range-bound market circumstances.
Steps to Follow
Setup: Using the Supertrend indicator, pinpoint times of consolidation or sideways movement. Await a breakout that occurs above or below the range limits.
Entry Requirement: Trade when the price breaks out of the range and the Supertrend confirms it (a shift in direction). Use momentum indicators and higher volume to confirm the breakout.
Exit Criteria: Determine profit targets by looking at recent price fluctuations or the breadth of the range. If the breakout holds, use a trailing stop-loss to profit from further gains.
Trading Strategy 4: Supertrend Reversal
Use the Supertrend indicator to spot possible trend reversals and seize countertrend trades.
Steps to Follow
Setup: Keep an eye out for indications of fatigue or deviation from the main trend in the Supertrend. Search for candlestick patterns or chart formations that might indicate a reversal.

Requirements for Entry: When the Supertrend swings in the opposite direction of the dominant trend that is, from bullish to bearish or vice versa-you should enter a trade. Use additional technical indicators or price action patterns to validate the reversal signal.
Exit Requirements: Decide on your profit goals based on the opposing Supertrend signal or levels of close support and resistance. To control risk in the event that the reversal is brief, use a tight stop-loss.
Swing Trading and Long Term Strategies With Supertrend
For capturing long-term trends and optimizing earnings over time, swing trading and long-term methods utilizing the Supertrend indicator can be useful. Using the Supertrend indicator, the following four techniques are designed for long-term investing and swing trading:
Trading Strategy 1: Supertrend Trend Following
As your main trend-following tool, use the Supertrend indicator to identify and capture medium- to long-term patterns.
Steps to Follow
Configuration: Utilizing a medium- to long-term chart (daily or weekly, for example), apply the Supertrend indicator. To ascertain the main trend, identify the Supertrend’s direction (bearish or bullish).
Requirements for Entry: When price retraces to a good level within the prevailing trend (e.g., near the Supertrend line), enter trades in the direction of the Supertrend. To corroborate the trend direction, look for additional confirmation from other technical indicators (such as moving averages and RSI).
Exit Requirements: When the trend begins to show indications of fatigue or reversal, use the opposing Supertrend signal or a trailing stop-loss to exit trades. Hold onto your positions until there is a definite evidence of a trend reversal or a noteworthy development.
Trading Strategy 2: Supertrend Breakout for Swing Trading
Use the Supertrend indicator to spot breakouts and profit from swing trading chances.
Steps to Follow
Setup: Keep an eye on the Supertrend indicator on a medium-term chart (such as a daily or 4-hour chart). Await a consolidation of the price inside a specific range or pattern.
Requirements for Entry: Trade entry is indicated by a shift in the direction of the Supertrend when the price breaks out above or below the consolidation range. To verify the breakout, use momentum indicators and volume analysis.
Exit Requirements: Profit targets can be established using technical levels (e.g., Fibonacci retracement levels, prior swing highs/lows) or the predicted range of the breakout. Use a trailing stop-loss to safeguard profits and profit from future trend extensions.
Trading Strategy Using Supertrend and Moving Average Crossover
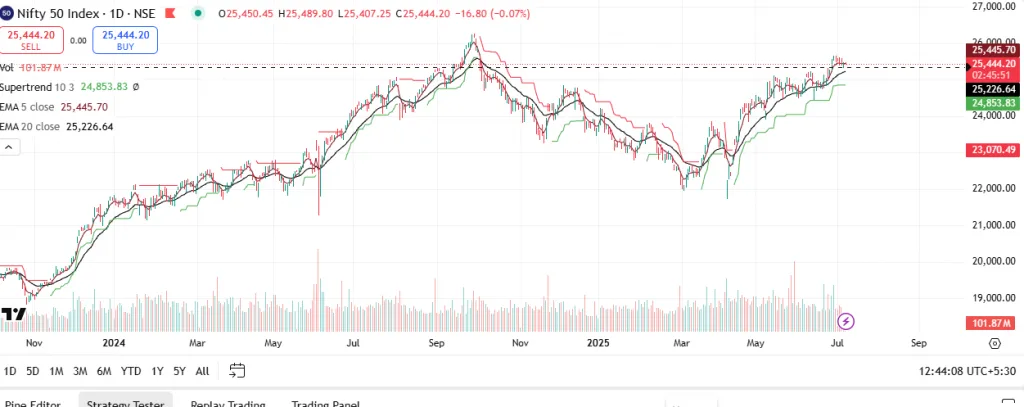
This is the best EMA crossover for intraday. This strategy basically comprises of Super Trend and 5-20 EMA crossover. When the Super Trend turns green (i.e. Super Trend is below the price) and 5 EMA is above 20 EMA, a buy signal is generated. Similarly, when the Super Trend turns red (i.e. Super Trend is above the price) and 20 EMA is above 5 EMA, a sell signal is generated.
Below is the chart of Nifty. As you can see in the chart that you can really catch big moves based on this strategy and keep trailing stop loss with the help of Super Trend to protect your profits.
Best Timeframe to Use in Supertrend Indicator
As for swing traders and position holders, they can use longer timeframes.
This indicator can also be used on multiple timeframes where you place it on a larger timeframe then go down to a lower timeframe and use it for entry and exit signals.
The lowest timeframe you should use is the 15-minute chart.
Pros and Cons of Supertrend Indicator
Supertrend gives accurate signals on precise time. Also, the indicator is available on various trading platforms free of cost.
The indicator helps the intraday traders to make faster decisions. It is simple to use and understand. However, the indicator is not appropriate for all the market phases, It works best when the market is trending.
You can watch the video below to get a better idea of the concept and use of Supertrend indicator: A Super Trend indicator can be used on equities, forex, or futures on various time frames including hourly, daily, weekly, etc.
However, Super Trend needs to be used in conjunction with other indicators like RSI, Parabolic SAR, MACD, etc to receive filtered signals.
Moreover, Supertrend also works as a trailing stop-loss for the existing trades and acts as strong support or resistance.
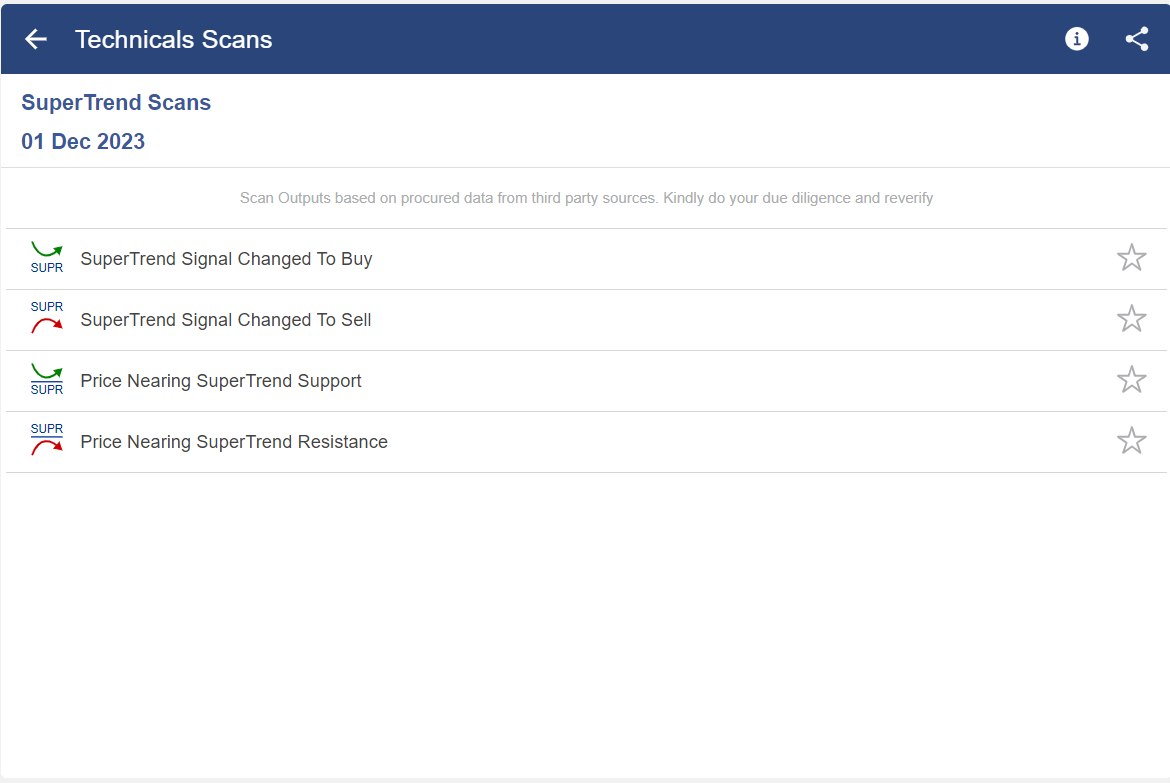
You can also use Supertrend Scans in StockEdge–
Watch the video to learn more about this indicator:
Learn Supertrend Indicator for successful intraday trading. Enroll now to learn trading online course and elevate your trading skills!
Bottomline
A Super Trend is a trend following indicator similar to moving averages. This indicator can also be used on multiple timeframes, where you place it on a larger timeframe, then go down to a lower timeframe and use it for entry and exit signals. Supertrend gives accurate signals at the precise time. Also, the indicator is available on various trading platforms free of cost.
Frequently Asked Questions
1. How accurate is the Supertrend strategy?
There’s no technical indicator which can be 100% accurate and so is Super Trend also. It also generates false signals in the sideways market, though it gives lesser false signals as compared to other indicators
2. How is SuperTrend indicator calculated?
The supertrend indicator calculation is shown below–
Up = (high + low / 2 + multiplier x ATR
Down = (high + low) / 2 – multiplier x ATR
Calculation of Average True Range – [(Prior ATR x 13) + Current TR] / 14
Here, 14 indicates a period. Hence, the ATR is derived by multiplying the previous ATR with 13. Add the latest TR and divide it by period. Thus, ATR plays an important role in the supertrend technical analysis indicator.
3. How can I use Supertrend indicator for intraday trading?
For using this indicator, you need to open the chart of a particular stock that you want to track and set a time interval of 10 minutes when doing intraday trading. You can use any good charting software. After opening the chart insert supertrend and keep the settings as 10 and 3.
4. What timeframe and setting is best for supertrend indicator for day trading?
The default parameter is a period of 10 and 3.
5. In the stock market Supertrend indicator 7,3 is equal to the moving average?
No it is not equal. 7 denotes the ATR value of last 7 candlesticks and 3 is the multiplier
6. How Supertrend Indicator Works?
The Supertrend indicator works by using the average true range (ATR) and price to draw a trend line on the chart. When the price moves above this line, it shows an uptrend and gives a buy signal. When the price goes below the line, it shows a downtrend and gives a sell signal. It helps you find the direction of the market and possible entry or exit points.
7. Where to Find Supertrend Indicator?
You can find the Supertrend indicator on most stock market platforms like StockEdge, TradingView, Zerodha Kite, and Angel One. You will find it in the indicator list within the charting section of these apps or websites.


If I’m doing options trading on indices, is it a good idea to use supertrend on the options chart?
Hi,
Supertrend can be used in the options chart as well.
Thank you for Reading our blog.
All blogs are very nice and helpful but for common man can’t understand English language. So I request please if translations in hindi are available is better ..
Thanks.
Hi,
We really appreciated that you liked our blog! Thank you for your feedback!
Keep Reading!
most important and useful tool.Happpy to read this article.