Elearnmarkets - Financial Market Learning
  • Courses
  • Webinars
  • Stories
  • Language
    • English
    • Hindi
    • Bengali
No Result
View All Result
Get Free Course
  • Basic Finance
  • Derivatives
    • Futures
    • Options
  • Financial Planning
  • Fundamental Analysis
  • Technical Analysis
  • Mutual Funds
  • Marketshala
  • Miscellaneous
Elearnmarkets - Learn Stock Market, trading, investing for Free
  • Courses
  • Webinars
  • Stories
  • Language
    • English
    • Hindi
    • Bengali
No Result
View All Result
Get Free Course
Elearnmarkets - Learn Stock Market, trading, investing for Free
No Result
View All Result
Home Technical Analysis
Parabolic SAR - Calculation, Indicators & Use 1

Parabolic SAR – Calculation, Indicators & Use

Vivek Bajaj by Vivek Bajaj
May 25, 2024
in Technical Analysis, Charts, Patterns & Indicators
Reading Time: 8 mins read
2
16.1k
VIEWS
Share on FacebookShare on XShare on WhatsApp

J. Welled Wilder developed the parabolic SAR, also known as the Parabolic Stop and Reverse. This trend-following indicator displays dots underneath the price bars in an uptrend and above them in a downtrend.

This indicator uses the recent extreme price (EP) with an acceleration factor (AF) to determine where the indicator dots will appear. In the consolidating markets, the PSAR tends to whipsaw back and forth and thus generate false trading signals

Traders can use other indicators, like the average directional index momentum indicator, to confirm the strength of the existing trend. Parabolic SAR, also known as the Parabolic Stop and Reverse, was developed by J. Welled Wilder.

This is a trend-following indicator that is displayed as dots underneath the price bars in an uptrend and above them in a downtrend.

Table of Contents

  • What is Parabolic SAR?
  • Calculation of Parabolic SAR
  • How to use this Indicator?
  • Indicators that complement PSAR
  • Pros and Cons of Parabolic SAR
  • How to use Parabolic SAR Scans in StockEdge
  • Bottomline
  • Frequently Asked Questions (FAQs)
    • What is PSAR?
    • How does PSAR work?
    • What do the PSAR dots represent?

Let us discuss the basics of this indicator and then how to use this indicator in our trading:

What is Parabolic SAR?

It is a trend-following indicator that is popularly used by traders to set trailing stop losses. The Parabolic SAR has three main functions. Firstly, it highlights the current trend or price direction.

Secondly, it provides potential entry signals, and lastly, it provides potential exit signals. Dots that form below the price and are rising in an upwardly sloping pattern signal an uptrend.

Meanwhile, the dots that form above the price and fall in a downwardly sloping pattern signal a downtrend.

Calculation of Parabolic SAR

The Parabolic SAR (PSAR) indicator uses the recent extreme price (EP) with an acceleration factor (AF) to determine where the indicator dots will appear.

It is calculated as follows:

  • Uptrend: PSAR = Prior PSAR + Prior AF (Prior EP – Prior PSAR)
  • Downtrend: PSAR = Prior PSAR – Prior AF (Prior PSAR – Prior EP), Where:
  • EP = Highest high for an uptrend and lowest low for a downtrend, updated each time a new EP is reached.
  • AF = Default of 0.02, increasing by 0.02 each time a new EP is reached, with a maximum of 0.20.

This calculation creates a dot that can be connected with a line, below the rising price or above the falling price.

The dots are always present; this is why this indicator is also known as “stop and reverse.”

How to use this Indicator?

The Parabolic SAR performs well in the trending markets. In the consolidating markets, the parabolic SAR tends to whipsaw back and forth and thus generate false trading signals

The main use of this indicator is to buy when the dots move below the price bars, which signals an uptrend. And sell when the dots move above the price bars signaling a downtrend.

Example:

parabolic sar reliance-chart

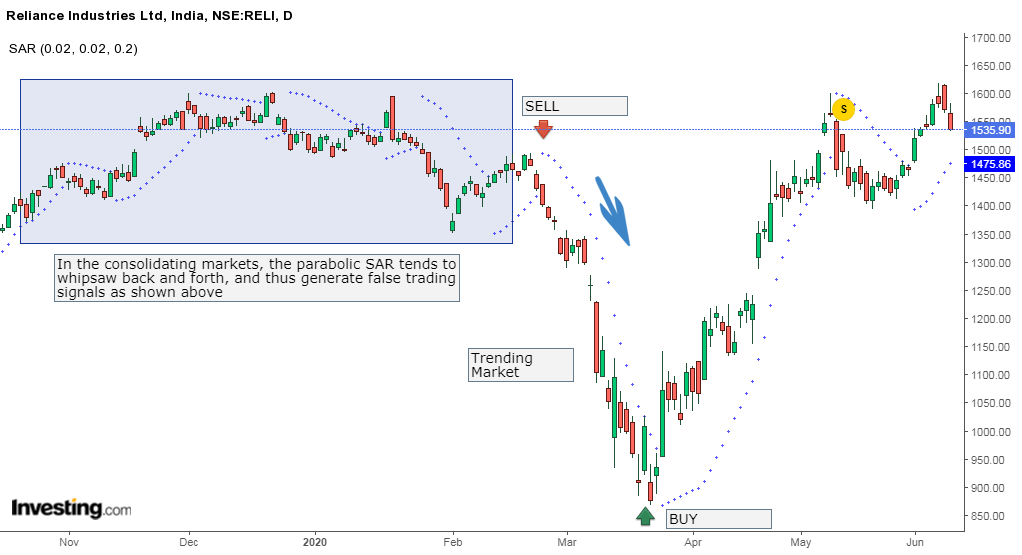
From the Daily chart of Reliance Industries Ltd. below, we can see how, in the consolidating market, the parabolic SAR tends to whipsaw back and forth and thus generate false trading signals.

Meanwhile, in trending markets, it gives a clear signal of buy and sell.

One should shorten the stock when the dots turn above the price, which signals that the trend is going to reverse in the downtrend, as shown above.

One should buy it when the dots turn below the prices, indicating the trend is going to reverse in the uptrend.

Indicators that complement PSAR

Traders can use other indicators, like the average directional index momentum indicator, to confirm the strength of the existing trend.

Other indicators complementing the SAR trading signals include moving averages and candlestick patterns.

Pros and Cons of Parabolic SAR

The main benefit of this indicator is that, during a strong trend, the indicator highlights that the trader should keep holding his position.

The indicator also gives an exit when there is a move against the trend, which signals a reversal.

Traders can also generate powerful trading signals using Parabolic SAR and RSI.

The main drawback of this indicator is that it doesn’t provide good trade signals during sideways market conditions.

Without a clear trend, the indicator constantly flip-flops above and below the price.

How to use Parabolic SAR Scans in StockEdge

You can also use the Parabolic SAR Scans in the StockEdge web version as shown below:

Steps to use Parabolic SAR scans in StockEdge:

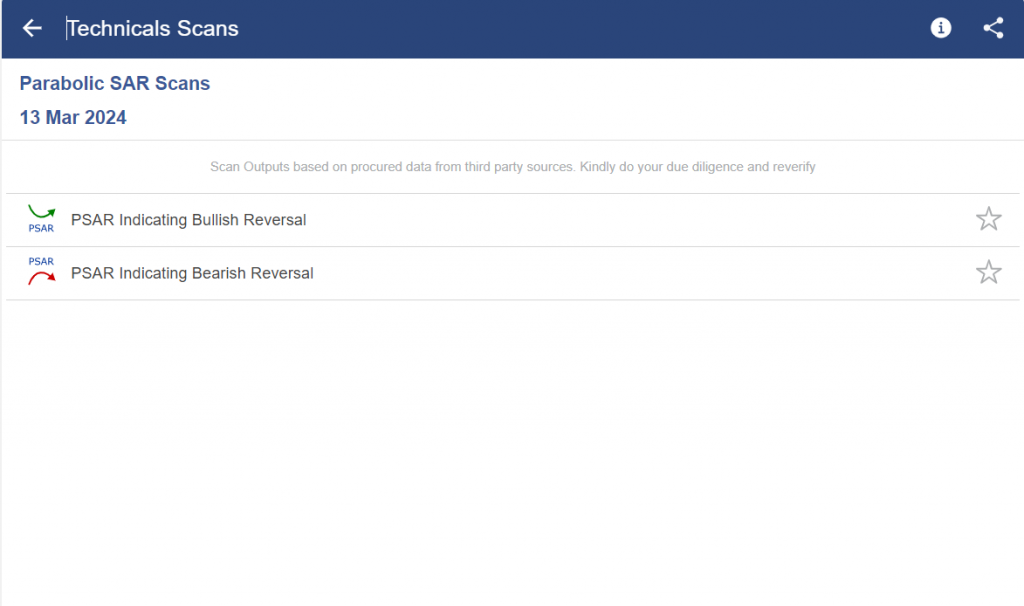
  • Under the “Technical scans”, you can select “Parabolic SAR” scans as shown below:
  • There are 2 scans in this section as shown below. You can select any of them depending on your trading strategy. You can select PSAR Indicating Bullish reversal scan if you want a list of stocks having a bullish reversal.
Parabolic SAR - Calculation, Indicators & Use 2
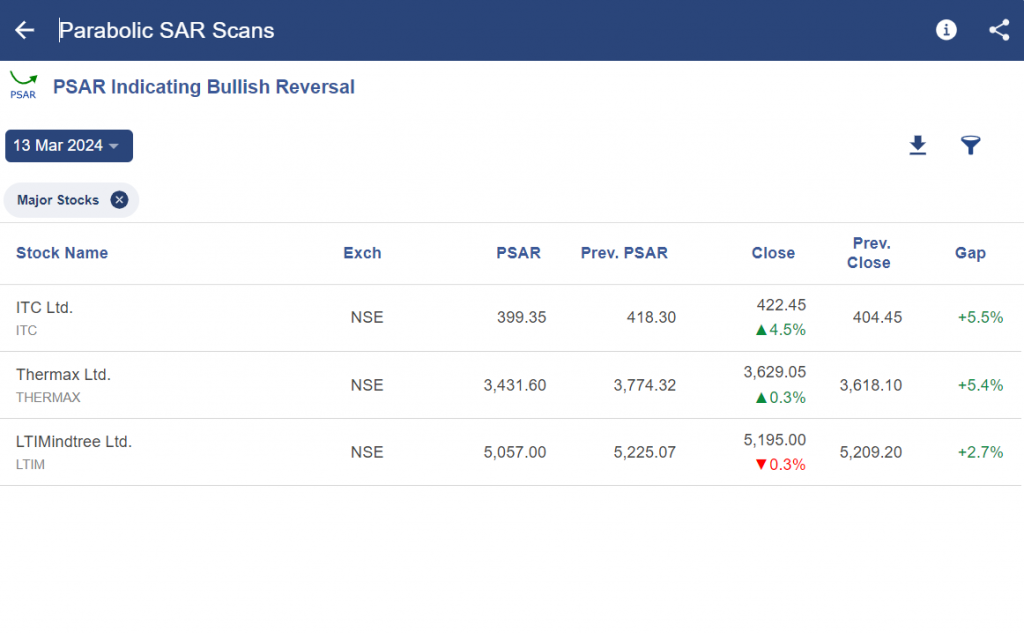
  • After choosing the scan, you will get a list of stocks with the details as shown below:
Parabolic SAR - Calculation, Indicators & Use 3

Bottomline

Potential trend reversals and entry/exit points can be found with the use of the PSAR indicator. It displays a sliding stop-loss that moves with the price in an effort to restrict the downside while capturing profits. Nevertheless, PSAR needs validation using additional technical analysis techniques and can produce whipsaws, or false signals.

Frequently Asked Questions (FAQs)

What is PSAR?

Parabolic Stop and Reverse is referred to as PSAR. Traders utilize this technical indicator to pinpoint probable turning points in the direction of an asset’s price movement.

How does PSAR work?

On a chart, PSAR positions dots above or below the price. The dots show an upward trend if they are below the price and a negative trend if they are above. The dots’ reversal indicates a possible reversal.

What do the PSAR dots represent?

The dots show possible levels of stop-loss or potential reversal points in the trend. The dots are computed using the acceleration factor, which rises with time and brings the price in a trending market closer.

Tags: englishIndicatorintermediateParabolic SARtechnical indicators
ShareTweetSend
Get Kotak Offer Get Kotak Offer Get Kotak Offer
Previous Post

Time-Saving Investment Strategies for Working Professionals

Next Post

On Balance Volume (OBV)

Vivek Bajaj

Vivek Bajaj

Mr. Vivek Bajaj has over 18 years of trading experience in equities, options, currencies, and commodity markets. He is the co-founder of Stockedge and Elearnmarkets and is passionate about data, analytics, and technology. He serves on various exchange committees and has played a significant role in the evolution of India's derivative market. He has been a speaker at various colleges and higher institutions, including IIT and IIMs.

Related Posts

Understand Slippage in Trading
Technical Analysis

What is Slippage in Trading? Meaning & Examples

March 28, 2025
302
Breakout trading strategies
Technical Analysis

Top 5 Breakout Trading Strategies

March 12, 2025
1.1k
5 stocks for today
Technical Analysis

5 Stocks to Buy Today That Could Beat the NIFTY in 2025!

May 5, 2025
400
Image describing What is marginal trading facility
Technical Analysis

 What is a Margin Trading Facility? Advantages & Risks

April 4, 2025
662

Comments 2

  1. riya says:
    5 years ago

    nice

    Reply
    • Sakshi Agarwal says:
      5 years ago

      Hi,

      Thank you for Reading!

      Keep Reading!

      Reply

Leave a Reply Cancel reply

Your email address will not be published. Required fields are marked *

Disclaimer

Elearnmarkets (Kredent InfoEdge Pvt. Ltd.) is a SEBI-registered Research Analyst (RA) entity (SEBI Registration No.: INH300007493). The information provided in this article is for educational and informational purposes only and should not be considered as an offer to buy or sell any securities or investment products.

The stocks, securities, and investment instruments mentioned herein are not recommendations under SEBI (Research Analysts) Regulations, 2014. Readers are advised to conduct their own due diligence and seek independent financial advice before making any investment decisions.

Investments in securities markets are subject to market risks. Please read all related documents carefully before investing. Investing in Equity Shares,
Derivatives, Mutual Funds, or other instruments carry inherent risks, including potential loss of capital. Elearnmarkets (Kredent InfoEdge Pvt. Ltd.) does not provide any guarantee or assurance of returns on any investments. Past performance is not indicative of future performance.

Elearnmarkets Logo

Follow Us

Facebook-f X-twitter Instagram Linkedin-in Youtube Telegram

Register on Elearnmarkets

Continue your financial learning by creating your own account on Elearnmarkets.com

Register Free Account

Download App

Playstore logo
Download on app store

Categories

  • Basic Finance
  • Derivatives
  • Financial Planning
  • Fundamental Analysis
  • Technical Analysis
  • Mutual Funds
  • Miscellaneous

Popular On Elearnmarkets

  • Market Superheroes:
  • Vivek Bajaj
  • Chetan Panchamia
  • Ashish Kyal
  • Premal Parekh
  • Abhijit Paul
  • Jegan
  • Sivakumar Jayachadran
  • Jyoti Budhia
  • Vivek Gadodia
  • Vishal Mehta
  • Piyush Chaudhry
  • Santosh Pasi
  • Gomathi Shankar
  • Market Superheroes:
  • Vivek Bajaj
  • Chetan Panchamia
  • Ashish Kyal
  • Premal Parekh
  • Abhijit Paul
  • Jegan
  • Sivakumar Jayachadran
  • Jyoti Budhia
  • Vivek Gadodia
  • Vishal Mehta
  • Piyush Chaudhry
  • Santosh Pasi
  • Gomathi Shankar
  • Courses:​
  • Options Trading
  • Dow Theory
  • Momentum Trading
  • Stock Investing
  • Harmonic Chart Patterns
  • Algo Trading
  • Elliot Wave Theory
  • Advanced Excel
  • Cryptocurrency
  • NSE Certification Course
  • Courses:​
  • Options Trading
  • Dow Theory
  • Momentum Trading
  • Stock Investing
  • Harmonic Chart Patterns
  • Algo Trading
  • Elliot Wave Theory
  • Advanced Excel
  • Cryptocurrency
  • NSE Certification Course
  • Webinars:
  • Bank Nifty Scalping
  • Intraday Trading Strategies
  • Options Trading Strategies
  • Options selling
  • Price Action
  • Relative Strength
  • Tax Planning
  • Options Buying
  • Growth Stocks
  • Portfolio Management
  • Risk Management
  • Renko Charts
  • Crude Oil
  • Traders Psychology
  • Moving Average
  • Multibagger Stocks
  • Free Learning Modules:
  • Intraday Trading
  • Options Scalping
  • Swing Trading
  • Financial Modelling
  • RSI Indicator
  • Bollinger Bands
  • Pricing of Futures
  • Personal Finance
  • Initial Public Offerings (IPO)
  • Value Investing
  • Technical Indicators
  • Candlesticks
  • Chart Patterns
  • Option Greeks
  • ELSS Funds
  • Banking and Insurance
  • Real Estate
  • Gold
  • Book Summaries:
  • Rich Dad Poor Dad
  • Psychology of Money
  • The Intelligent Investor
  • The Richest Man in Babylon
  • Think and Trade Like a Champion
  • Value Investing and Behavioural Finance
  • Trading in the Zone
  • Learn to Earn
  • Book Summaries:
  • Rich Dad Poor Dad
  • Psychology of Money
  • The Intelligent Investor
  • The Richest Man in Babylon
  • Think and Trade Like a Champion
  • Value Investing and Behavioural Finance
  • Trading in the Zone
  • Learn to Earn
  • Tools:
  • CAGR Calculator
  • SIP Calculator
  • eLearnOptions
  • Future Value Calculator
  • Present Value Calculator
  • Atal Pension Yojana
  • Cost of Delay Calculator
  • Become a Crorepati
  • Tools:
  • CAGR Calculator
  • SIP Calculator
  • eLearnOptions
  • Future Value Calculator
  • Present Value Calculator
  • Atal Pension Yojana
  • Cost of Delay Calculator
  • Become a Crorepati

© 2025 Elearnmarkets. All Rights Reserved

  • Visit Elearnmarkets
  • Courses
  • Webinars
  • Financial Guides
  • Get Free Counselling
  • Visit Elearnmarkets
  • Courses
  • Webinars
  • Financial Guides
  • Get Free Counselling

Download Our App

No Result
View All Result
  • Article Categories
    • Basic Finance
    • Derivatives
    • Financial Planning
    • Fundamental Analysis
    • Technical Analysis
    • ETFs & Mutual Funds
    • Marketshala
    • Miscellaneous
  • Language
    • Hindi
    • Bengali
    • English
  • Courses
  • Webinars
  • Stories
Get Free Course

© 2024 Elearnmarkets All Rights Reserved

A Handbook of Technical Analysis
To start your trading journey as a seasoned technical analyst
Download Guide For FREE
Guidebook On Chart Patterns
Take Your Trading To The Next Level With Strategies Shared In This Ebook
Download Guide For FREE
Trading Mentorship Program