
Key Takeaways
- Average True Range (ATR) helps gauge market volatility and identify periods of price contraction or expansion within a sideways trend.
- Bollinger Bands are effective in spotting price reversals or breakouts near overbought or oversold levels in a range-bound setup.
- Donchian Channel provides clear visual cues of upper and lower range limits, helping traders time entries and exits in sideways markets.
- Implied Volatility (IV) Skew can indicate options market sentiment and potential directional bias, especially useful during uncertain or range-bound conditions.
- Index PCR (Put-Call Ratio) OI offers insight into market sentiment and contrarian signals, helping filter false breakouts in non-trending phases.
A range bound or sideways market occurs when the prices of investments remain in a narrow range for an extended time.
They don’t make new highs or break out above the prior high. If they did, it would signal the start of a bull market.
They don’t dip below the prior level of support or create lower lows. If they did, it means they made a mistake. A bear market would be defined as a drop of 20% or more.
But how do we identify and trade in such range-bound markets? So, in today’s blog, we will discuss 6 Technical Indicators to use in Choppy Range-Bound Markets.
What is Range-Bound Trading?
The meaning of range-bound is the trading that aims to detect and profit from securities trading in price channels, such as stocks.
A trader can buy a security at the lower trendline support (bottom of the channel) and sell it at the upper trendline resistance after identifying important support and resistance levels and connecting them with horizontal trendlines (top of the channel) —an approach often aided by a sideways market indicator to confirm range-bound price action
When a securities trades between constant high and low prices for a while, this is known as a trading range. Price resistance is commonly found at the top of a security’s trading range, while price support is usually found at the bottom.
Traders profit from range-bound trading by buying and selling at the support and resistance trendlines until the security breaks out of the price channel.
The notion is that the price is more likely to rebound from these levels than to break through them, putting the risk-to-reward ratio in their favour, though a potential breakout or breakdown should always be kept in mind.
Now let us discuss the technical indicators that help us in identifying range-bound markets-
5 Technical Indicators to use in Choppy Range-Bound Markets
Below are 5 technical indicators that you can use for identifying range-bound markets:
1. Average True Range
The Average True Range (ATR) is a measure of volatility that looks at a security’s price activity over a set period.

The first step is to subtract the high from the low of a single price bar and compare the result to previous price ranges. The final calculation is based on a smoothed moving average of these values (actual ranges) across N periods, with ‘N’ being the technician’s preferred time setting. The most frequent ATR setting is 14 days (or cycles).
The formula does not indicate the price direction, but shares with high ATR values are more volatile than securities with low ATR readings.
Instead, it’s a complementary technical tool that works best in tandem with trend-following and momentum indicators. Many traders use ATR multiples to build exit strategies.
A market is range-bound when the ADX is below 25. Conversely, when the value of ADX crosses 25 from below, it indicates that the market is entering the trending phase.

2. Bollinger Bands
The Bollinger Band is a powerful indicator that provides traders with many trading signals. Most traders use it as a volatility channel and a momentum tool. In addition, traders use the upper and lower bands as a volatility channel to look for market volatility cues.
Traders pay great attention to the Bollinger Bands squeeze, which occurs when both the upper and lower bands converge or come together, often after a trending period.
A Bollinger Bands squeeze or contraction indicates little volatility in the underlying market. Periods of low volatility in the market are generally followed by periods of high volatility, providing traders with a lucrative opportunity to benefit from the following or anticipated shift.
Trading with Bollinger Bands works best in the range-bound markets. When the bands are thin and contradicted, volatility is low, and price moves in one direction, indicating a range-bound market.
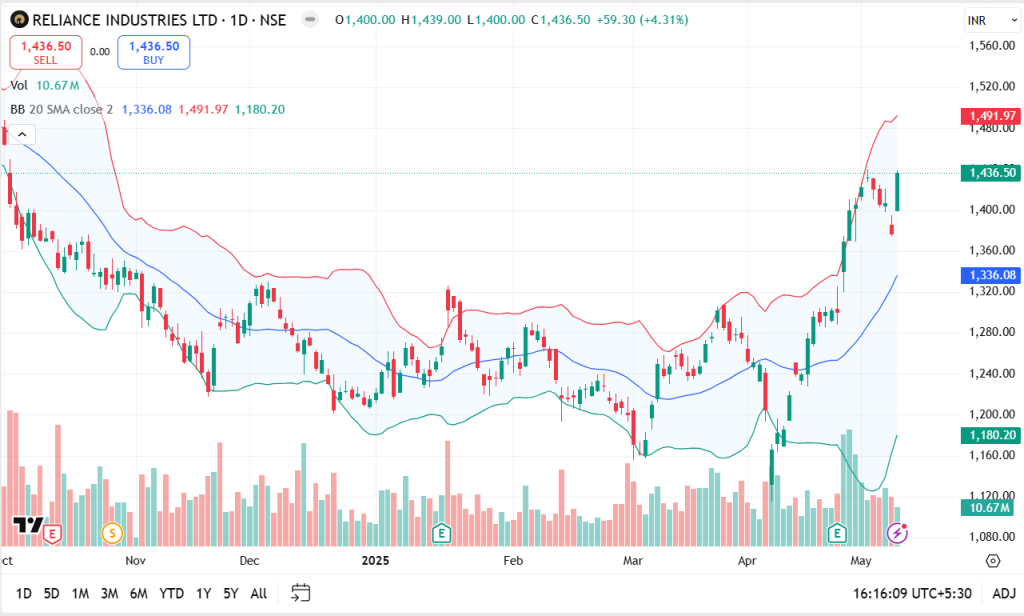
When the bands start expanding, volatility increases and prices start trending.
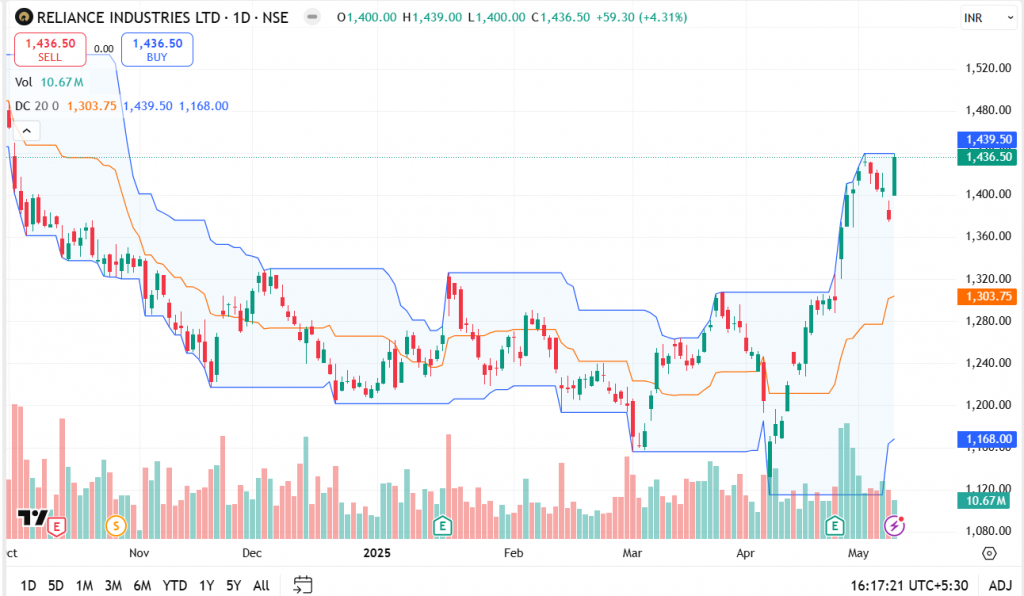
3. Donchian Channel
Donchian channels also work very well in range-bound markets like Bollinger bands.
Donchian Channels are three lines produced by upper and lower bands around a middle or median band and generated using moving average calculations.
The upper band represents a security’s greatest price over N periods, while the lower band represents a security’s lowest price over N times. The Donchian Channel is the area between the upper and lower bands.
When the bands are thin and contradicted, volatility is low, and price moves in one direction, indicating a range-bound market.
4. IV Skew
The volatility skew is options trading concept that asserts that option contracts for the same underlying asset with various strike prices but the same expiration will have varying implied volatility (IV).
Skew compares the IVs for in-the-money, out-of-the-money, and at-the-money options.
When the ratio of this indicator is between 1.3 to 0.80, it indicates that the market participants are confused and waiting for confirmation on either side.
5. Index PCR OI
The Put/Call Ratio (PCR) is a prominent derivative indicator used to help traders determine the market’s overall sentiment (mood). The ratio is derived using option trading volumes or open interest for a certain period.
If the ratio is greater than one, it indicates that more puts were traded during the day, whereas less than one indicates that more calls were traded.
The PCR can be estimated for the whole options segment, including individual stocks and indices.
Whenever PCR OI is in the range of 0.95 to 1.05 range, it indicates range-bound market.
Bottom Line
Above are some indicators that will help you identify a range-bound or sideways market. These tools serve as a reliable sideways market indicator, enabling traders to adjust their strategies accordingly. One should note that whether you’re trading in a trending or ranging environment, you can take comfort in knowing that profits are possible in either scenario.
We hope you found this blog informative and use it to its maximum potential in the practical world.
Happy Investing!
You can also visit web.stockedge.com, a unique platform that is 100% focused on research and analytics.


