Elearnmarkets - Financial Market Learning
  • Courses
  • Webinars
  • Stories
  • Language
    • English
    • Hindi
    • Bengali
No Result
View All Result
Get Free Course
  • Basic Finance
  • Derivatives
    • Futures
    • Options
  • Financial Planning
  • Fundamental Analysis
  • Technical Analysis
  • Mutual Funds
  • Marketshala
  • Miscellaneous
Elearnmarkets - Learn Stock Market, trading, investing for Free
  • Courses
  • Webinars
  • Stories
  • Language
    • English
    • Hindi
    • Bengali
No Result
View All Result
Get Free Course
Elearnmarkets - Learn Stock Market, trading, investing for Free
No Result
View All Result
Home Technical Analysis
relative strength

Trading with Relative Strength

Elearnmarkets by Elearnmarkets
February 25, 2025
in Technical Analysis
Reading Time: 9 mins read
0
28.7k
VIEWS
Share on FacebookShare on XShare on WhatsApp

Do you know that relative Strength can help us in trading in stronger stocks? Yes! You heard it right. Relative Strength is a momentum strategy that helps us identify strong stocks for trading compared to the Index.

With the help of Relative Strength, traders will look for companies that have outperformed their peers or the Index by rising more or falling less as compared to the peers or Index.

Relative Strength helps us predict that the trends currently displayed by the stocks will continue long enough, and we can realise a positive return. However, traders should note it is different from the Relative Strength Index.

So, without further delay, let us understand what is meant by Relative Strength and how we can trade with it:

Table Of Contents
  1. What is Relative Strength (RS)?
    • Beta and Alpha? Why are we talking about them here?
  2. Calculation of Relation Strength
  3. How does Relative Strength work?
  4. How to trade with Relative Strength using StockEdge?
  5. Difference between Relative Strength and Relative Strength Index
  6. How to learn Relative Strength (RS)?
    • 1. How to get stock ideas with  RS?
    • 2. How to identify master-blaster stocks with RS?
    • 3. How to do systematic trading using  RS?
    • 4. How to trade using Crossovers and RS?
    • 5. How do you develop a trading strategy using RS?
    • To know more, please watch our video on Relative Strength by Mr Vivek Bajaj
  7. Conclusion

What is Relative Strength (RS)?

Relative Strength measures the stock’s performance compared to its benchmark or another stock. RS compares the performance of stock “X” vs “Y”, measured over a period. For example, “X” may increase more or less than “Y” in a rising market or “X” may fall more or less as compared to “Y” in a falling market. 

Relative Strength is one of the momentum indicators. Momentum indicators help traders to understand the speed at which the price of particular stock changes. These indicators help us understand the strength of price movements. Sometimes the stock prices fall fast, but at other times they might fall slow. We can analyse the speed of the fall or rise in particular stocks by using the momentum indicators.

RS helps us identify the strongest and the weakest securities or asset classes within the financial market. The stocks that display strong or weak RS over a given period tend to continue. RS analysis can be applied to domestic or international stocks, stock indexes, fixed-income indexes, currencies, commodities, and other asset classes.

You must have heard about beta and Alpha when studying statistics in school. If not, let us recap these concepts in this context. Don’t worry; we won’t be too statistical!

Beta and Alpha? Why are we talking about them here?

Beta is a measure of volatility relative to a benchmark, and it’s easier to talk about beta first. It helps us measure the systematic risk of a security or a portfolio compared to an index like the Nifty 50.

The Alpha is the excess return on an investment or a stock after adjusting for market-related volatility and random fluctuations. Alpha is one of the major risk management indicators when it comes to analyzing mutual funds, stocks, and bonds. It tells investors whether an asset has consistently performed better or worse than its beta predicts. So Alpha more than 0 means that a stock has outperformed, and less than 0 means that a stock has underperformed after adjusting for volatility.

The high-beta stocks would be more profitable but are also riskier. The high beta stocks could also have a negative alpha which means that although more volatile, their trends compared to the Nifty50 could be downward. So when Alpha is compared among the stocks, it provides us with a relative strength measure, and Alpha can rank stock lists to show which stocks are the strongest.

Calculation of Relation Strength

Now let us come to the calculation of RS. RS is calculated using the formula below for comparing a stock’s price change to a change in index prices. Relative Strength Formula-

RS= Stock’s Price / Index’s Price

For calculating the RS of one stock to another where N is the first stock, and N1 is the second stock, we are comparing it to as below:

RS= N Stock’s Price/ N2 Stock’s Price

The period of both assets should be the same such as one day or year.

How does Relative Strength work?

Now that we have understood what RS means and how we can calculate the same, let us discuss how we can trade stronger stocks using RS with the help of an example-Reliance India Ltd.

Trading with Relative Strength 1

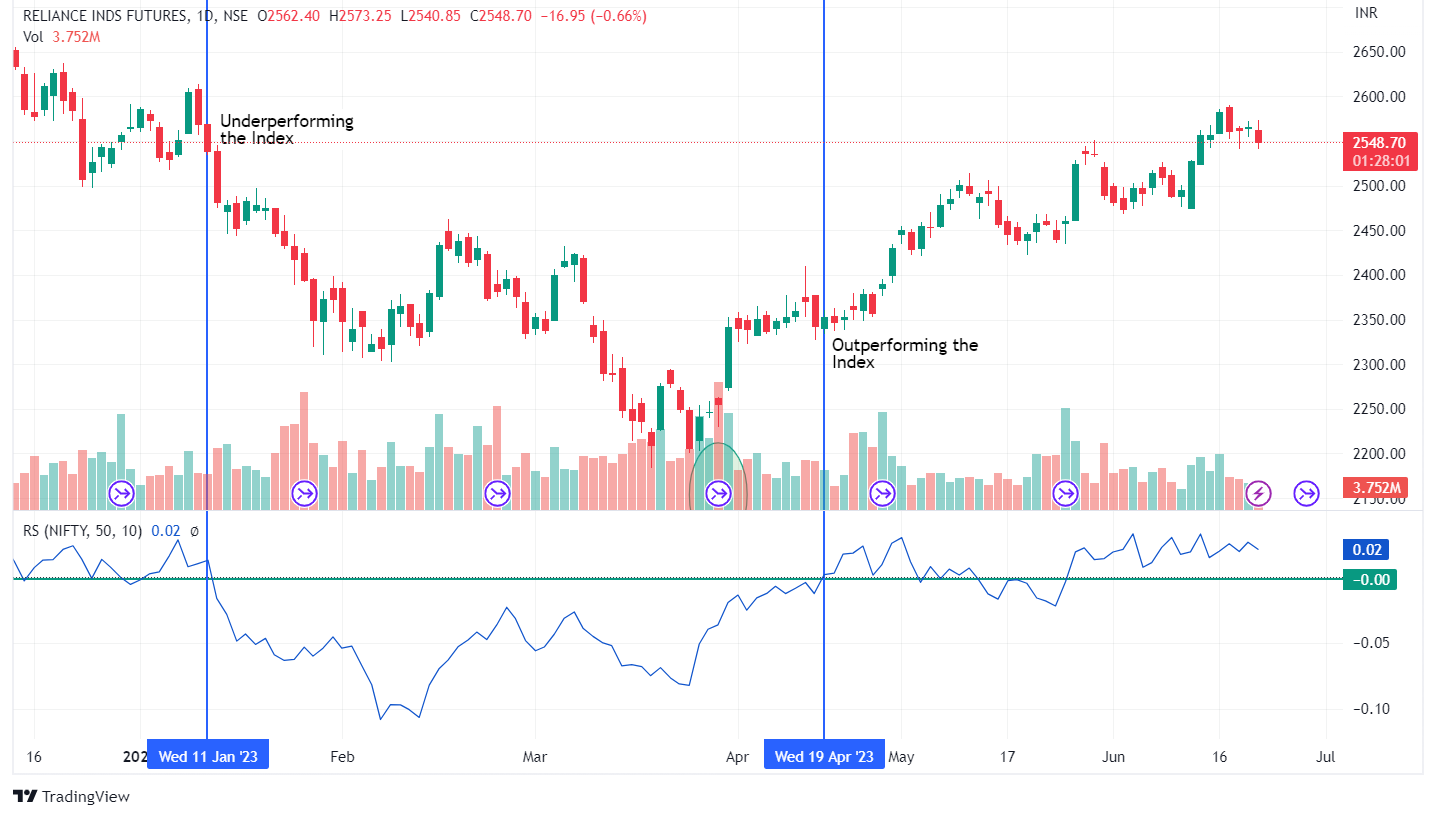
In the above daily chart of Reliance India Ltd. We have plotted the RS line (blue line) compared to Nifty 50 of the last 50 periods.

When the RS line crosses above 0, the stock outperforms the Index, and when it crosses below 0, the stock is underperforming the Index. So, from the above chart, we can see that on 11th March, the RS line crossed the 0 lines when the bearish phase of the stock started. This shows that the stock is getting weak and underperforming the Index as prices decrease. Traders can short, ride the downtrend and gain profits until the RS line exceeds the 0 lines.

Traders should also use other technical indicators such as supertrend, moving average, volume etc., along with the RS line. 

But the question is how we identify the stocks that crossed the 0 lines and either outperformed or underperformed the Index or the sectors.

For that, we can take the help of StockEdge.

How to trade with Relative Strength using StockEdge?

StockEdge helps us in filtering the stocks which are either outperforming or underperforming the Index or the sectors and other Relative Strength scans as shown below:

Trading with Relative Strength 2

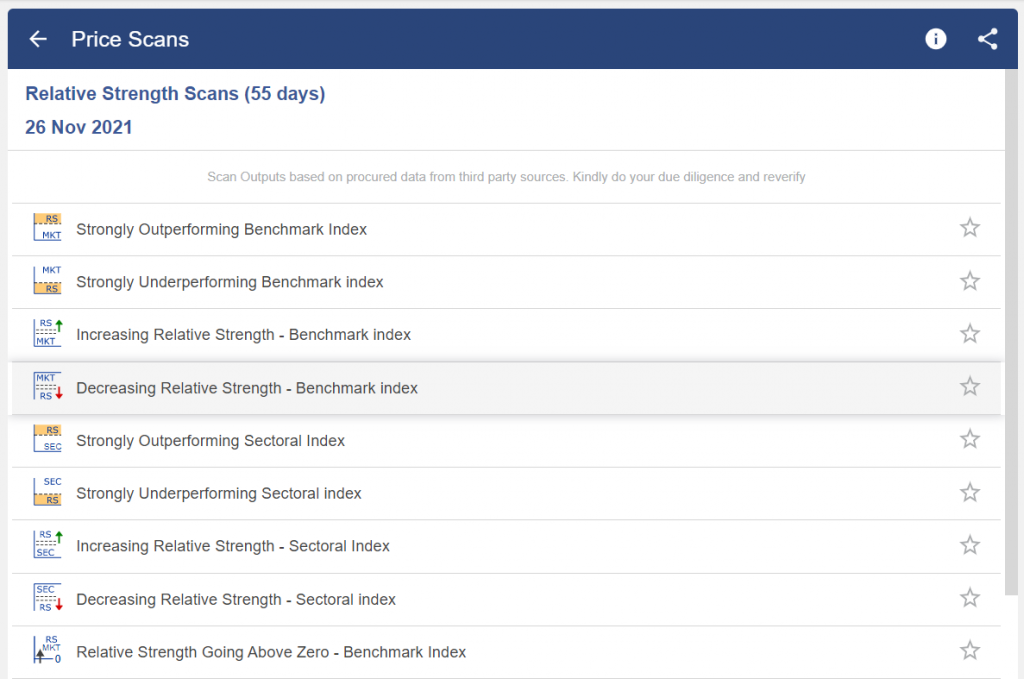
For example, the Strongly Outperforming Benchmark Index scan gives us the list of stocks with RS>0.1 and denotes that the stocks outperform the Index.

 After clicking on this scan, we get a list of the stocks outperforming the Index, as shown below:

Trading with Relative Strength 3

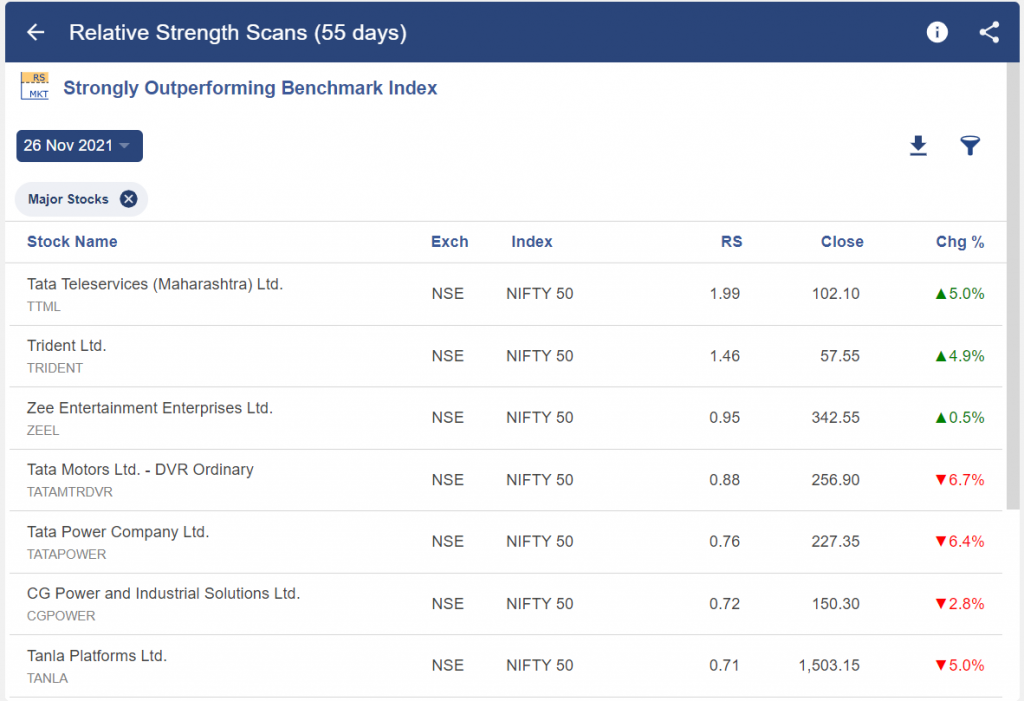
Thus, with the help of these scans, we can easily identify those stocks that are either outperforming or underperforming the Index or sector in the last 55 days.

Difference between Relative Strength and Relative Strength Index

As we said at the beginning that RS is different from RSI. 

Relative Strength Index (RSI) is a momentum indicator that measures the magnitude of recent price changes for evaluating overbought or oversold conditions in the price of a stock or other asset.

The main difference between relative Strength and RSI is a difference in perspective. Relative Strength tells us about the value of a stock in comparison to another stock, Index or sector. In contrast, the RSI tells about the performance of a stock in comparison to the recent performance of the same stock.

How to learn Relative Strength (RS)?

You can learn more about Relative Strength by watching our webinars conducted by market experts such as :

1. How to get stock ideas with  RS?

One can successfully trade the stock markets with a strong understanding of price movement. Price can give the best probable direction. With Relative Strength, Adaptive Relative Strength & Comparative Relative Strength concepts, traders can easily analyse stocks, build conviction for scaling up with trends and initiate larger positions.

2. How to identify master-blaster stocks with RS?

Learning these concepts of Relative Strength, Adaptive Relative Strength & Comparative Relative Strength will help traders to find MASTER BLASTER stocks that consistently outperform the Benchmark Nifty 50. Traders can easily analyse stocks and build conviction for scaling up with trends and initiating larger positions.

3. How to do systematic trading using  RS?

 Systematic trading using Relative Strength/ Momentum will help traders to understand How to identify the strongest stocks? It will also help them know how to create a basket of stocks and allocate capital, Rebalance stocks and Managing Risk.

4. How to trade using Crossovers and RS?

 Crossovers and relative Strength will help you learn about the amalgamation of Dow Theory with a modified Relative Strength as the catalyst for momentum-driven trades.

5. How do you develop a trading strategy using RS?

Trading is a science that needs a strong understanding of price movement. It is a widely accepted theory in trading that price is God. Why spend so much time on other facets when the price can give you the best probable direction? Traders can develop Trading Strategy using Relative Price Theory will equip the traders to identify stock ideas with the highest chance of success.

You can also join our course on TRADING MENTORSHIP PROGRAM

To know more, please watch our video on Relative Strength by Mr Vivek Bajaj

Conclusion

Trading with relative Strength requires a strategy. Traders should not just randomly buy a strong stock. They still need to follow a trading plan which defines how and where they can enter, control risk, position size, and exit the stock. Relative Strength gives us an idea of trading in stronger stocks. We hope you found this blog informative and use the information to its maximum potential in the practical world.

Learn more about share market online courses on our platform.

Tags: basicenglishrelative strengthtechnical analysis
ShareTweetSend
Get Kotak Offer Get Kotak Offer Get Kotak Offer
Previous Post

What to Expect from RBI Policy Meeting?

Next Post

How to do Commodity and Currency Trading?

Elearnmarkets

Elearnmarkets

Elearnmarkets (ELM) is a complete financial market portal where the market experts have taken the onus to spread financial education. ELM constantly experiments with new education methodologies and technologies to make financial education effective, affordable and accessible to all. You can connect with us on Twitter @elearnmarkets.

Related Posts

Understand Slippage in Trading
Technical Analysis

What is Slippage in Trading? Meaning & Examples

March 28, 2025
361
Breakout trading strategies
Technical Analysis

Top 5 Breakout Trading Strategies

March 12, 2025
1.3k
5 stocks for today
Technical Analysis

5 Stocks to Buy Today That Could Beat the NIFTY in 2025!

May 5, 2025
449
Image describing What is marginal trading facility
Technical Analysis

 What is a Margin Trading Facility? Advantages & Risks

April 4, 2025
860

Leave a Reply Cancel reply

Your email address will not be published. Required fields are marked *

Disclaimer

Elearnmarkets (Kredent InfoEdge Pvt. Ltd.) is a SEBI-registered Research Analyst (RA) entity (SEBI Registration No.: INH300007493). The information provided in this article is for educational and informational purposes only and should not be considered as an offer to buy or sell any securities or investment products.

The stocks, securities, and investment instruments mentioned herein are not recommendations under SEBI (Research Analysts) Regulations, 2014. Readers are advised to conduct their own due diligence and seek independent financial advice before making any investment decisions.

Investments in securities markets are subject to market risks. Please read all related documents carefully before investing. Investing in Equity Shares,
Derivatives, Mutual Funds, or other instruments carry inherent risks, including potential loss of capital. Elearnmarkets (Kredent InfoEdge Pvt. Ltd.) does not provide any guarantee or assurance of returns on any investments. Past performance is not indicative of future performance.

Elearnmarkets Logo

Follow Us

Facebook-f X-twitter Instagram Linkedin-in Youtube Telegram

Register on Elearnmarkets

Continue your financial learning by creating your own account on Elearnmarkets.com

Register Free Account

Download App

Playstore logo
Download on app store

Categories

  • Basic Finance
  • Derivatives
  • Financial Planning
  • Fundamental Analysis
  • Technical Analysis
  • Mutual Funds
  • Miscellaneous

Popular On Elearnmarkets

  • Market Superheroes:
  • Vivek Bajaj
  • Chetan Panchamia
  • Ashish Kyal
  • Premal Parekh
  • Abhijit Paul
  • Jegan
  • Sivakumar Jayachadran
  • Jyoti Budhia
  • Vivek Gadodia
  • Vishal Mehta
  • Piyush Chaudhry
  • Santosh Pasi
  • Gomathi Shankar
  • Market Superheroes:
  • Vivek Bajaj
  • Chetan Panchamia
  • Ashish Kyal
  • Premal Parekh
  • Abhijit Paul
  • Jegan
  • Sivakumar Jayachadran
  • Jyoti Budhia
  • Vivek Gadodia
  • Vishal Mehta
  • Piyush Chaudhry
  • Santosh Pasi
  • Gomathi Shankar
  • Courses:​
  • Options Trading
  • Dow Theory
  • Momentum Trading
  • Stock Investing
  • Harmonic Chart Patterns
  • Algo Trading
  • Elliot Wave Theory
  • Advanced Excel
  • Cryptocurrency
  • NSE Certification Course
  • Courses:​
  • Options Trading
  • Dow Theory
  • Momentum Trading
  • Stock Investing
  • Harmonic Chart Patterns
  • Algo Trading
  • Elliot Wave Theory
  • Advanced Excel
  • Cryptocurrency
  • NSE Certification Course
  • Webinars:
  • Bank Nifty Scalping
  • Intraday Trading Strategies
  • Options Trading Strategies
  • Options selling
  • Price Action
  • Relative Strength
  • Tax Planning
  • Options Buying
  • Growth Stocks
  • Portfolio Management
  • Risk Management
  • Renko Charts
  • Crude Oil
  • Traders Psychology
  • Moving Average
  • Multibagger Stocks
  • Free Learning Modules:
  • Intraday Trading
  • Options Scalping
  • Swing Trading
  • Financial Modelling
  • RSI Indicator
  • Bollinger Bands
  • Pricing of Futures
  • Personal Finance
  • Initial Public Offerings (IPO)
  • Value Investing
  • Technical Indicators
  • Candlesticks
  • Chart Patterns
  • Option Greeks
  • ELSS Funds
  • Banking and Insurance
  • Real Estate
  • Gold
  • Book Summaries:
  • Rich Dad Poor Dad
  • Psychology of Money
  • The Intelligent Investor
  • The Richest Man in Babylon
  • Think and Trade Like a Champion
  • Value Investing and Behavioural Finance
  • Trading in the Zone
  • Learn to Earn
  • Book Summaries:
  • Rich Dad Poor Dad
  • Psychology of Money
  • The Intelligent Investor
  • The Richest Man in Babylon
  • Think and Trade Like a Champion
  • Value Investing and Behavioural Finance
  • Trading in the Zone
  • Learn to Earn
  • Tools:
  • CAGR Calculator
  • SIP Calculator
  • eLearnOptions
  • Future Value Calculator
  • Present Value Calculator
  • Atal Pension Yojana
  • Cost of Delay Calculator
  • Become a Crorepati
  • Tools:
  • CAGR Calculator
  • SIP Calculator
  • eLearnOptions
  • Future Value Calculator
  • Present Value Calculator
  • Atal Pension Yojana
  • Cost of Delay Calculator
  • Become a Crorepati

© 2025 Elearnmarkets. All Rights Reserved

  • Visit Elearnmarkets
  • Courses
  • Webinars
  • Financial Guides
  • Get Free Counselling
  • Visit Elearnmarkets
  • Courses
  • Webinars
  • Financial Guides
  • Get Free Counselling

Download Our App

No Result
View All Result
  • Article Categories
    • Basic Finance
    • Derivatives
    • Financial Planning
    • Fundamental Analysis
    • Technical Analysis
    • ETFs & Mutual Funds
    • Marketshala
    • Miscellaneous
  • Language
    • Hindi
    • Bengali
    • English
  • Courses
  • Webinars
  • Stories
Get Free Course

© 2024 Elearnmarkets All Rights Reserved

A Handbook of Technical Analysis
To start your trading journey as a seasoned technical analyst
Download Guide For FREE
How to Spot False Dips and Trade with Confidence