Volume weighted average price is a versatile tool used by technical traders to identify good equities for investment. Mutual fund portfolio managers use it when they need to buy a large quantity of a particular stock.
Similarly, retail traders use VWAP to determine a stock’s future potential, and intraday traders use VWAP to determine the market’s mean price to buy a stock when it is below VWAP.
It is a weighted average formula that analysts and traders widely use to determine a stock’s demand in terms of volume and price. It considers all orders from the day and calculates the mean value for calculation purposes. Depending on the requirements, it can be spread over single or multiple time frames.
Analysts and portfolio managers use VWAP to remove noise caused by price fluctuations throughout the day and determine a fair price to buy or sell stocks. It shows traders how the stock traded during the day.
So, In today’s blog, let us discuss the Volume Weighted Average Price (VWAP) Indicator and how to use this indicator.
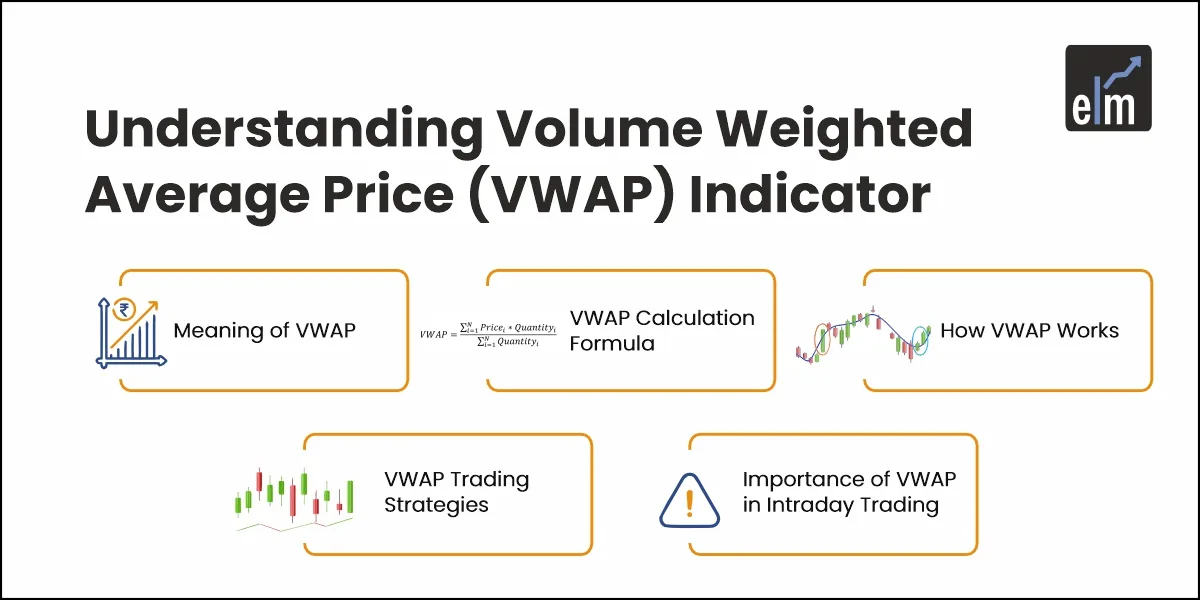
What is Volume Weighted Average Price Indicator?
The volume-weighted average price is a trading indicator calculated by multiplying the number of shares purchased by the share price and then dividing by the total number of shares purchased.
Essentially, it calculates the stock’s average price based on how many shares were traded at different prices over a one-day period. The VWAP is shown as a moving average on the chart, but it moves much slower than your 8 and 20-day moving averages.
This is an important indicator and guideline for institutions and pension funds looking to take large positions and want to know if they are getting in at a good price.
Calculation of Volume Weighted Average Price
Each day, the volume-weighted average price is computed. It begins with the opening of the markets and ends with closing the markets for the day. The calculation uses intraday data because it is done every day. VWAP is calculated using the following formula:
The VWAP calculation consists of five steps. First, determine the average price for the intraday period. This is the mean of the high, low, and close values: {(H+L+C)/3)}. Second, multiply the typical price by the volume of the period.
Finally, keep a running total of these values. This is also known as a total cumulative. Fourth, keep a running total of the volume (cumulative volume). Fifth, divide the price-volume running total by the volume running total.
How to interpret VWAP Indicator?
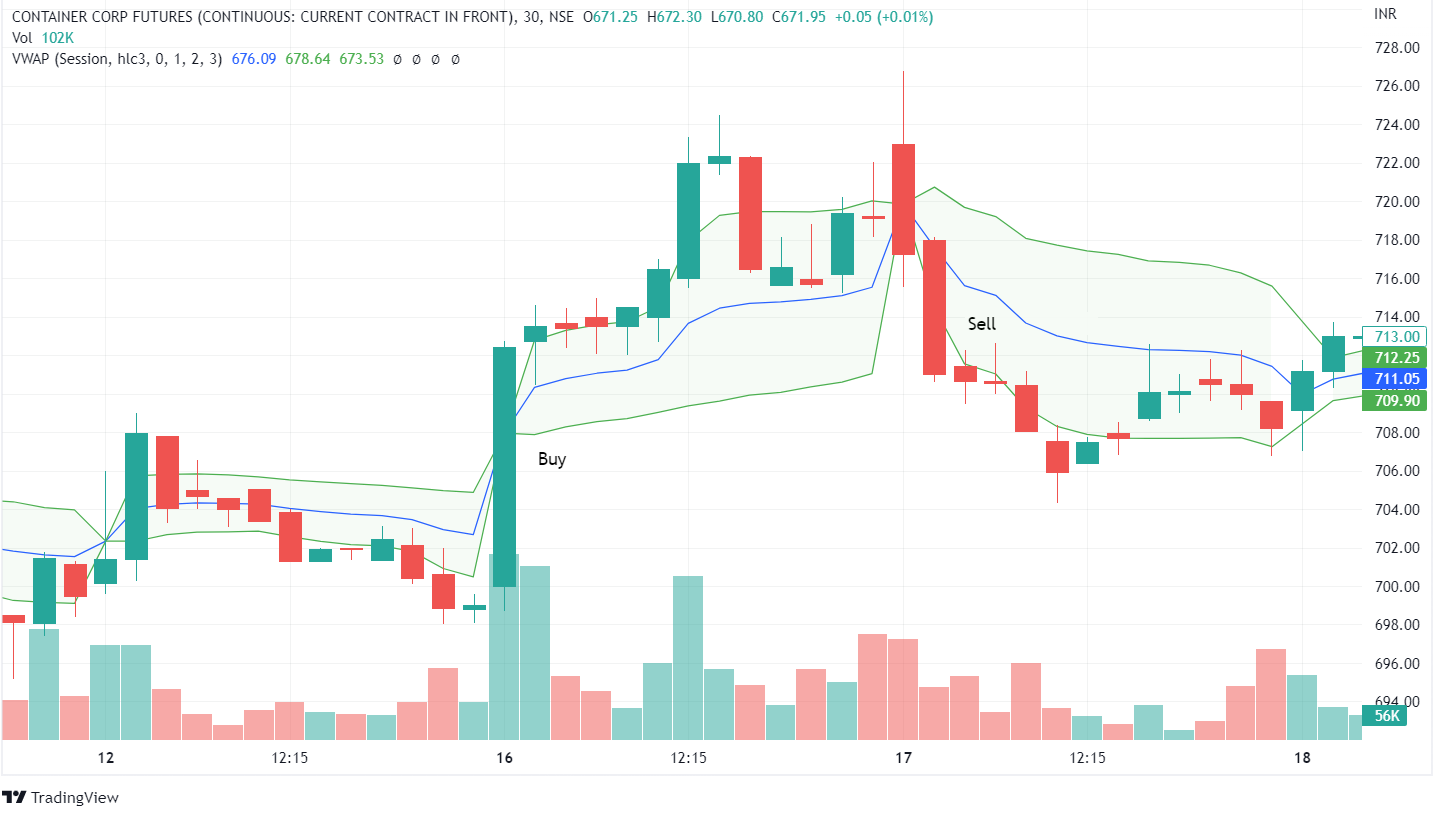
VWAP provides traders with critical information about a stock’s price movement, such as identifying the exact point in a time frame where the momentum lies. Consider this scenario: a trader may be dealing with a stock repeatedly failing to break above the VWAP line due to constant selling pressure.
So, if he enters a short position, he may want to know the exact point at which the stock successfully breaks above the VWAP indicator line, or he may end up on the wrong side of market momentum.
Stocks trading below the VWAP line are considered ‘cheap’ or ‘of value’ and signal traders to go short. On the other hand, stock prices above the VWAP line are labelled ‘expensive.’
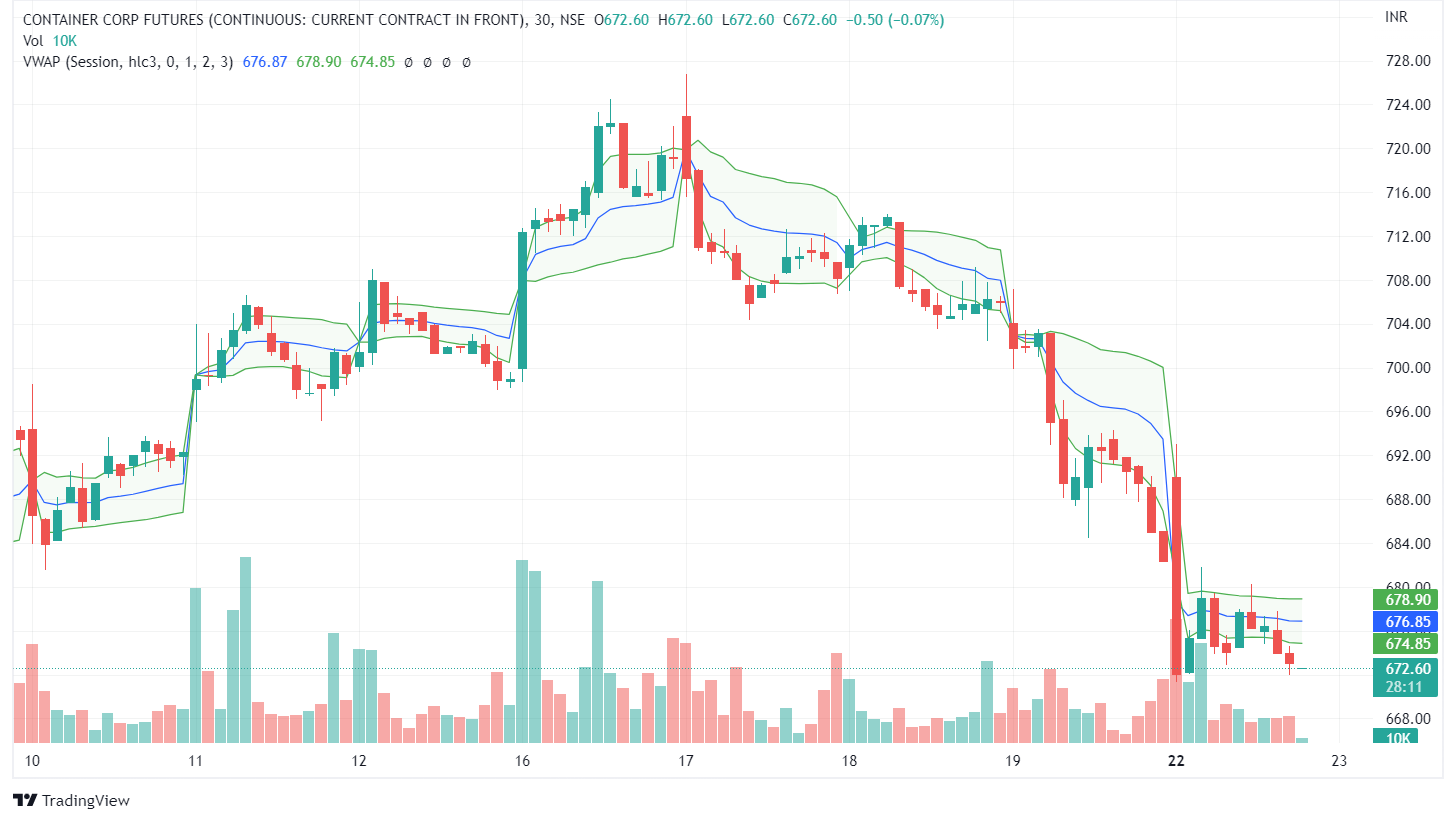
So, how do you know whether a price moves above or below the VWAP line? A technical system can be programmed to combine candlestick charts and trend lines drawn together. The trend line is treated similarly to a support and resistance line in a VWAAP chart, and the candlesticks represent price movement.
How to trade with VWAP Indicator?
VWAP provides an understanding of both price and volume, and as a result, it has many applications in trading.
1. It can indicate whether the market is bullish or bearish.
When the price is below the VWAP, the market is bearish; when the price is above the VWAP, the market is bullish. The buying price will rise during a bullish market, and the trend line on the chart will move upward. During a bear market, however, there is more pressure to sell the stock, resulting in a downward trend on the stock chart.

2. You will understand when to sell or buy.
When there is a signal to buy a stock, investors who use the VWAP as a technical analysis tool will not buy it. Instead, they wait for a good deal. A trader who pays less than the VWAP line for a stock will not pay more than the stock’s average price.
Traders who use the VWAP line as an indicator, on the other hand, will be able to buy at a low price and profit more when they sell the stock. When purchasing stocks, VWAP allows the investor to make more informed decisions.

3. It is a more effective tool than the moving average.
The VWAP is also used by pension funds looking to expand their market share. It enables them to take a different stance without significantly disrupting the market. Timing is everything in day trading, and the VWAP tells investors when to enter and exit the market rather than just following the general trend.
You can also join our course on Certification In Online Technical Analysis
Bottomline
The VWAP is an excellent indicator for determining which stocks to buy, but it is even more useful when combined with other trading strategies. It is a formula that can reveal a lot about a stock’s current and future state for both long and short positions. VWAP can assist investors in making more informed trades.
Frequently Asked Questions (FAQs)
1. What is VWAP?
Volume-Weighted Average Price is referred to as VWAP. Traders and investors use it as a trading benchmark to determine the average price at which a security has traded over the course of the day based on price and volume.
2. How is VWAP calculated?
VWAP is computed by taking the price multiplied by the number of shares traded to get the total dollar amount traded for each transaction, then dividing that amount by the total volume of shares traded over a given period of time.
3. Why is VWAP important?
VWAP is significant because it tells investors and traders what the average price of a security has been during the day. It is frequently employed to evaluate how well a trader executes in relation to the market.
For more Market Updates, Visit StockEdge


