How to trade with High-Wave Candlestick Pattern?
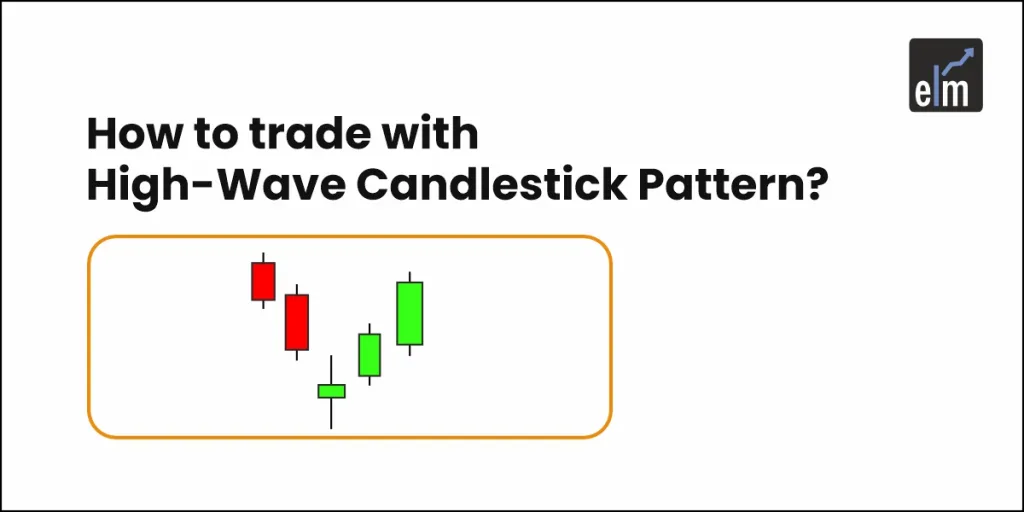
Indecision candlesticks that resemble long-legged Dojis are known as High-wave candlestick patterns. In today's blog, we will discuss how to spot high wave candlesticks and trade them.


Indecision candlesticks that resemble long-legged Dojis are known as High-wave candlestick patterns. In today's blog, we will discuss how to spot high wave candlesticks and trade them.
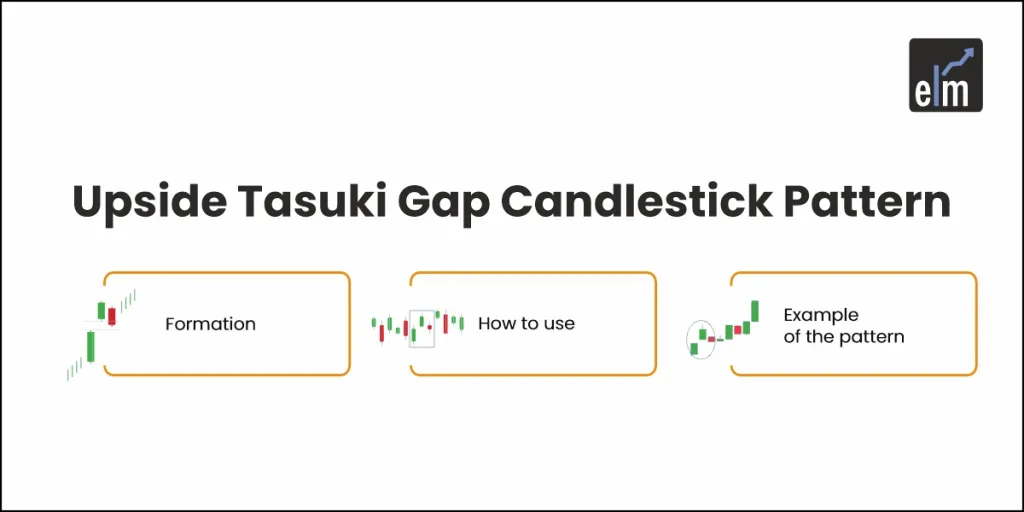
The Upside Tasuki Gap is a bullish continuation candlestick pattern which is formed in an ongoing uptrend.
If correctly interpreted, the red and green candlesticks always tell a story. Let's look at the story behind a group of five candlesticks known as rising or falling three method candlestick patterns when arranged in a specific way.
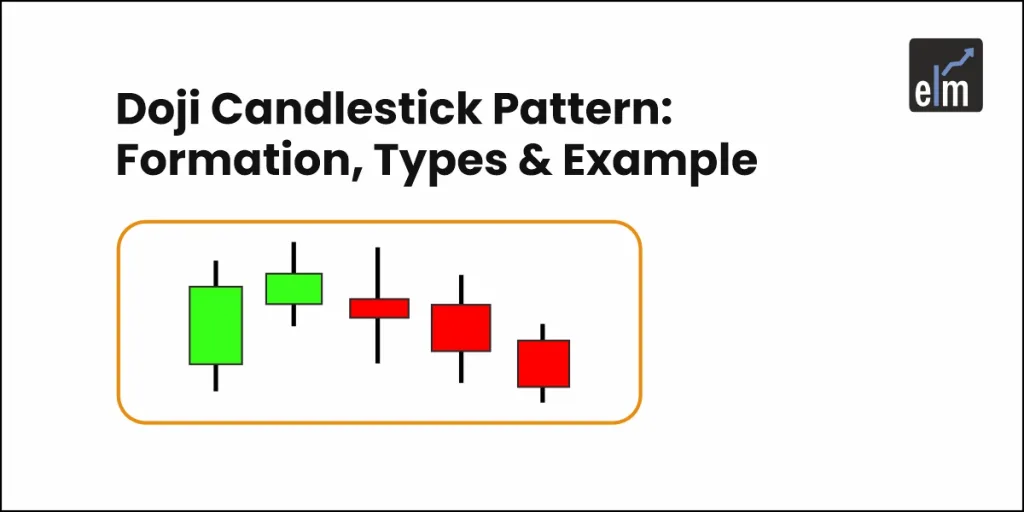
A Doji is a candlestick pattern that looks like a cross. The versatility of this candlestick pattern is appreciated by all types of traders for different time frames.
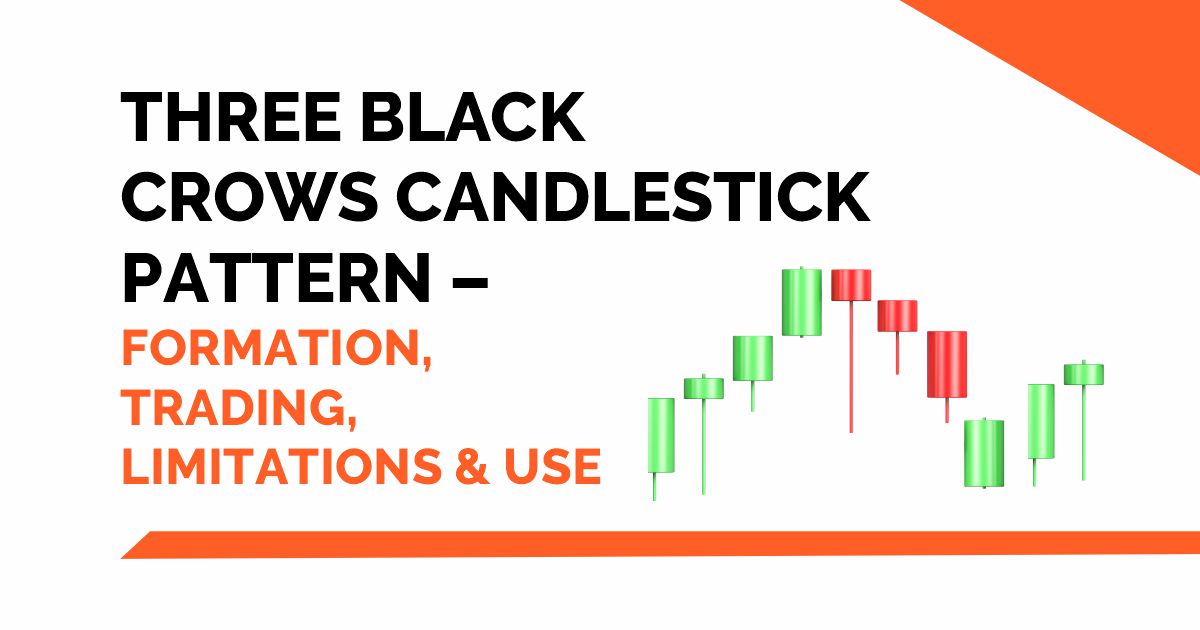
The Three Black Crows pattern is a bearish reversal pattern that consists of three bearish long-bodied candlesticks.
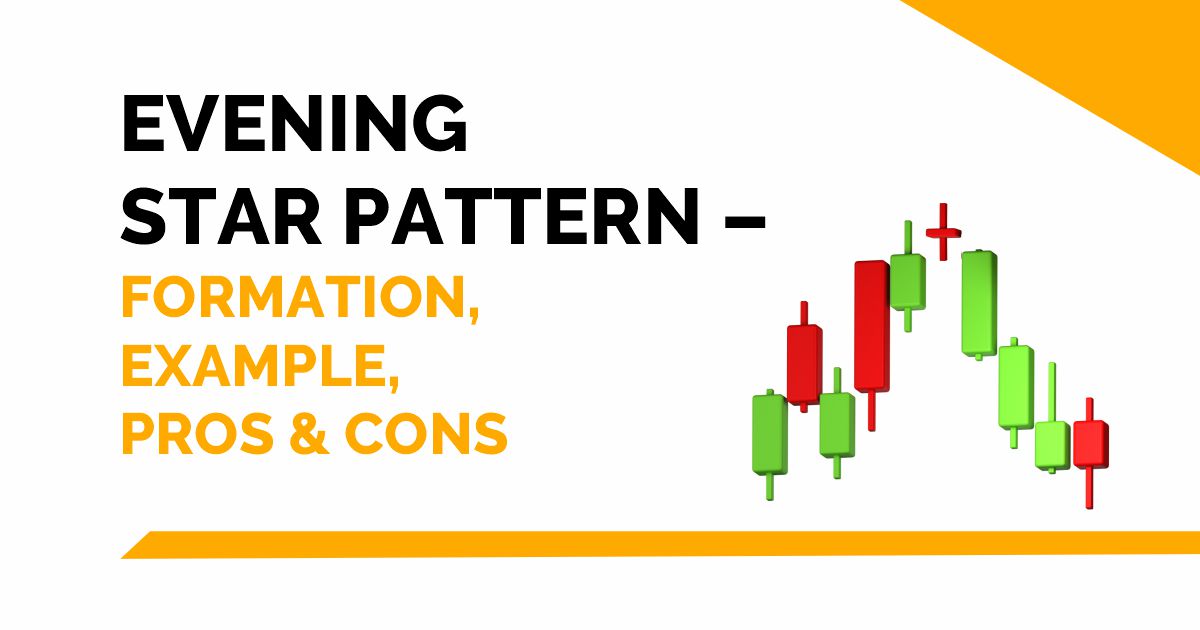
Traders should be aware of different trading pattern. Evening Star is an important one to pay attention to. As the Evening Star indicates that the uptrend is going to end, the appearance of it is a red flag to traders...
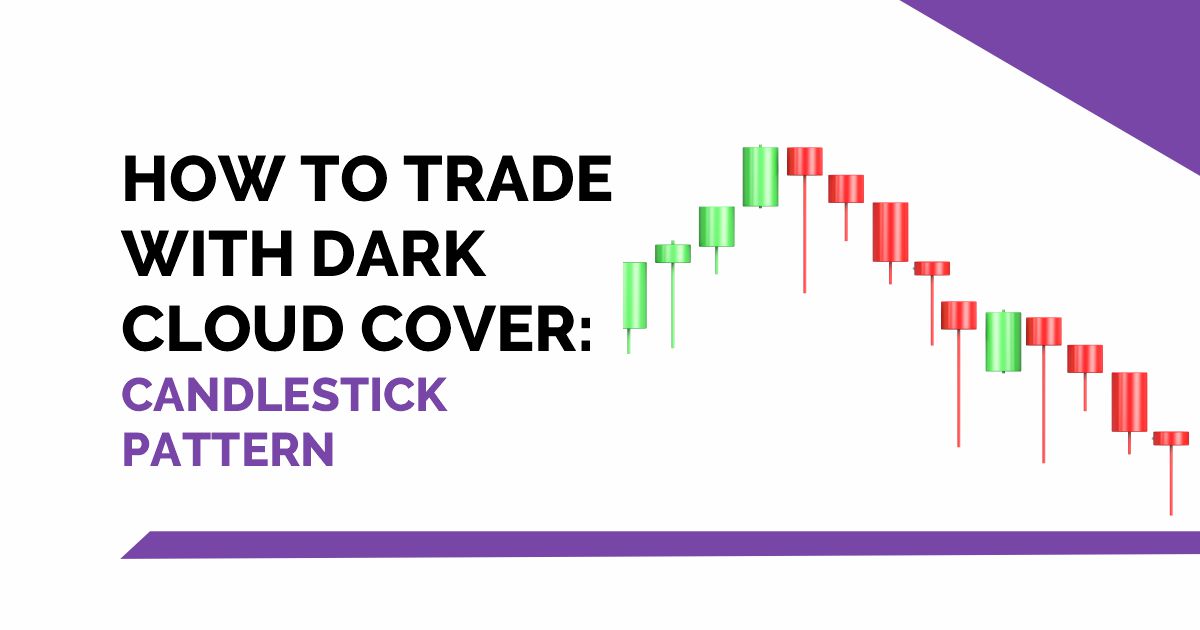
Hindi: आप इस लेख को हिंदी में भी पढ़ सकते है| Dark Cloud Cover is a bearish reversal candlestick pattern that is formed at the end of an uptrend. It signals potential weakness in the uptrend. It is made of...
Hanging Man candlestick pattern is a single candlestick pattern that if formed at an end of an uptrend. It is a bearish reversal pattern that signals that the uptrend is going to end.
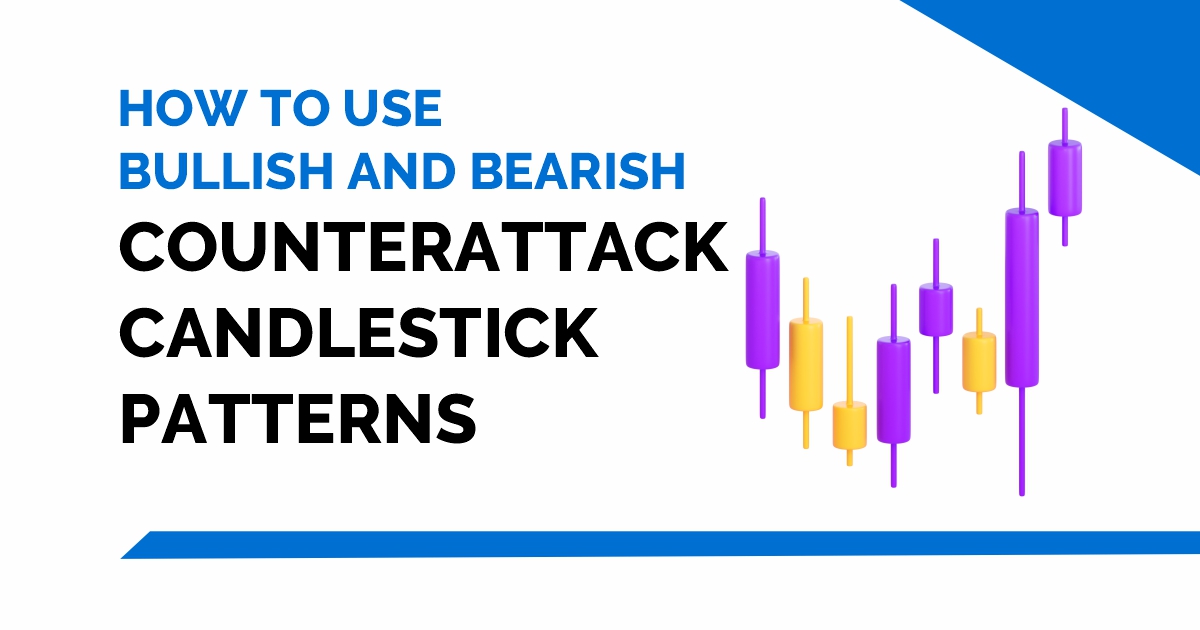
Today's blog will discuss everything you need to know about Counterattack Candlestick Patterns, which indicate a trend reversal.
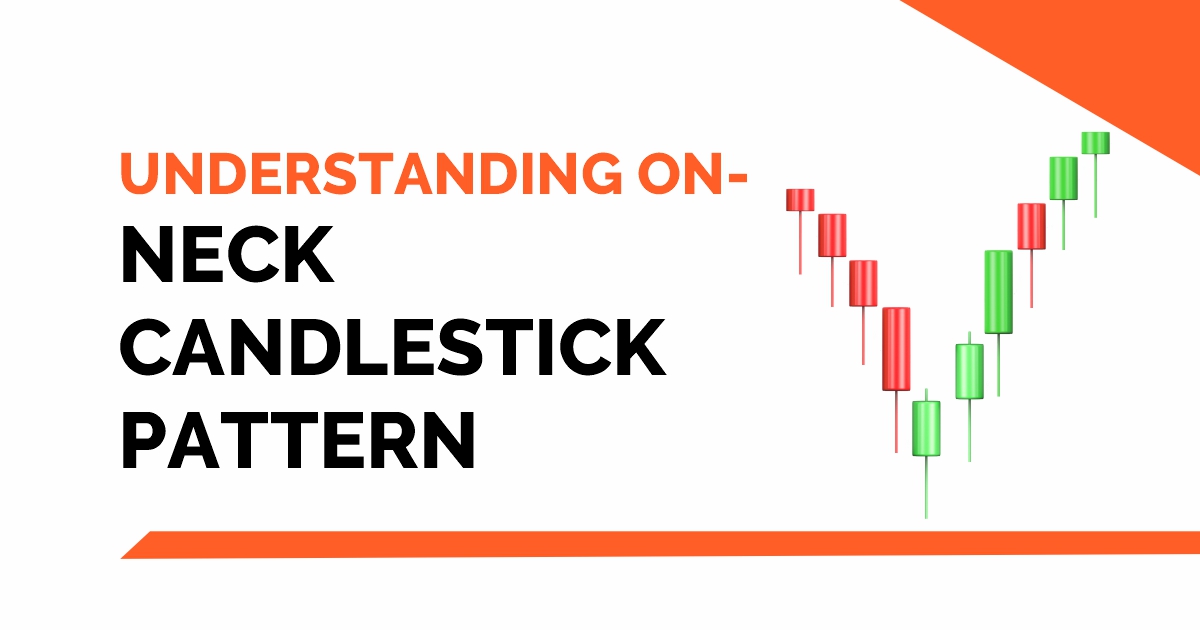
The On-Neck Candlestick Pattern is made up of two candlesticks: a tall down candle and a much shorter up candle that gaps down on the open but closes at or near the previous candle's close. ut this candlestick pattern in...
The three up/down candlestick patterns are variations of chart candle reversal patterns. They are usually used to indicate a trend reversal. So, in today’s blog will discuss Three Outside up and Three Outside Down Candlestick Patterns.
The inverted hammer is a candlestick pattern in financial chart analysis that typically signals a potential reversal in the prevailing trend. It appears as a single candlestick with a small body at the top and a long lower shadow, resembling...