Key Takeaways:
- On-Neck forms in a downtrend with a bearish candle followed by a small bullish candle closing near the prior low.
- Suggests bearish continuation, not reversal.
- Traders wait for a confirming bearish candle to go short.
- On-Neck closes at or slightly above the first candle’s low.
- In-Neck closes slightly higher, showing a mild bullish push.
The On-Neck Candlestick Pattern is made up of two candlesticks: a tall down candle and a much shorter up candle that gaps down on the open but closes at or near the previous candle’s close.
The pattern is called “On Neck” because it produces a horizontal line that can be interpreted as a “neckline” or “neck” when the two closing prices are the same (or nearly the same) throughout the two candles.
Let us discuss about this candlestick pattern in detail-
What is On-Neck Candlestick Pattern?
When a long real body down candle is followed by a smaller real bodied up candle that gaps down on the open but closes near the prior candle’s close, the on neck pattern occurs.
The pattern is known as a neckline because the closing prices of the two candles are the same (or nearly the same), forming a horizontal neckline.
In theory, the pattern is considered a continuation pattern, implying that the price will continue to fall as a result of the pattern. In actuality, this happens just about half of the time. As a result, the pattern frequently implies at least a short-term upward reversal.
Formation
Look for the following characteristics to identify the On Neck pattern:
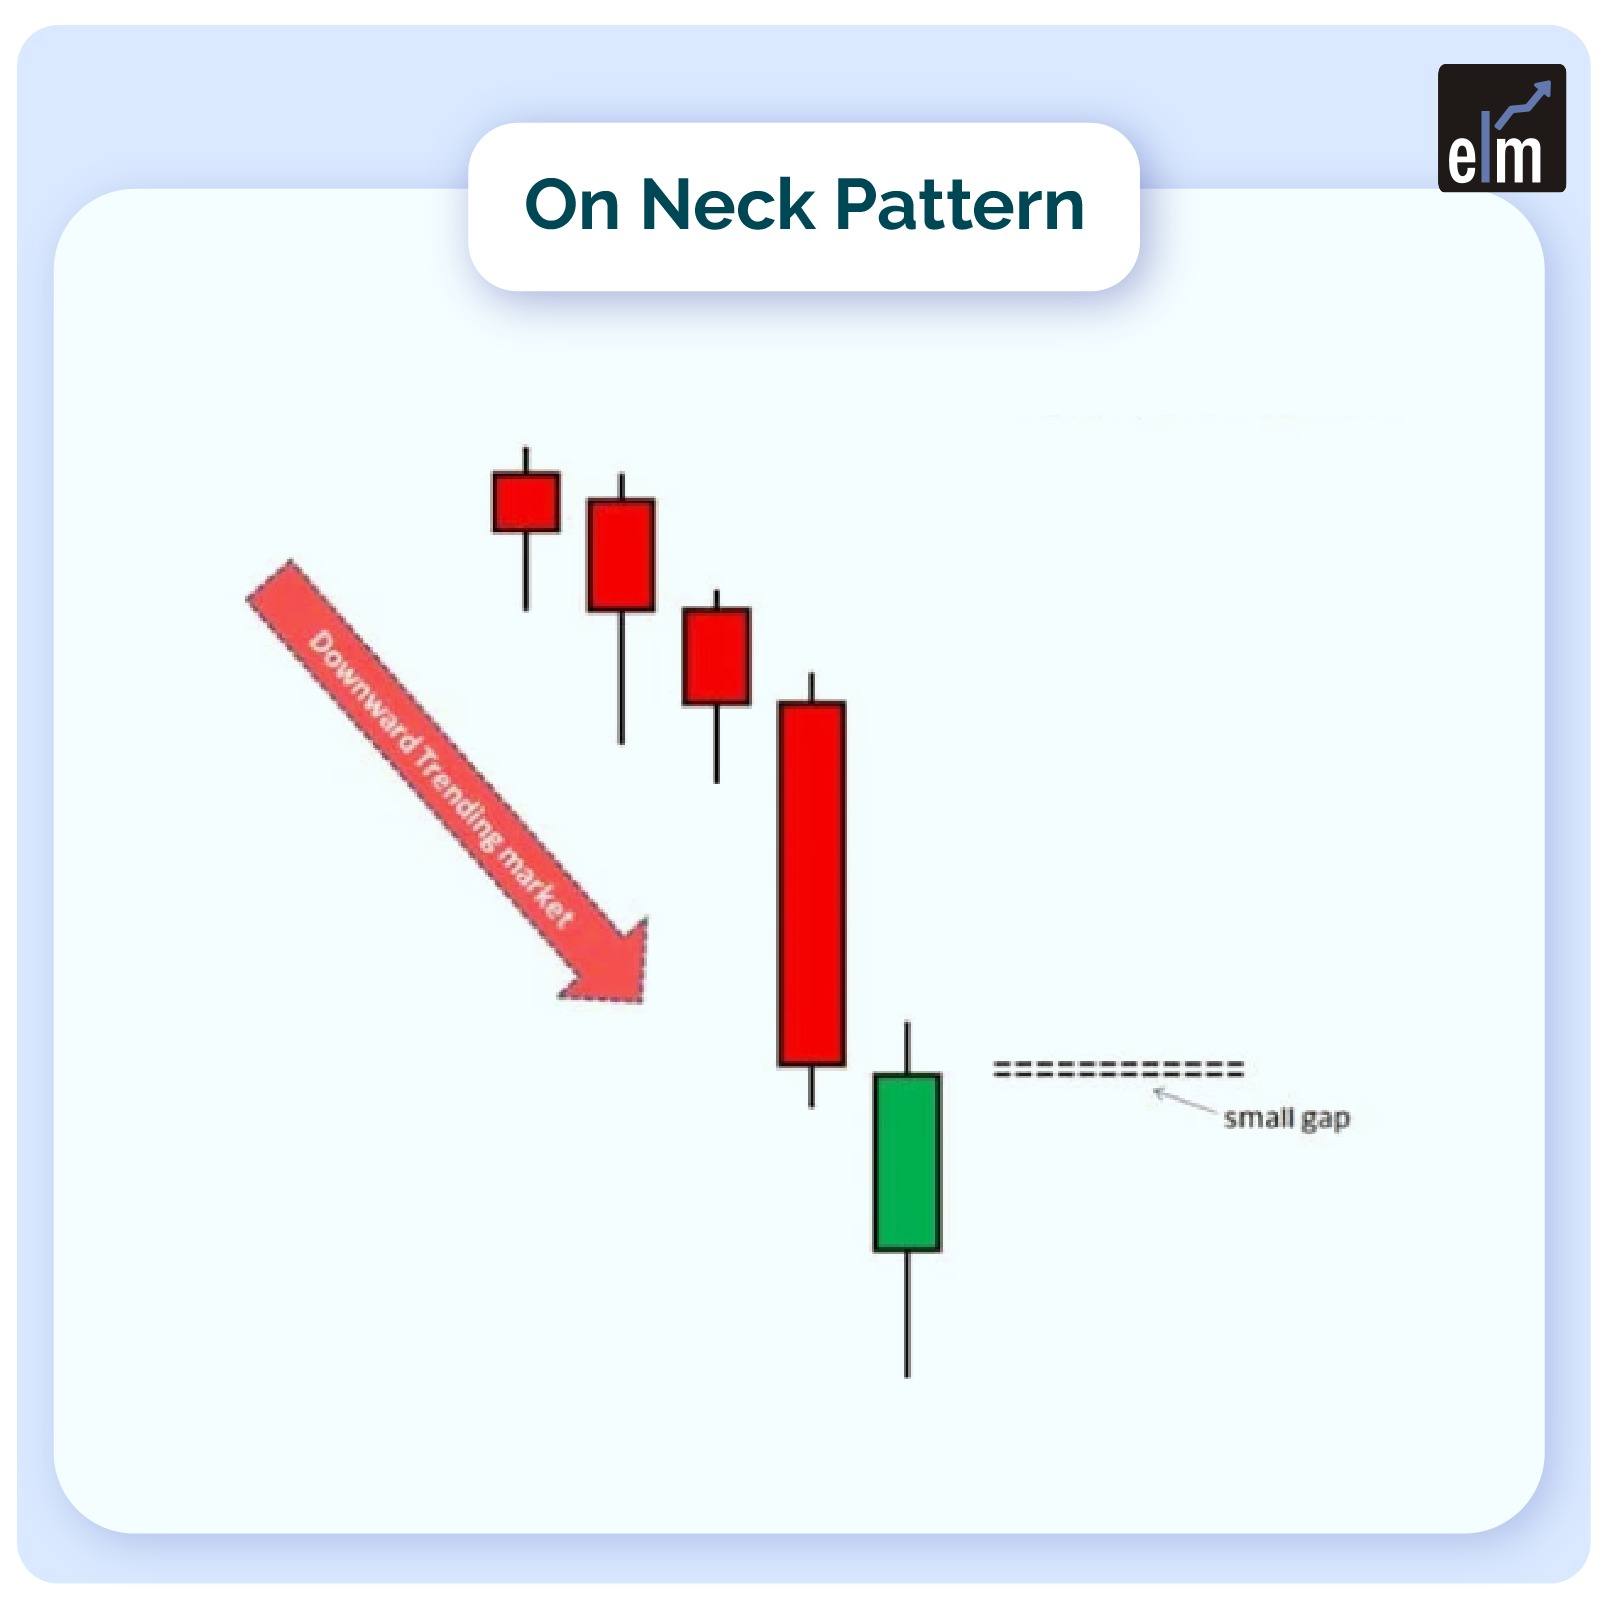
- First, there must be a downward trend going on.
- There must appear a towering black (bearish) candle.
- Finally, the black candle must be followed by a smaller white (bullish) candle.
- The white candle’s close should be virtually identical to the previous candle’s low. Therefore, it should not climb above the low price of the black candle.
- Look for a black candle on the third day to confirm the On Neck pattern and continue the downward trend. A long body, as well as a gap between the second and third days, demonstrate strength.
Trading with On-Neck Candlestick Pattern
The security is in a primary downtrend or a significant correction inside a primary uptrend. A long, black, genuine body is displayed by the first candle. Bearish complacency grows due to weak market action while weakening bulls retreat completely.
On the second candle, the security gaps down and sells off to a new low, but buyers seize control and boost the price back to the preceding close, but not above it. According to the bears, the bulls were unable to drive the price above the previous close.
The bears will seize control of the next few candles, sending the price lower according to the idea. But, as previously stated, this only happens roughly half of the time in actuality.
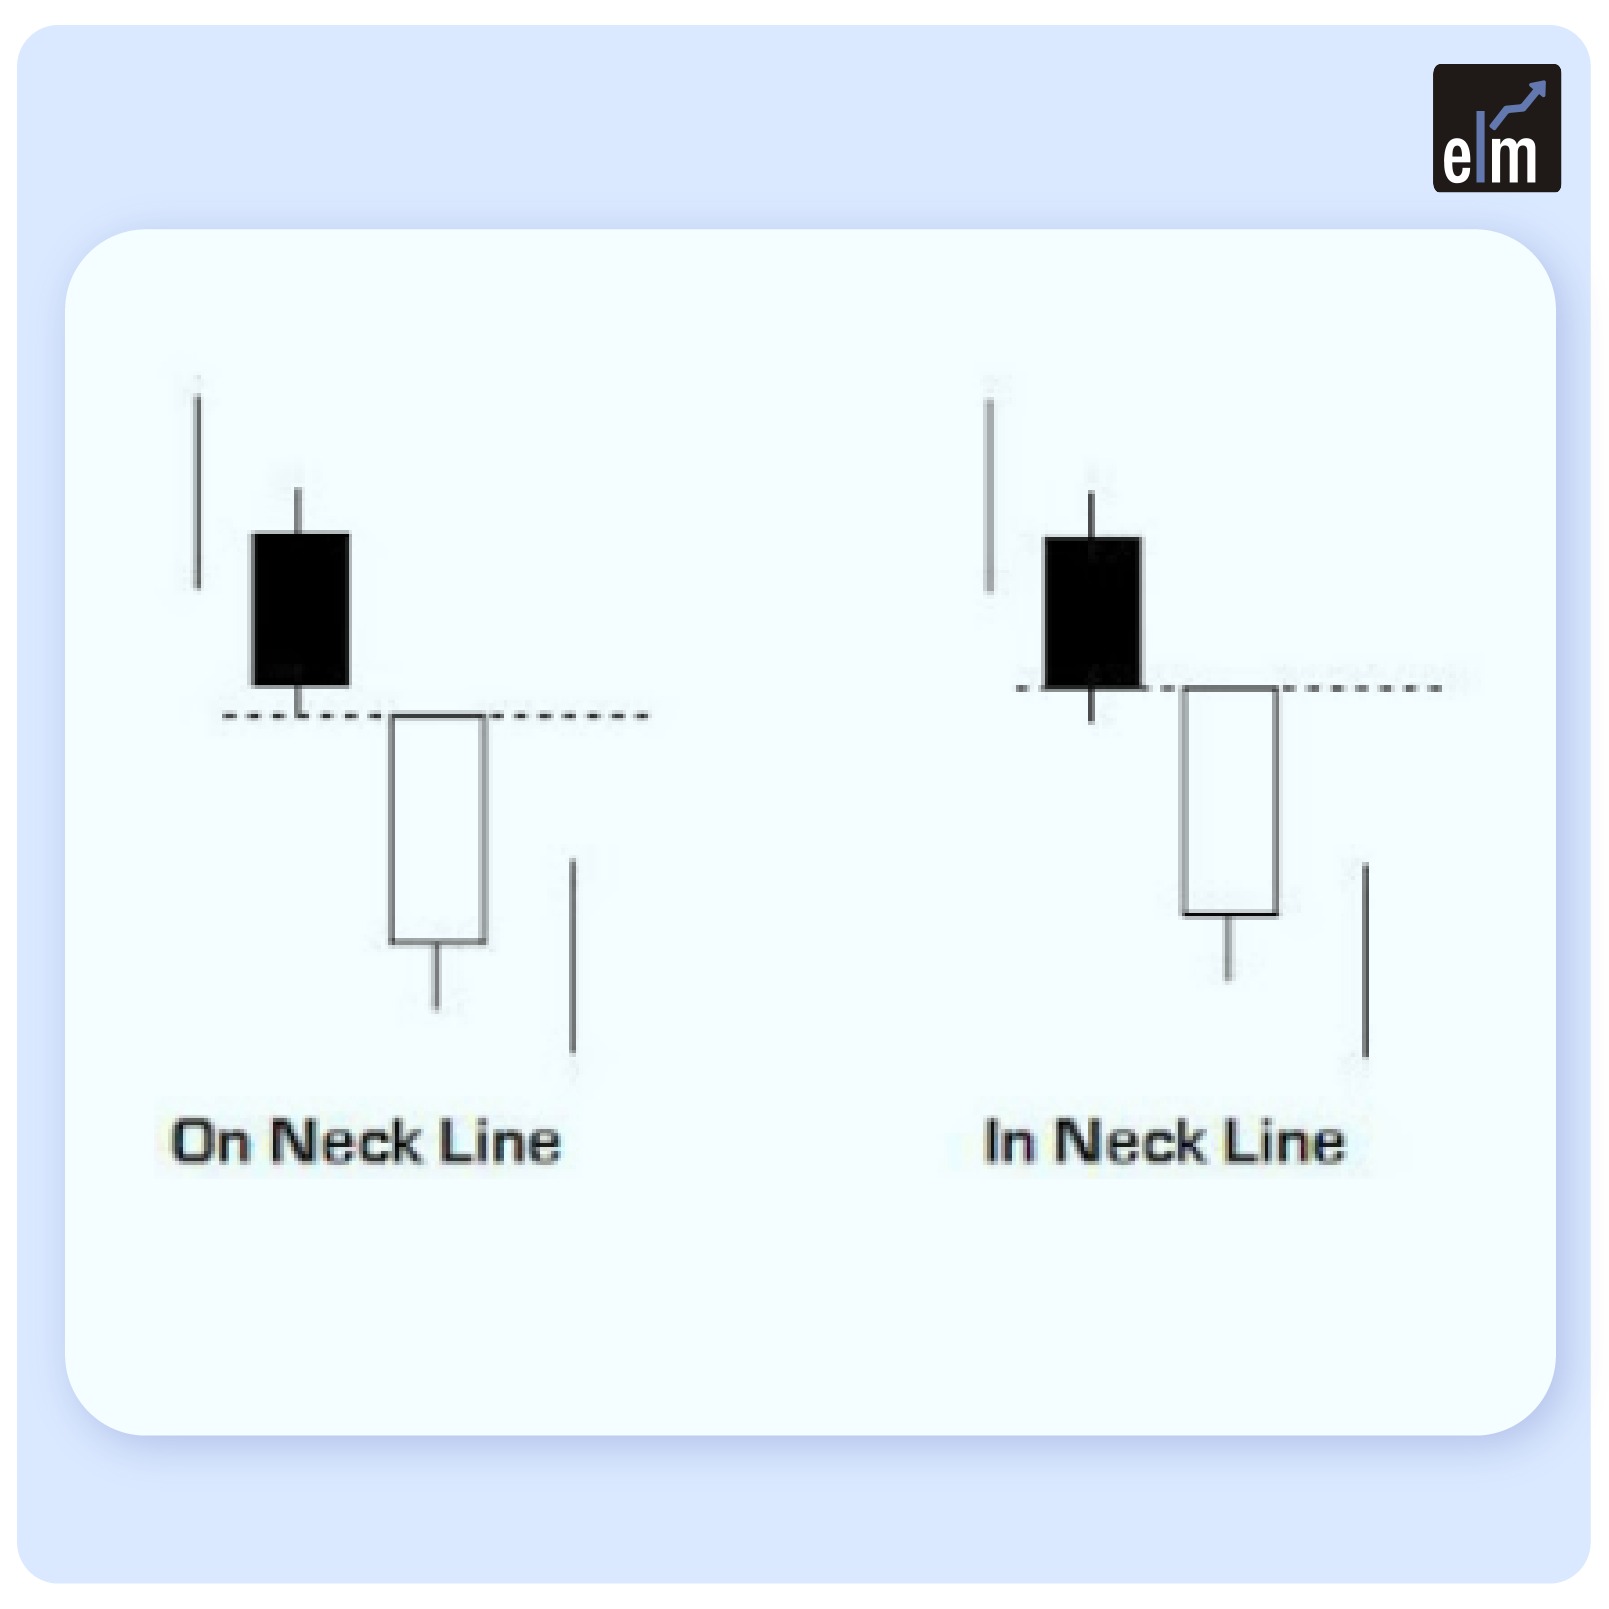
Difference between On-Neck and In-Neck Candlestick Pattern
– The in-neck pattern, which is also a two-line continuation candlestick pattern, is another option. This is also a bearish pattern in a downtrend with the first candle being bearish.
The second candle is a bullish one, with a slightly higher closing price than the prior candle’s closing price. The closing price level shows the distinction between an in-neck and an on-neck candlestick pattern.
– The in-neck pattern indicates that the trend is still bearish and will continue, but it is not as intense or severe as the on-neck candlestick.
– Because the two patterns are so similar, you’ll have to scrutinise them closely to figure out which is which.
Limitations
The price could move higher or lower with about equal probabilities if the pattern is followed. The pattern’s moves to the upside tend to be larger than the pattern’s moves to the downside.

Trading based on the pattern could lead to a variety of outcomes. While a lower breakout is as simple as a dip below the low (or close) of the second candle, the trader must decide whether they consider a move over the high (or close) of the second or first candle to be a higher breakout point.
Because the candlestick pattern lacks an intrinsic profit goal, a mechanism of profit-taking must be established.
The pattern works best when combined with additional technical indicators and procedures for confirmation.
Bottomline
A bearish candle with a lengthy genuine body is followed by a smaller bullish candle that is unable to close above the closure of the bearish candle. This pattern is known as the on-neck pattern, and it happens during a decline or a pullback during an upswing. Any bull candle with a smaller real body than the previous candle, a rickshaw man, or a doji are examples of small bullish candles. However, the closing prices of the two candles should be equal or very close to each other.
Read More- All 35 Candlestick Chart Patterns in the Stock Market
Frequently Asked Questions (FAQs)
What is on Neck Candlestick Pattern?
A decline occurs when this two-candlestick pattern appears. A smaller white (or green) candle that opens lower and closes at or very close to the previous candle’s low follows the longer black (or red) candle in the first place.
What is the Bullish Neckline Pattern?
Bullish necklines are a very uncommon but reliable sign that the current bullish trend will hold. There are two variations of these candlestick patterns: in necklines and on necklines. Nonetheless, there are other similarities between these two distinct patterns in addition to their comparable shapes.
Is the on Neck Candlestick Pattern Bullish or Bearish?
An ongoing downward trend can be reliably predicted by the On Neck candlestick pattern. It is distinguished by two candles: a towering, bearish candle and a shorter, bullish candle. Its importance comes from the second candlestick’s closing price matching the first.


