Key Takeaways:
• High-Wave candlestick has small real body with long upper and lower shadows, showing extreme indecision
• Often forms after strong trends and signals possible reversal or pause in momentum
• Indicates market volatility, where buyers and sellers are aggressively battling without clear direction
• Traders wait for confirmation from the next candle before making any move
• Best used with support/resistance levels or other indicators to improve entry and exit timing
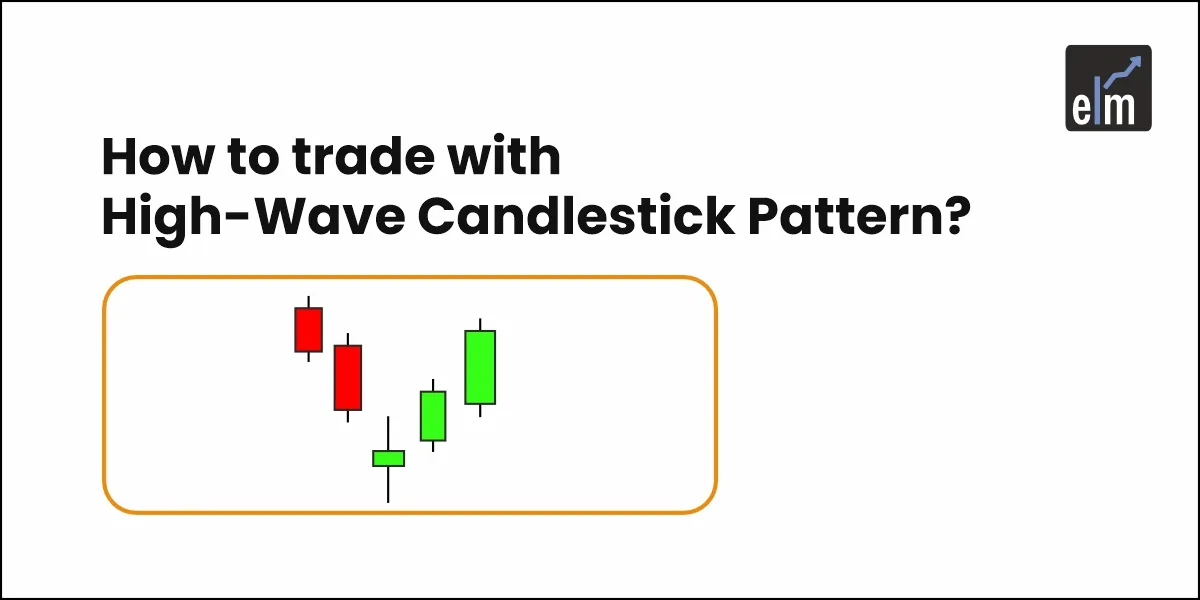
Indecision candlesticks that resemble long-legged Dojis are known as High-wave candlestick patterns. Their lower shadows are lengthy, and their top wicks are long.
They also have a larger physical body. They’re common near support and resistance levels, as well as during periods of consolidation. Bullish or bearish high wave candles are possible.
In today’s blog, we will discuss how to spot high-wave candlesticks and trade them.
What is a High-Wave Candlestick Pattern?
A high-wave candlestick pattern is an indecisive pattern that indicates neither bullish nor bearish market conditions.
It generally happens at the levels of support and resistance. This is where bears and bulls compete to drive the price in a specific direction.
Long lower shadows and long higher wicks are used to show the design of candlesticks. They, too, have little bodies. Long wicks indicate a lot of price movement throughout the period. However, the price eventually settled near the opening level.
In most situations, buyers attempt to raise prices but are met with fierce opposition. Similarly, sellers attempt to cut prices but find fierce opposition.
Both fail to drive price in a specific direction, resulting in the candlestick closing near to where it began.
Formation
The high wave candlestick is a unique type of spinning top basic candlestick with one or two lengthy shadows. The prices at the open and closing are not the same. They differ slightly from one another. The colour of the body has no bearing here. The pattern looks like a long-legged Doji.
The High wave pattern indicates that market changes are rapid, just as most candles have long shadows. This could put the current trend in jeopardy. The significance of the candle, like in so many other examples, is highly dependent on the market setting.
How to interpret this pattern?
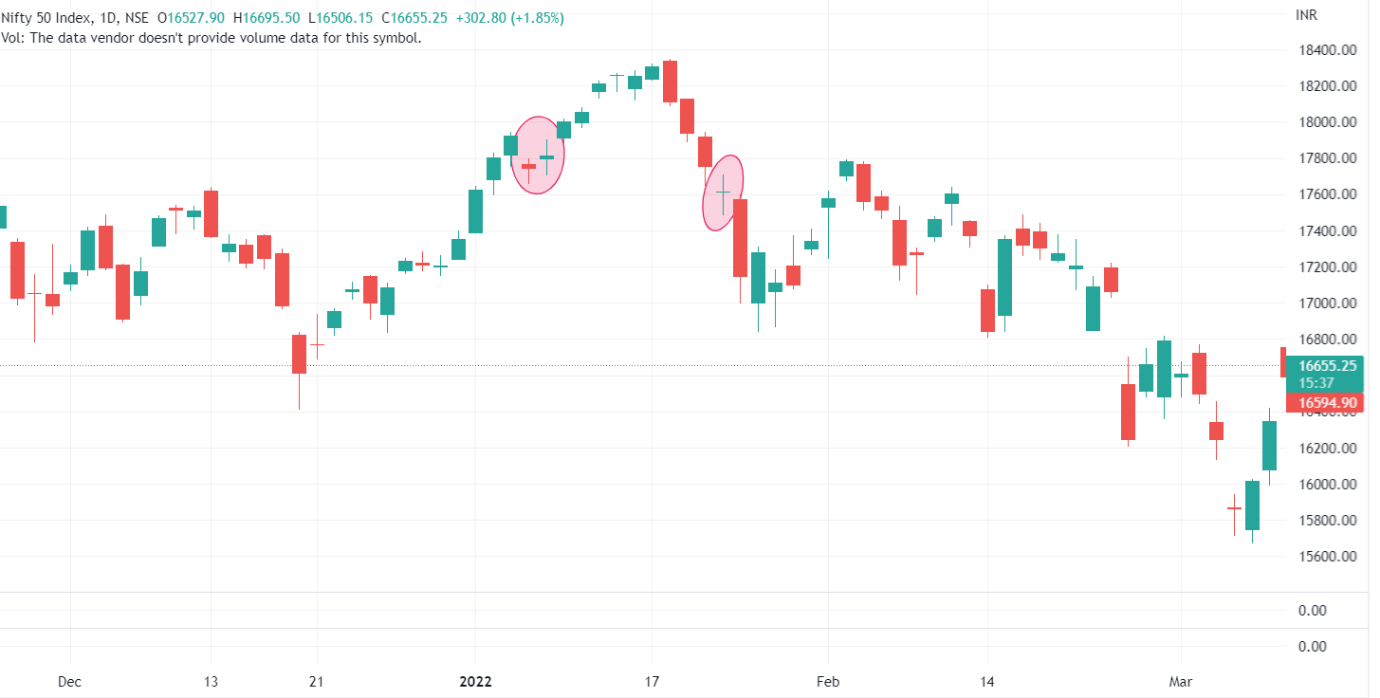
A high-wave candlestick pattern can appear anywhere on the price chart of a stock or currency pair. This High-wave candlestick pattern could be regarded as part of a continuation pattern if it appeared in the middle of a move, either an upward trend or a downward trend.
For example, if a stock is heading up and the high wave candlestick pattern appears, a consolidation could occur. After a few swings, the price of a range’s highs and lows may break out of the range and continue to rise. This we can see from the chart of Nifty 50 below-
If the high wave candlesticks appear in a stock that is going lower, a range may emerge, resulting in a sideways activity.
When the consolidation period ends, the price may break out and continue to fall in line with the long-term decline.

How to trade with this pattern?
Because traders are unsure about a stock’s direction, high-wave candlesticks appear. If you spot such a pattern on a chart, you should usually wait a day or two before entering a trade.
When this occurs, it’s critical to wait for the subsequent candlesticks to form before determining the stock’s direction. As a result, it can be difficult to trade high wave candles at times.
That’s why it’s so important to grasp what candlesticks are revealing. Also, remember to stay patient and let things unfold naturally. You can also learn trading by taking our Candlestick Trading Course.
Bottomline
We hope you found this blog informative and use it to its maximum potential in the practical world. Also, show some love by sharing this blog with your family and friends and helping us in our mission of spreading financial literacy.
Read More- All 35 Candlestick Chart Patterns in the Stock Market
Frequently Asked Questions (FAQs)
What does a High-wave Candle Mean?
An uncertain pattern that denotes neither bullish nor bearish market circumstances is a high wave candlestick pattern. Usually, it takes place at the resistance and support levels. Here, bulls and bears battle to move the price in a particular direction.
What is the Most Accurate Candle Pattern?
Various traders have distinct preferred and most reliable patterns. The most well-liked ones are the long-legged doji, the abandoned baby top and bottom, and the bullish/bearish engulfing lines.


