Key Takeaways:
- Rising Three Method signals bullish continuation with 3 small bearish candles between two strong bullish candles
- Falling Three Method shows bearish continuation with 3 small bullish candles between two strong bearish candles
- Both patterns indicate brief consolidation before the trend resumes
- Entry is considered after the final strong candle confirms the trend
- Works best in strong trending markets with volume support
Rising and Falling Three Method Candlestick Patterns- According to popular belief, long-term investing is the greatest approach to entering the equity markets. A long-term investment is a popular technique, but it is not the only investment method.
Investing money for a short or very short period of time can be profitable if done with the right instruments. The candlestick chart has been established as one of the most useful technical tools for traders of all levels. The colour-coded chart is simple to interpret for both novice and experienced traders.
If correctly interpreted, the red and green candlesticks always tell a story. Let’s look at the story behind a group of five candlesticks known as rising or falling three-method candlestick patterns when arranged in a specific way.
- What is the Rising Three Method Pattern?
- Formation
- How to Trade Using Rising Three Method Pattern?
- What is the Falling Three Method Pattern?
- Formation
- How to Trade Using the Falling Three Method Pattern?
- Bottomline
- Frequently Asked Questions (FAQs)
- What is the Falling Method 3?
- What is the Bullish 3 Method?
- Is the Falling 3 a Reversal Pattern?
What is the Rising Three Method Pattern?
The rising three method is a candlestick pattern that arises during an upward trend and returns to the same path in the following days. It’s a bullish continuation pattern, which means the market is amidst a strong buy-side period, and the trend will likely continue in the foreseeable future.
The rising three method can be viewed in charts for 5 minutes, one hour, intra-day, weekly, and even monthly time periods.
Formation
Five candlesticks make up the rising three method candlestick pattern. The first and fifth are mild — commonly indicated by the colour green. Long bullish candlesticks are present. The second, third, and fifth candlesticks are all dark, with red markings.
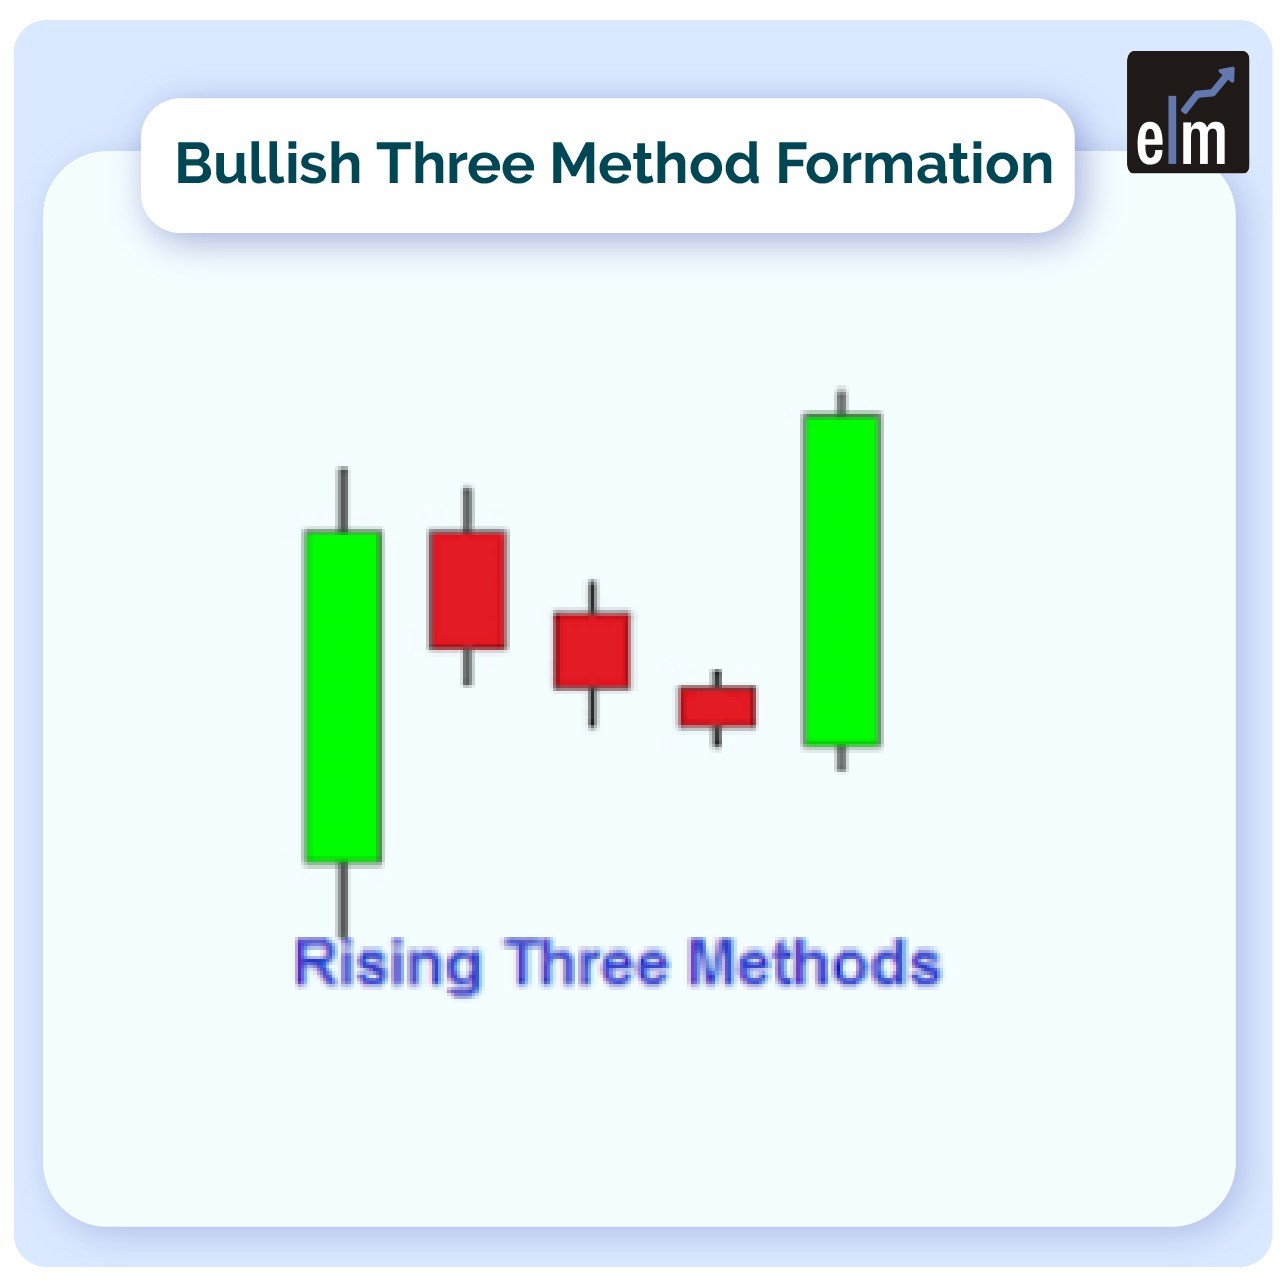
They are bearish candlesticks that are short. The five candlesticks in the diagram above are supposed to represent five trading days in a row. However, as previously said, the rising three method candlestick pattern can arise in any trading time, i.e. it is applicable to both intraday and positional trading.
How to Trade Using Rising Three Method Pattern?
1) An investor can profit by holding their deal or buying more stock if the rising three techniques candlestick pattern is confirmed.
2) The first and second candles in the rising three candlestick pattern could be bullish marubozu candlesticks with no wicks/shadows above and below them. This means that the opening price is the lowest price, and the closing price is the highest price attained during the trading session in question.
3) The fifth candlestick should not break the low of the first candlestick. Furthermore, in the ring three approaches, the fifth’s high should be higher than the first’s high. This means that the bulls have taken control of the market terms for the securities in issue.
4) In the rising three method candlestick pattern, the fifth one should have a larger volume than the first. The second, third, and fourth candlesticks have insignificant volumes.
What is the Falling Three Method Pattern?
The falling three method candlestick formation is part of a bearish trend, indicating that the bears are in charge.
When the bulls begin to take control but cannot entirely overwhelm the bears, the pattern is established. First, it causes a pause in the price’s downward progression, as indicated by the three short green candles.
The bulls, however, are unable to maintain their speed for long and are overtaken by the bears. The long red candle at the end of the pattern completes the pattern by closing below the level of the first long candle.
Formation
The pattern is called the falling three method candlestick pattern, however, it actually has five consecutive candles. The falling three method indicates that a trend is continuing rather than reversing. It’s a bearish pattern that indicates a momentary break in the more significant trend, which in this case is downward.

Many red candlesticks will appear before the construction of a falling three methods candlestick pattern, indicating a bearish price trend.
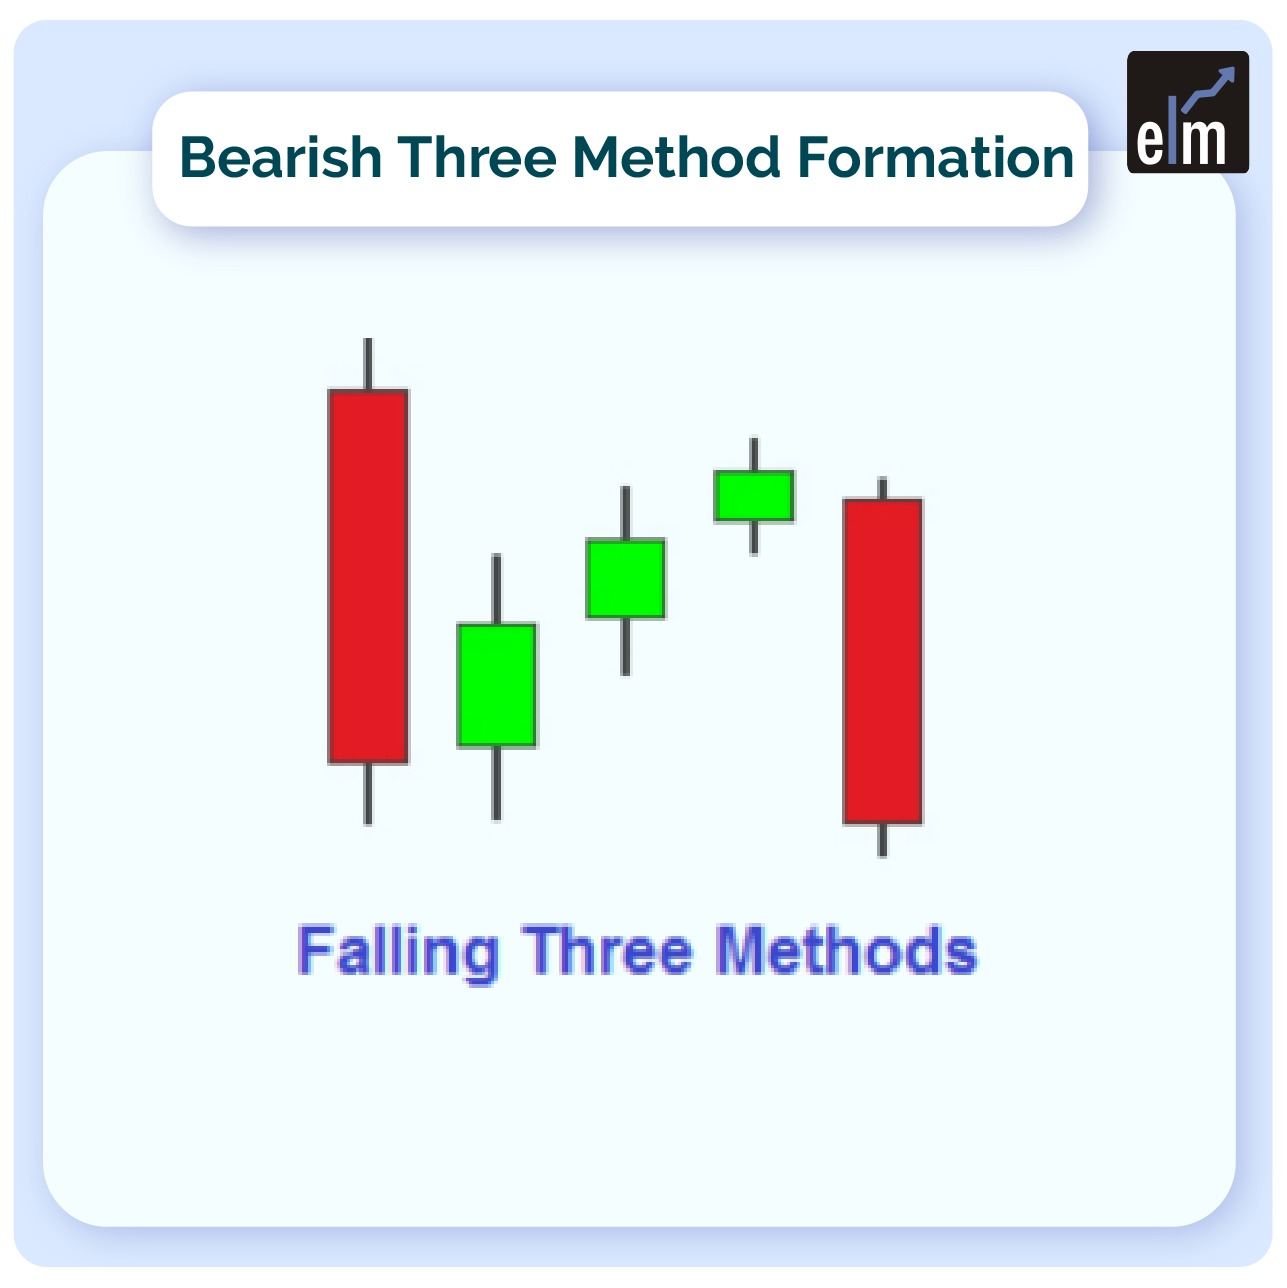
One tall red candle is the first of three falling candlesticks. Three short green candles follow the first candle. The three short candles should be enclosed in the body of the first red candle in a flawless falling three candlestick arrangement.
The three green candles’ real bodies cannot be higher or lower than the real body of the first candle. After the three candles, a long red candle is formed. The ending candle should be lower than the first, indicating a larger bearish trend.
How to Trade Using the Falling Three Method Pattern?
Although the falling three methods is a bearish pattern, it is critical to have extra proof before trading it. You may need to wait for signal confirmation on occasion. The bears assume market control under ideal conditions once the last red candle of the descending three ways is created, but this scenario may alter in active trade.
Even after developing the falling three-candlestick pattern, the market may rise. Therefore, it is preferable to examine five bars following the construction of the pattern before deciding on the next step. It would corroborate the overall trend and reduce the risk of shorting.
Bottomline
We hope you found this blog informative and use it to its maximum potential in the practical world. Also, show some love by sharing this blog with your family and friends and helping us in our mission of spreading financial literacy.
Read More- All 35 Candlestick Chart Patterns in the Stock Market
Frequently Asked Questions (FAQs)
What is the Falling Method 3?
When the bears lose confidence in their ability to drive the stock price further below its current level, the falling three methodologies show a brief reversal of the current downtrend. The trend reverses when the buying volume surpasses the selling volume due to a lack of momentum.
What is the Bullish 3 Method?
There is an uptrend when this pattern appears. Three tiny body bullish candles make up this pattern, which is followed by a bearish candle that opens below the close of the third candle and closes above the open of the first. Three-Method Bearish Formation: During a downward trend, this pattern is seen.
Is the Falling 3 a Reversal Pattern?
The falling three method indicates that a trend is continuing rather than reversing. This pattern is bearish because it suggests a brief halt to the larger trend, which in this case is a downward trend.


