Key Takeaways
- What Three Outside Patterns Indicate: They highlight moments when market sentiment flips sharply, signalling a possible trend reversal backed by strong price action.
- How the Pattern Forms: It develops over three candles—one showing the current trend, the next engulfing it, and the third confirming the new direction.
- Two Clear Variations: Three Outside Up shows buyers gaining control after a downtrend, while Three Outside Down signals sellers taking over after an uptrend.
- Why Candle Size Matters: A stronger and larger engulfing candle often indicates higher conviction behind the reversal, making the pattern more reliable.
- How Traders Use It: It works best with support–resistance, volume, or momentum indicators to reduce false signals, especially in choppy markets.
Three outside patterns represent moments when the market’s direction suddenly shifts. Rather than thinking of these as abstract chart formations, consider them as a three-act story where traders’ psychology flips sentiment changes so dramatically that it creates a visible pattern on your chart.
These patterns emerge from basic market dynamics. A strong move in one direction meets resistance, gets engulfed by the opposite momentum, and then continues in the new direction. Two variations exist depending on whether the reversal flows upward or downward.
So, in today’s blog will discuss these triple candlestick patterns in detail:
What is Three Outside Up Candlestick Pattern?
What Happens
This pattern typically emerges after a downtrend has worn out its energy. It unfolds across three candles:
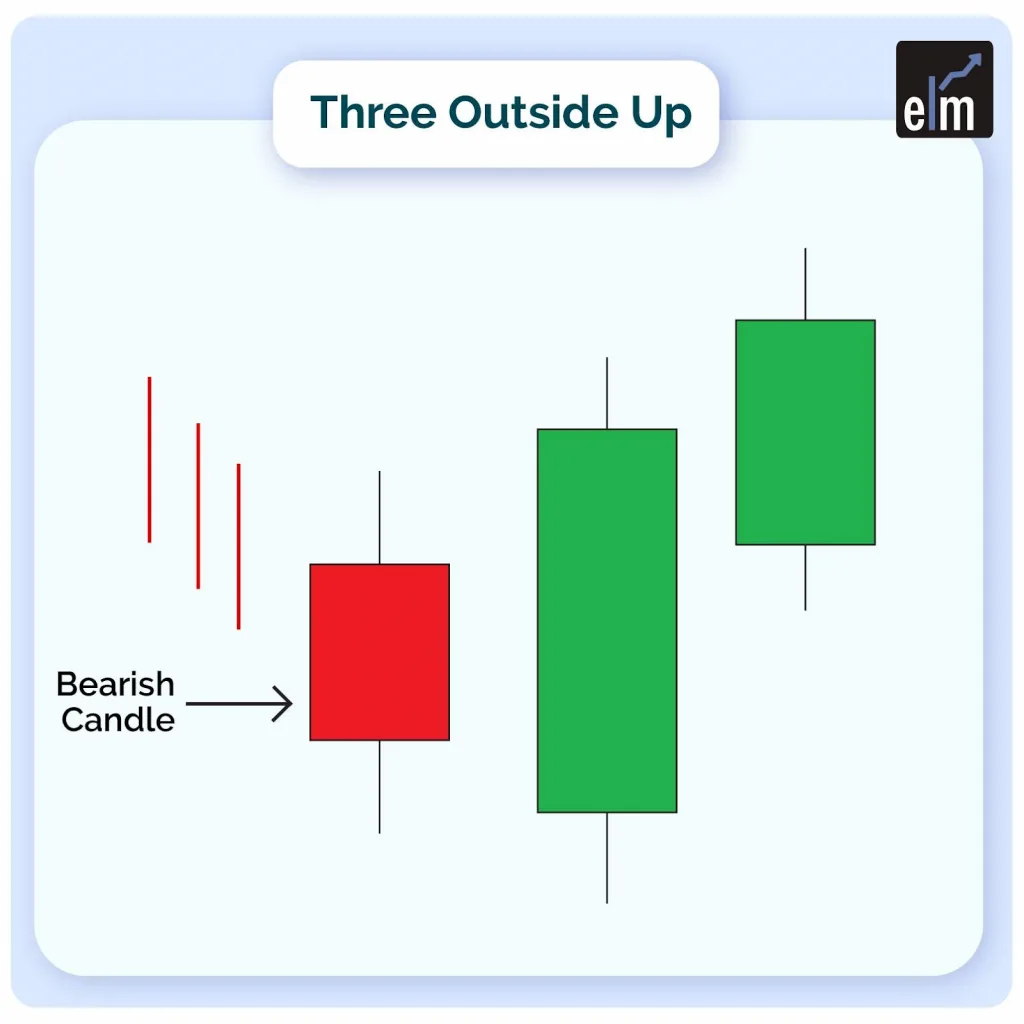
Act One (Bearish Candle): The market drops, reinforcing downward momentum. Sellers are in control, confidence among bears is building. The candle closes lower than it opened, showing sustained selling pressure.
Act Two (Large Bullish Candle): Without warning, buyers flood the market. This candle opens low but reverses sharply, rising so high that it completely contains the previous bearish candle within its body. This is the critical moment—bears get caught off guard as bulls seize control.
Act Three (Higher Bullish Candle): Momentum continues upward. The third candle closes above the second, confirming that the reversal is genuine and not just a false spike. A new high emerges, solidifying bullish sentiment.
Reading the Market Psychology
The first candle maintains the bearish trend and builds bearish confidence through significant selling interest. When the second candle arrives and engulfs it completely, it sends a red flag to bears that those holding short positions face a reversal and should consider taking profits or stopping out.
As price action moves above the first candle’s entire range, bullish outside day candlestick action intensifies. The bulls verify their strength when the third candle reaches a new high, triggering buy signals among technical traders.
Why It Matters
The size of the second candle determines the pattern’s significance. A massive engulfing candle indicates strong buying pressure overwhelming previous sellers. A smaller engulfing candle suggests less conviction in the reversal.
Think of it as a tug-of-war where one team suddenly pulls much harder than expected. The bigger the pull, the clearer the momentum shift.
What Traders Interpret from a Three Outside Up Pattern?
With the closure lower than the open, the first candle maintains the bearish trend, showing significant selling interest and building bear confidence.
The second candle begins lower but quickly reverses, crossing through the first tick in a bullish showing. This price action raises a red flag for bears, signalling that those gains should be taken or stopped because a reversal is possible.
The stock continues to rise, with the price now above the first candle’s range, completing a bullish outside day candlestick. This boosts bullish sentiment and triggers buy signals, verified when the security makes a new high on the third candle.
Trading Example
One of the important characteristics of this technical indicator is that the size of the engulfing candlestick, which is the second of three, determines its power. The three outside up patterns is more prominent the larger the second candle.
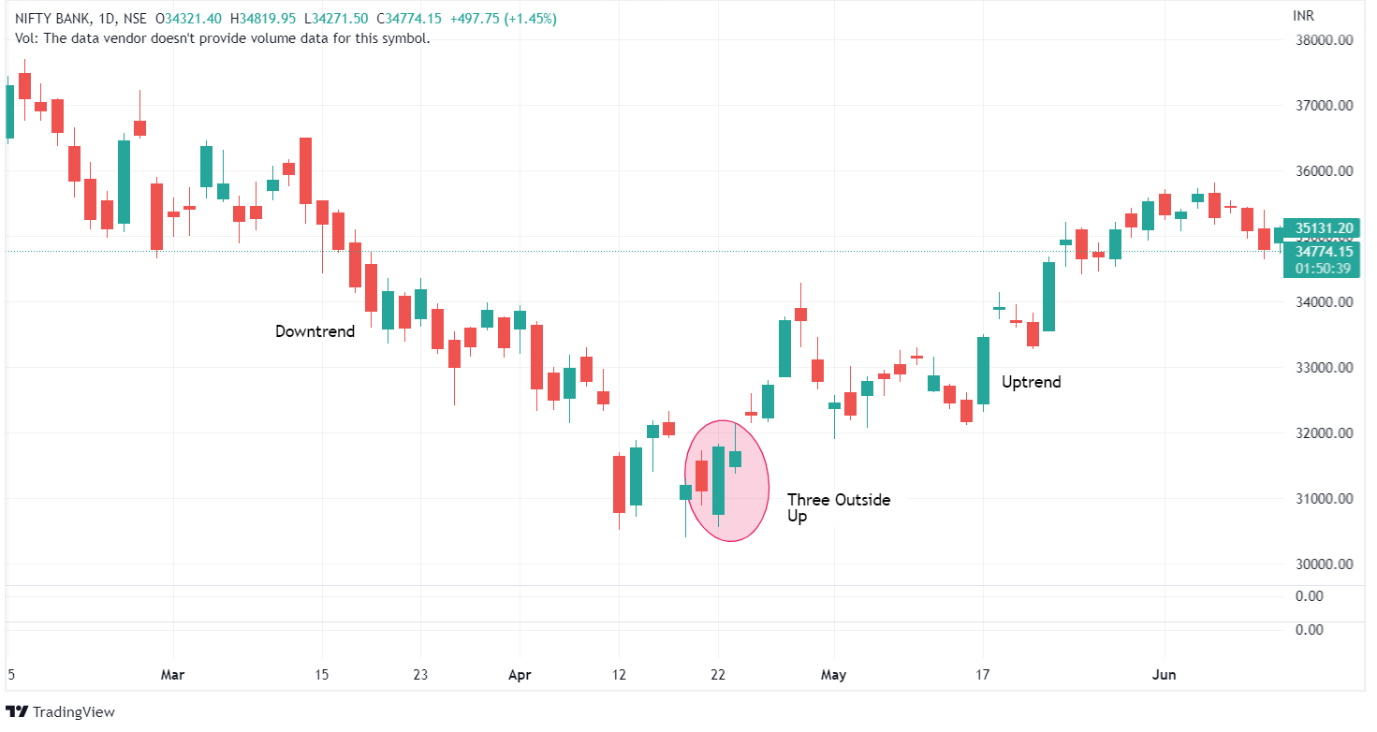
The smaller the negative downtrend becomes, the weaker its indication becomes. As the price movement increases with the second candle, bullish sentiments appear to be outnumbering bearish sentiments.
What is Three Outside Down Candlestick Pattern?
What Happens
This is the inverse pattern, typically appearing after an uptrend has exhausted itself. Again, three candles tell the story:
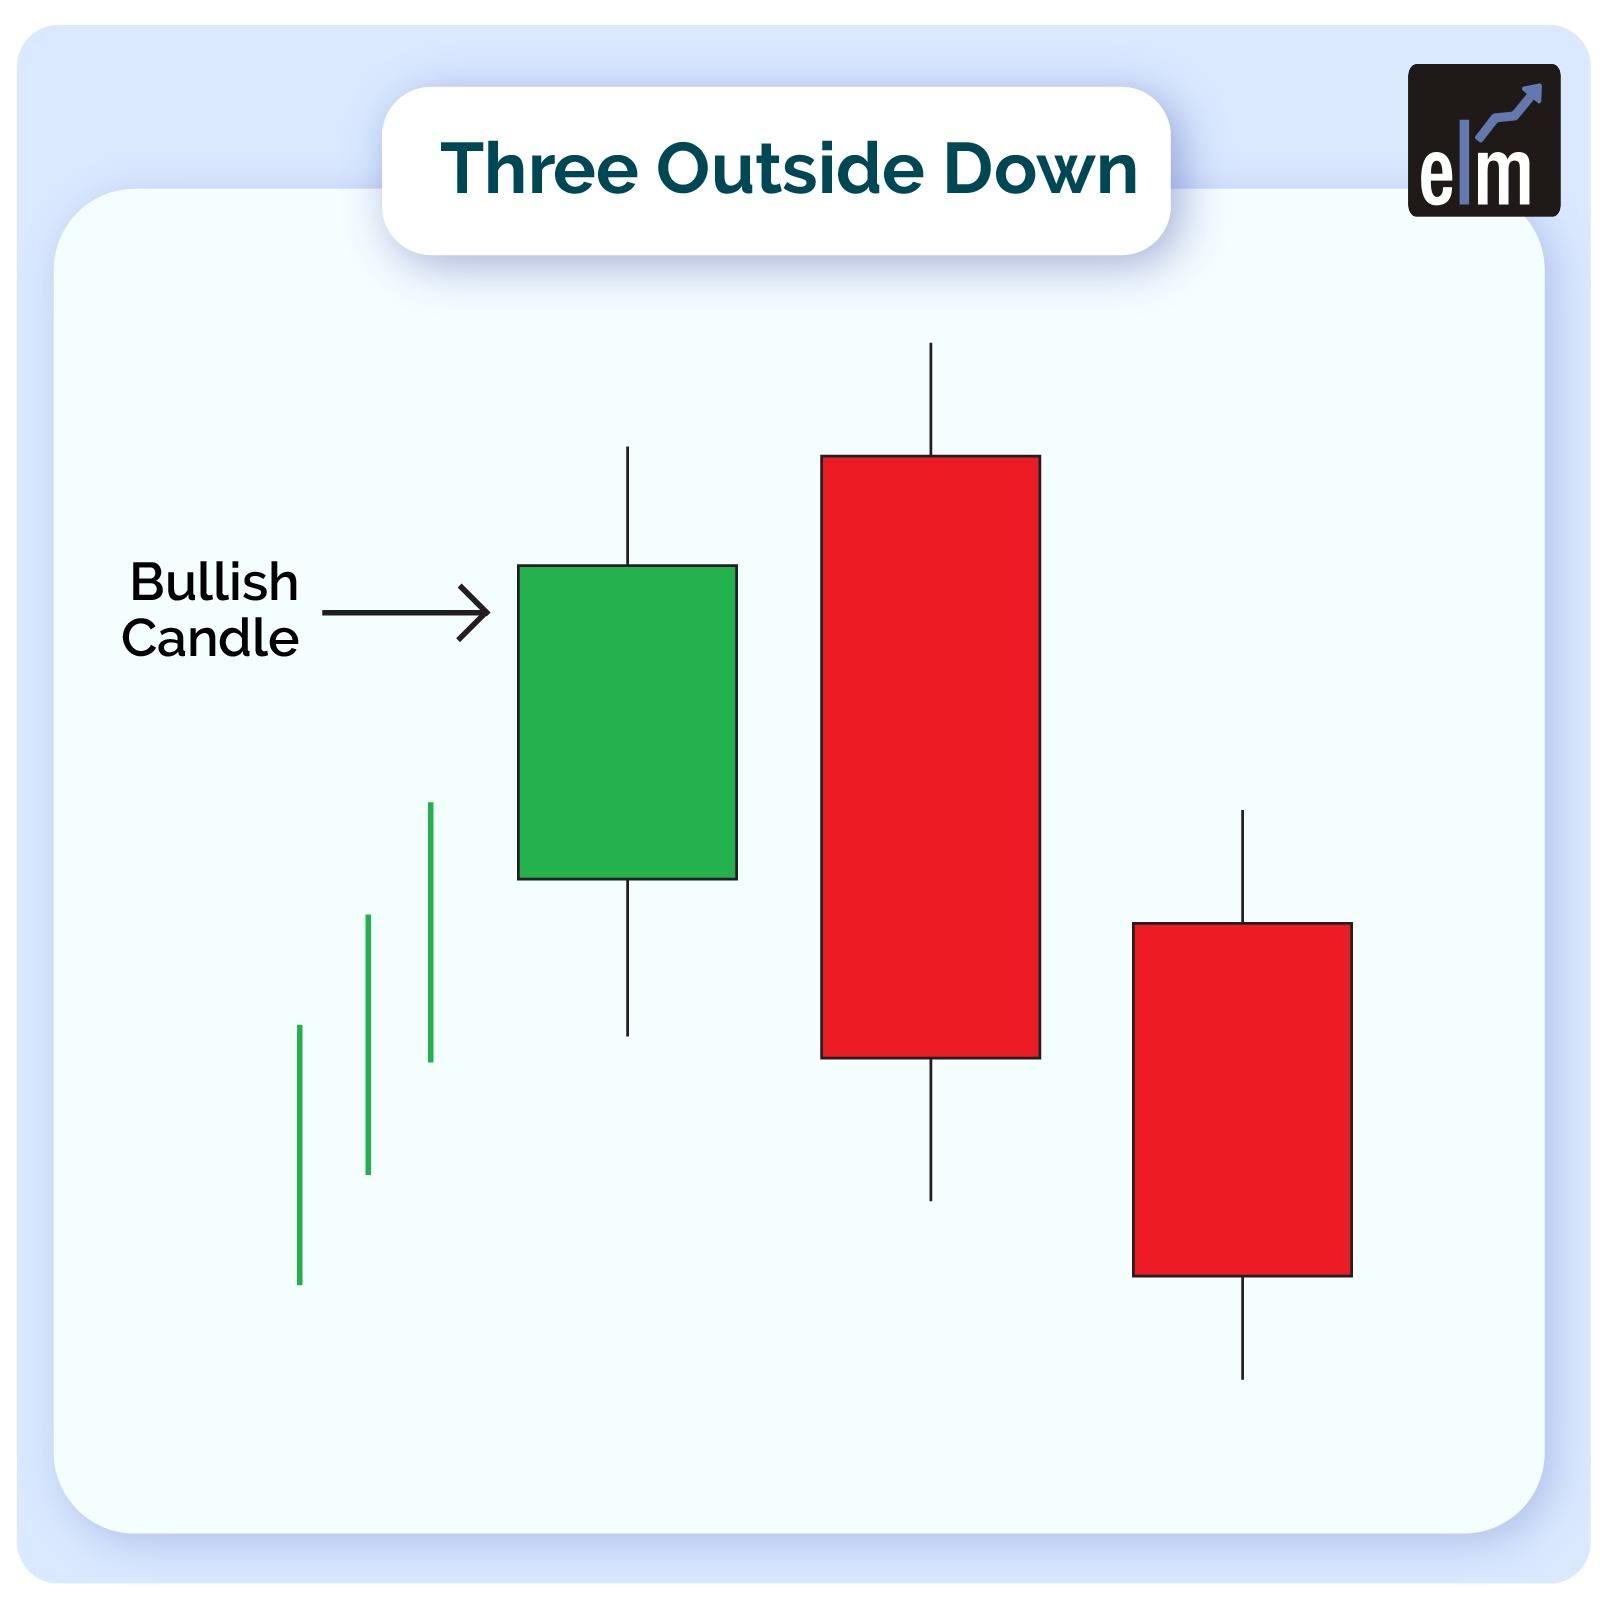
Act One (Bullish Candle): The market rises, maintaining buyer enthusiasm and confidence. The candle closes higher than it opened, reinforcing upward momentum.
Act Two (Large Bearish Candle): Sellers emerge unexpectedly and gain control. This candle opens higher but reverses hard, falling enough to fully engulf the previous bullish candle. The shift is sudden and powerful.
Act Three (Lower Bearish Candle): The decline continues. The third candle closes below the second, confirming that selling pressure has taken over. A new low emerges, cementing bearish control.
Reading the Market Psychology
The first candle maintains the bullish trend and builds bull confidence through significant buying demand. When the second candle arrives and engulfs it completely, it signals a red flag for bulls. Those holding long positions face a reversal and should consider locking in gains or tightening stops.
Just like its counterpart, the power of this pattern depends on how aggressively the second candle reverses. A sweeping bearish candle that engulfs significant bullish price action signals genuine exhaustion among buyers.
What Traders Interpret from a Three Outside Down Pattern?
With the closing higher than the open, the first candle maintains the bullish trend, showing significant buying demand and building bull confidence.
The second candle rises but quickly reverses, crossing through the starting tick in a bearish showing. This price action signals a red flag for bulls, signalling that gains should be taken or tightened because a reversal is possible.
The asset is still losing money, with its price dropping below the first candle’s range, completing a bearish outside day candlestick. These boosts bear confidence and trigger selling signals, verified when the stock makes a new low on the third candle.
Trading Example
As can be seen, the price is strongly going upward, indicating that the bulls have taken control of the market. As a result, the first candle in the pattern closes favourably, following the trend.
The body of the candle, on the other hand, stays modest, which could indicate a slowdown in buying enthusiasm. Finally, the second candle opens ‘gap up,’ indicating the bulls’ attempt to push prices farther higher.

The purchasing enthusiasm has entirely faded at this time, and the bears have entered the market. This rapid surge of sellers in the market flips the market, causing the price to drop. The bears’ grip on the second session is so strong that the second candle’s closing price is lower than the bullish candle’s initial price.

Because of the strong selling pressure, the second candle ends up engulfing the first. The bears ramp up the pace in the third session, with the pattern’s last candle ending in the negative zone.
Practical Considerations for Traders
The three outside pattern works best as a confirmation signal rather than a standalone trade trigger. Market reversals are significant events, so relying solely on one pattern can be risky. Effective traders typically combine these observations with other technical signals, support and resistance levels, volume confirmation, or momentum indicators to increase confidence before acting.
The timing of these patterns matters too. In choppy, sideways markets, they may be false signals. In clear trending markets, they’re more reliable indicators of actual directional change. The conviction behind the pattern also matters: stronger patterns show more decisive sentiment shifts.
1. The market must be uptrend for a three outside down pattern to appear.
2. The pattern’s first candle will be white, signifying an uptrend.
3. A large black candle will be formed next. It will be long enough for the first white candle to be completely contained within its true body.
4. The third and final candle, which indicates three outside down, must also be black. This candle, however, should close higher than the second candle. This shows that the uptrend is changing direction.
You can also use technical scans to filter out stocks for trading using StockEdge
Read More- All 35 Candlestick Chart Patterns in the Stock Market
Bottom Line
Three outside patterns offer a structured way to recognize when the market’s psychology is shifting. They’re not predictive magic—they’re a visual record of when enough traders changed their minds at the same moment. When combined with broader market context and additional technical analysis, they become a useful tool for identifying potential reversals worth trading. Remember: the stronger the engulfing candle and the clearer the initial trend, the more weight you can give these patterns in your trading decisions.
Frequently Asked Questions (FAQs)
1. What is a Three Outside candlestick pattern?
A three outside pattern is a three-candle reversal signal consisting of a single directional candle followed by two candles of the opposite color. In a Three outside up candlestick pattern, a bearish candle is followed by two bullish candles that completely engulf the first candle, with the final candle closing higher. The pattern signals a shift from downtrend to uptrend. The inverse holds for three outside down candlestick patterns.
2. What is the 3 Gap Rule?
The three gaps rule refers to different patterns involving gaps (price jumps between candle sessions). The Rising Three Gaps pattern forms when three gaps appear upward, separated by rising candles during an ongoing uptrend. The Falling Three Gaps pattern forms when three gaps appear downward, interspersed with falling candles during an ongoing downtrend. These patterns are distinct from three outside patterns and signal trend continuation rather than reversal.
3. How reliable are these patterns for predicting reversals?
Three outside patterns are reasonably reliable indicators when they appear in clearly established trending markets. Their effectiveness increases significantly when confirmed by other technical signals, volume spikes, support and resistance levels, or momentum indicators. Using them as your sole trading signal is risky. Many false signals occur in sideways or choppy markets where conviction is weak.
4. Does the size of the second candle really matter that much?
Absolutely. A larger engulfing candle (the second one) indicates stronger buying or selling pressure. It demonstrates more decisive sentiment change and suggests the reversal has genuine force behind it. A smaller engulfing candle signals weaker conviction in the reversal. When evaluating pattern strength, the size of that middle candle is one of your best clues about how serious the reversal might be.
5. How does pattern strength relate to the size of the downtrend?
The weaker the initial trend before the reversal pattern appears, the less significant the pattern becomes. If a small downtrend is followed by a Three outside up candlestick pattern, it’s less impactful than when a strong, extended downtrend suddenly reverses with the same pattern. The strength of the pattern correlates with how much buying enthusiasm appears during the second candle as price movement increases; bullish sentiment appears to be overpowering bearish sentiment more decisively.
6. Can these patterns appear in all timeframes?
Yes. You’ll find three outside patterns on daily, weekly, hourly, or even minute charts. However, they tend to be more reliable on longer timeframes because they involve more significant price moves and represent more meaningful sentiment shifts. On very short timeframes, false signals become more common, and the patterns may be too noisy to trade effectively.
7. What’s the key difference between three outside patterns and regular engulfing patterns?
Engulfing patterns involve just two candles, a candle that gets completely engulfed by the next one. Three outside patterns require that essential third candle to continue in the reversal direction, confirming that the reversal has actual momentum behind it rather than being a temporary spike. The third candle’s confirmation is what separates a potential reversal signal from a more reliable one.


