Elearnmarkets - Financial Market Learning
  • Categories
    • Basic Finance
    • Derivatives
      • Futures
      • Options
    • Financial Planning
    • Fundamental Analysis
    • Technical Analysis
    • Marketshala
    • Miscellaneous
  • Language
    • English
    • Hindi
    • Bengali
No Result
View All Result
  • Courses
  • Webinars
  • Stories
Elearnmarkets - Learn Stock Market, trading, investing for Free
No Result
View All Result
Home Technical Analysis
Evening Star Pattern - Formation, Example, Pros & Cons 1

Evening Star Pattern – Formation, Example, Pros & Cons

Elearnmarkets by Elearnmarkets
August 23, 2023
in Technical Analysis
Reading Time: 5 mins read
0
18.9k
VIEWS
Share on FacebookShare on XShare on WhatsApp

The Evening Star pattern is a candlestick pattern that appears at the end of the uptrend and signals that a downtrend is going to take place.

Whereas, The Morning Star is a candlestick pattern that appears at the end of the downtrend and signals upside reversal.

Traders should be aware of these different trading patterns, and the Evening Star is an important one to pay attention to.

As the Evening Star indicates that the uptrend is going to end, the appearance of it is a red flag to traders and gives a sign that it is time to book profits.

In this blog, we will understand the formation of the Evening Star pattern and will also explain how to trade it properly. 

Table Of Contents
  1. What is the Evening Star Candlestick Pattern?
  2. Formation of Evening Star Candlestick Pattern:
  3. Trading Example:
    • Learn to Trade Better with Candlesticks in just 2 hours by Market Experts
  4. Evening Star Doji:
  5. What are the pros and cons of evening star candlesticks?
  6. Key Takeaways:

What is the Evening Star Candlestick Pattern?

An Evening Star is a candlestick pattern that is used by technical analysts for analyzing when a trend is about to reverse.

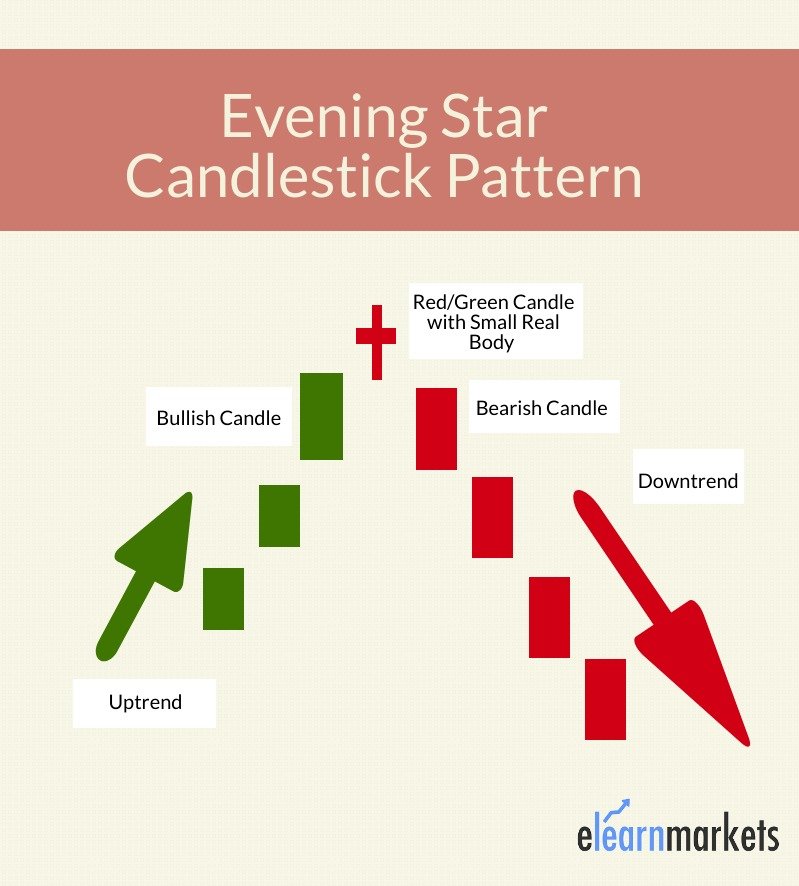
It consists of three candlesticks: a large bullish candlestick, a small-bodied candle, and a bearish candlestick.

Evening Star patterns appear at the top of a price uptrend, signaling that the uptrend is going to end.

The morning Star pattern is the opposite of the Evening Star which indicates a bullish reversal.

Formation of Evening Star Candlestick Pattern:

Here is the formation of the Evening Star Candlestick Pattern:

Evening Star Candlestick

Trading Example:

One can identify this candlestick pattern by the formation of below four candlesticks:

  • Small bearish or bullish candle: The second one is a small candle that indicates that there is uncertainty and shows the signs of a slowing uptrend.
  • Large bearish candle: This signals selling pressure by the bears.

Learn to Trade Better with Candlesticks in just 2 hours by Market Experts

We can see that the Evening Star pattern is formed in the Nifty 50 chart below.

RelatedPosts

5 Important Volatility Indicators that Traders should know 3

5 Important Volatility Indicators that Traders should know

September 19, 2023
57.7k
Top 5 Momentum Indicators that Analyses Trend Strength 4

Top 5 Momentum Indicators that Analyses Trend Strength

September 7, 2023
93k
5 important roles of Relative Strength Index (RSI) 5

5 important roles of Relative Strength Index (RSI)

September 11, 2023
41.2k
Evening Star Pattern - Formation, Example, Pros & Cons 2

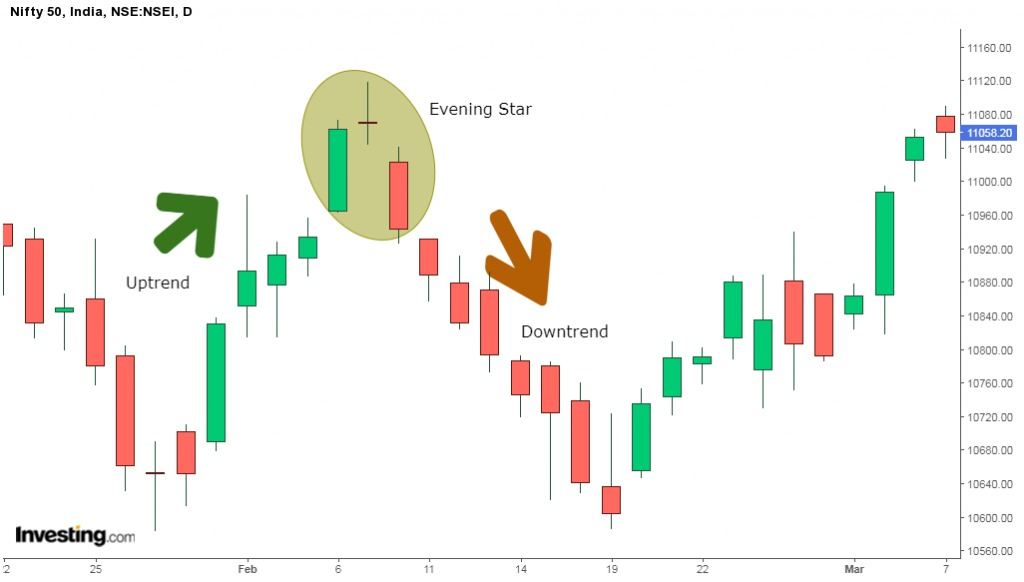
Once the formation of the candlestick has been completed, traders can enter a sell position at the opening of the next bearish candle

The traders can place their targets at previous levels of support or consolidation. 

Also Read – How to Trade with Bullish and Bearish Engulfing Patterns

One can place a stop loss above the recent swing high.

One should note that traders should always maintain a positive risk-to-reward ratio.

Evening Star Doji:

Evening Doji Stars are formed when the market opens and closes at the same or almost the same level.

This indecision candlestick pattern helps the traders to give a red flag and thus prevent further buying.

The formation of the bearish candle after the Doji signals the bearish confirmation.

To know about other candlesticks, read our blog on All 35 Candlestick Chart Patterns in the Stock Market-Explained

What are the pros and cons of evening star candlesticks?

This candlestick pattern has both pros and cons.

Evening Star pattern occurs frequently in the charts and it also presents well-defined entry as well as exit levels.

This candlestick pattern is also easy to identify as they occur frequently in the charts.

But one should also note that if it signals a failed reversal, then the price could move further up.

When the evening star pattern is backed up by volume and other technical indicators like resistance level, then it confirms the signal.

Key Takeaways:

  • Evening Star is a candlestick pattern appearing at the end of the uptrend and signals that an uptrend is going to take place
  • It is a bearish candlestick pattern that consists of three candles: a large bullish candlestick, a small-bodied candle, and a bearish candle.
  • Evening Star pattern occurs frequently in the charts and it also presents well-defined entry as well as exit levels.
  • When the evening star pattern is backed up by volume and other technical indicators like resistance level, then it confirms the signal.

Happy Learning!

Discover profitable trading strategies with advanced Scans from StockEdge.

Tags: candlestick beginners guidecandlestick patternenglishevening doji starevening star candlestickevening star patterntechnical basics
Share3TweetSend
Get Kotak Offer Get Kotak Offer Get Kotak Offer
Previous Post

Working Capital Meaning – Ratio, Example, Formula & Cycle

Next Post

How to Invest your extra Savings during Coronavirus Pandemic?

Elearnmarkets

Elearnmarkets

Elearnmarkets (ELM) is a complete financial market portal where the market experts have taken the onus to spread financial education. ELM constantly experiments with new education methodologies and technologies to make financial education effective, affordable and accessible to all. You can connect with us on Twitter @elearnmarkets.

Related Posts

5 Important Volatility Indicators that Traders should know 6
Technical Analysis

5 Important Volatility Indicators that Traders should know

September 19, 2023
57.7k
Top 5 Momentum Indicators that Analyses Trend Strength 7
Technical Analysis

Top 5 Momentum Indicators that Analyses Trend Strength

September 7, 2023
93k
5 important roles of Relative Strength Index (RSI) 8
Technical Analysis

5 important roles of Relative Strength Index (RSI)

September 11, 2023
41.2k
NR4 and NR7 Trading Strategy Setup 9
Technical Analysis

NR4 and NR7 Trading Strategy Setup

September 14, 2023
82.3k

Leave a Reply Cancel reply

Your email address will not be published. Required fields are marked *

Elearnmarkets Logo

Follow Us

Facebook-f Twitter Instagram Linkedin-in Youtube Telegram

Register on Elearnmarkets

Continue your financial learning by creating your own account on Elearnmarkets.com

Register Free Account

Download App

Playstore logo
Download on app store

Categories

  • Basic Finance
  • Derivatives
  • Financial Planning
  • Fundamental Analysis
  • Technical Analysis
  • Marketshala
  • Miscellaneous

Popular On Elearnmarkets

  • Market Superheroes:
  • Vivek Bajaj
  • Chetan Panchamia
  • Ashish Kyal
  • Premal Parekh
  • Abhijit Paul
  • Jegan
  • Sivakumar Jayachadran
  • Vishal Malkan
  • Jyoti Budhia
  • Vivek Gadodia
  • Vishal Mehta
  • Piyush Chaudhry
  • Santosh Pasi
  • Gomathi Shankar
  • Market Superheroes:
  • Vivek Bajaj
  • Chetan Panchamia
  • Ashish Kyal
  • Premal Parekh
  • Abhijit Paul
  • Jegan
  • Sivakumar Jayachadran
  • Vishal Malkan
  • Jyoti Budhia
  • Vivek Gadodia
  • Vishal Mehta
  • Piyush Chaudhry
  • Santosh Pasi
  • Gomathi Shankar
  • Courses:​
  • Options Trading
  • Dow Theory
  • Momentum Trading
  • Stock Investing
  • Stock Market for Beginners
  • Harmonic Chart Patterns
  • Algo Trading
  • Elliot Wave Theory
  • Advanced Excel
  • Cryptocurrency
  • NSE Certification Course
  • Courses:​
  • Options Trading
  • Dow Theory
  • Momentum Trading
  • Stock Investing
  • Stock Market for Beginners
  • Harmonic Chart Patterns
  • Algo Trading
  • Elliot Wave Theory
  • Advanced Excel
  • Cryptocurrency
  • NSE Certification Course
  • Webinars:
  • Bank Nifty Scalping
  • Intraday Trading Strategies
  • Options Trading Strategies
  • Options selling
  • Price Action
  • Relative Strength
  • Tax Planning
  • Options Buying
  • Growth Stocks
  • Portfolio Management
  • Relative Strength Index
  • Risk Management
  • Renko Charts
  • Crude Oil
  • Traders Psychology
  • Moving Average
  • Multibagger Stocks
  • Free Learning Modules:
  • Intraday Trading
  • Options Scalping
  • Swing Trading
  • Financial Modelling
  • RSI Indicator
  • Bollinger Bands
  • Pricing of Futures
  • Personal Finance
  • Initial Public Offerings (IPO)
  • Value Investing
  • Technical Indicators
  • Candlesticks
  • Chart Patterns
  • Option Greeks
  • ELSS Funds
  • Banking and Insurance
  • Real Estate
  • Gold
  • Book Summaries:
  • Rich Dad Poor Dad
  • Psychology of Money
  • The Intelligent Investor
  • The Richest Man in Babylon
  • Think and Trade Like a Champion
  • Value Investing and Behavioural Finance
  • Trading in the Zone
  • Learn to Earn
  • Book Summaries:
  • Rich Dad Poor Dad
  • Psychology of Money
  • The Intelligent Investor
  • The Richest Man in Babylon
  • Think and Trade Like a Champion
  • Value Investing and Behavioural Finance
  • Trading in the Zone
  • Learn to Earn
  • Tools:
  • CAGR Calculator
  • SIP Calculator
  • eLearnOptions
  • Future Value Calculator
  • Present Value Calculator
  • Atal Pension Yojana
  • Cost of Delay Calculator
  • Become a Crorepati
  • Tools:
  • CAGR Calculator
  • SIP Calculator
  • eLearnOptions
  • Future Value Calculator
  • Present Value Calculator
  • Atal Pension Yojana
  • Cost of Delay Calculator
  • Become a Crorepati

© 2023 Elearnmarkets. All Rights Reserved

  • Visit Elearnmarkets
  • Courses
  • Webinars
  • Financial Guides
  • Get Free Counselling
  • Visit Elearnmarkets
  • Courses
  • Webinars
  • Financial Guides
  • Get Free Counselling

Get Elearnmarkets App

No Result
View All Result
  • Article Categories
    • Basic Finance
    • Derivatives
    • Financial Planning
    • Fundamental Analysis
    • Technical Analysis
    • Marketshala
    • Miscellaneous
  • Language
    • Hindi
    • Bengali
    • English
  • Courses
  • Webinars
  • Stories

© 2020 Elearnmarkets All Rights Reserved

View Course Details