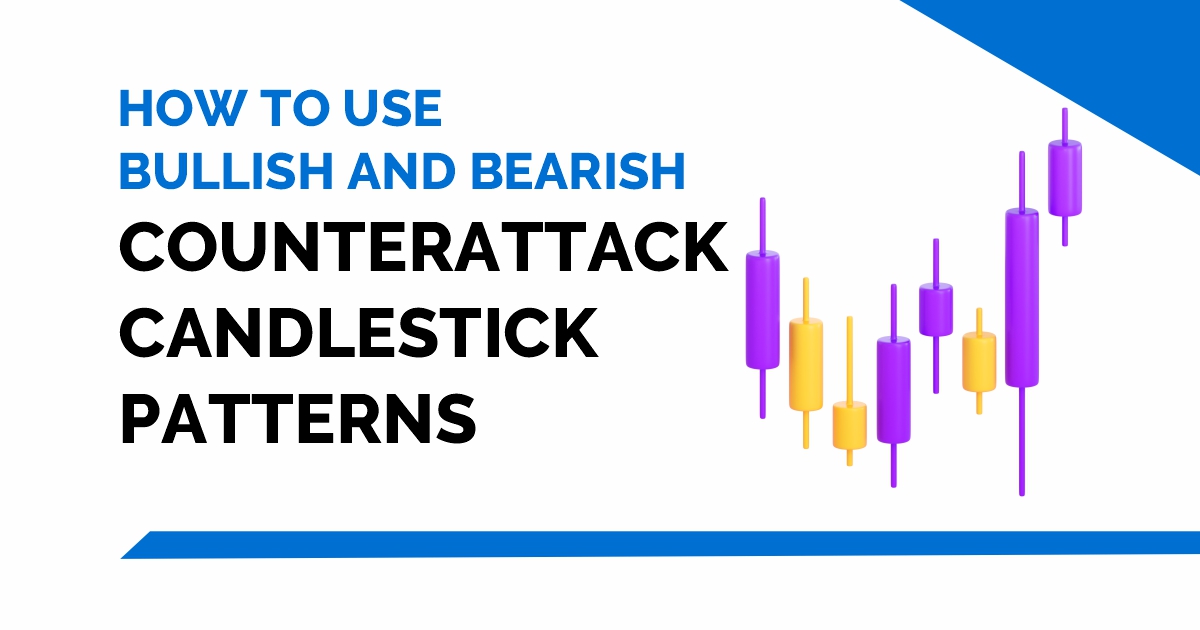
Elearnmarkets - Financial Market Learning
  • Categories
    • Basic Finance
    • Derivatives
    • Financial Planning
    • Fundamental Analysis
    • Technical Analysis
    • Marketshala
    • Miscellaneous
  • Language
    • English
    • Hindi
    • Bengali
No Result
View All Result
  • Courses
  • Webinars
  • Learn On Elearnmarkets
Elearnmarkets - Learn Stock Market, trading, investing for Free
No Result
View All Result
Home Technical Analysis
How to use Bullish and Bearish Counterattack Candlestick Patterns 1

How to use Bullish and Bearish Counterattack Candlestick Patterns

Elearnmarkets by Elearnmarkets
August 11, 2022
in Technical Analysis
Reading Time: 5 mins read
0
11.2k
VIEWS
Share on FacebookShare on TwitterShare on WhatsApp

Reversal indicators are plenty when it comes to technical analysis and candlestick patterns. For example, the counterattack candlestick pattern is a trend reversal indicator that many traders employ to enter a positioning trade. 

Today’s blog will discuss everything you need to know about this unique technical indicator.

Table Of Contents
  1. What are Counterattack Candlestick Patterns?
  2. How to Interpret Counterattack Candlestick Patterns?
  3. How to use Counterattack Candlestick Patterns?
  4. Bottomline 

What are Counterattack Candlestick Patterns?

This trend reversal candlestick pattern, also known as the counterattack lines candlestick pattern, consists of two candlesticks moving in opposite directions. It can occur during an uptrend or a decline and is valuable for identifying trend reversals.

 The indication is regarded as a bullish counterattack pattern when it appears during a decline. Conversely, the indicator is known as a bearish counterattack pattern during an uptrend.

How to Interpret Counterattack Candlestick Patterns?

When you see the pattern in action, it becomes much easier to comprehend its meaning. For example, the bullish counterattack pattern can be seen here.

counterattack candlestick patterns

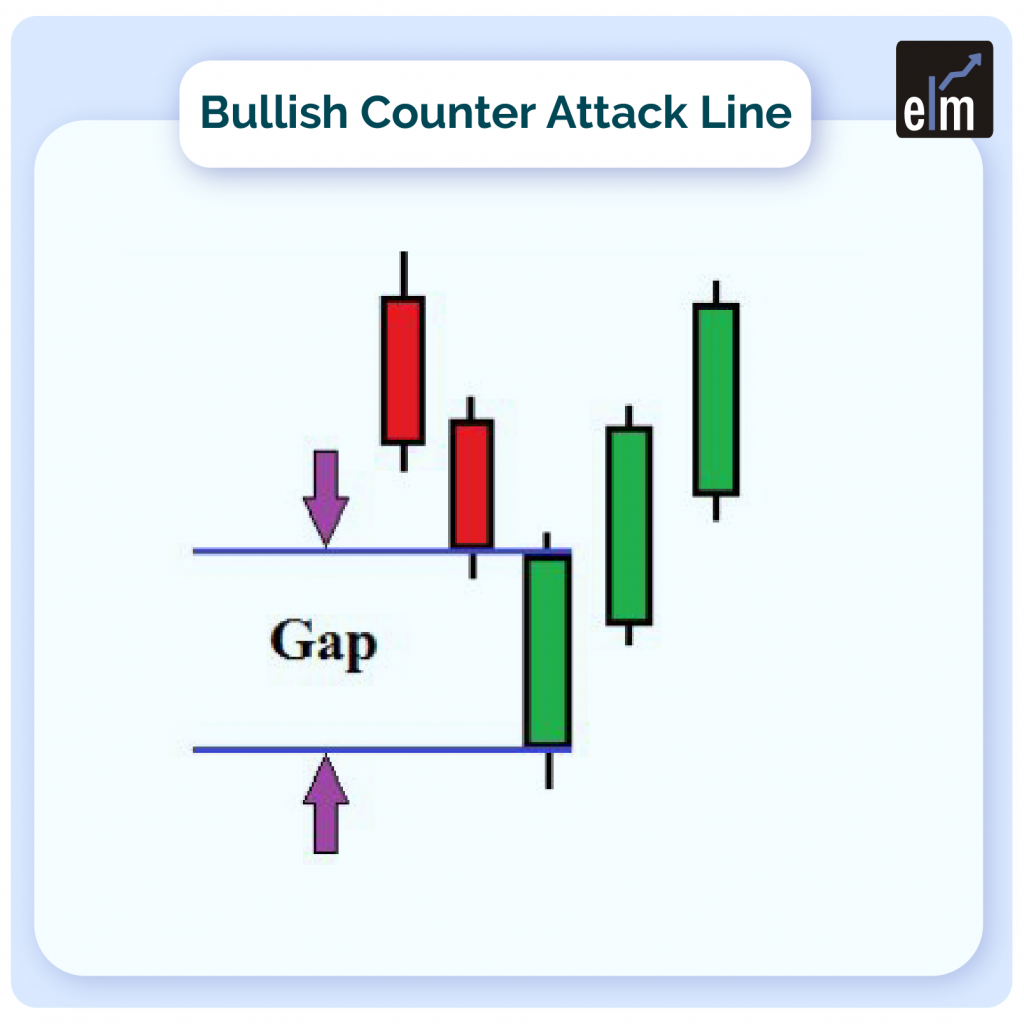
Take a look at this illustration. The bullish candle is coloured white, while the bearish candle is coloured black. The prices are clearly on the decline in this graph. Bears have a firm grasp on the market and have constantly lower prices. 

Join TMP Join TMP Join TMP

This is demonstrated with the first black-coloured candle. The white candle produces a ‘gap down’ in response to the trend’s significant selling pressure and continues to decline until it reaches the session’s lowest point.

However, the bears lose pace at this point, and the bulls flood the market, lifting the price dramatically. Thanks to the bulls ‘ robust demand, the session closes positively at about the previous day’s closing point.

How to use Bullish and Bearish Counterattack Candlestick Patterns 2

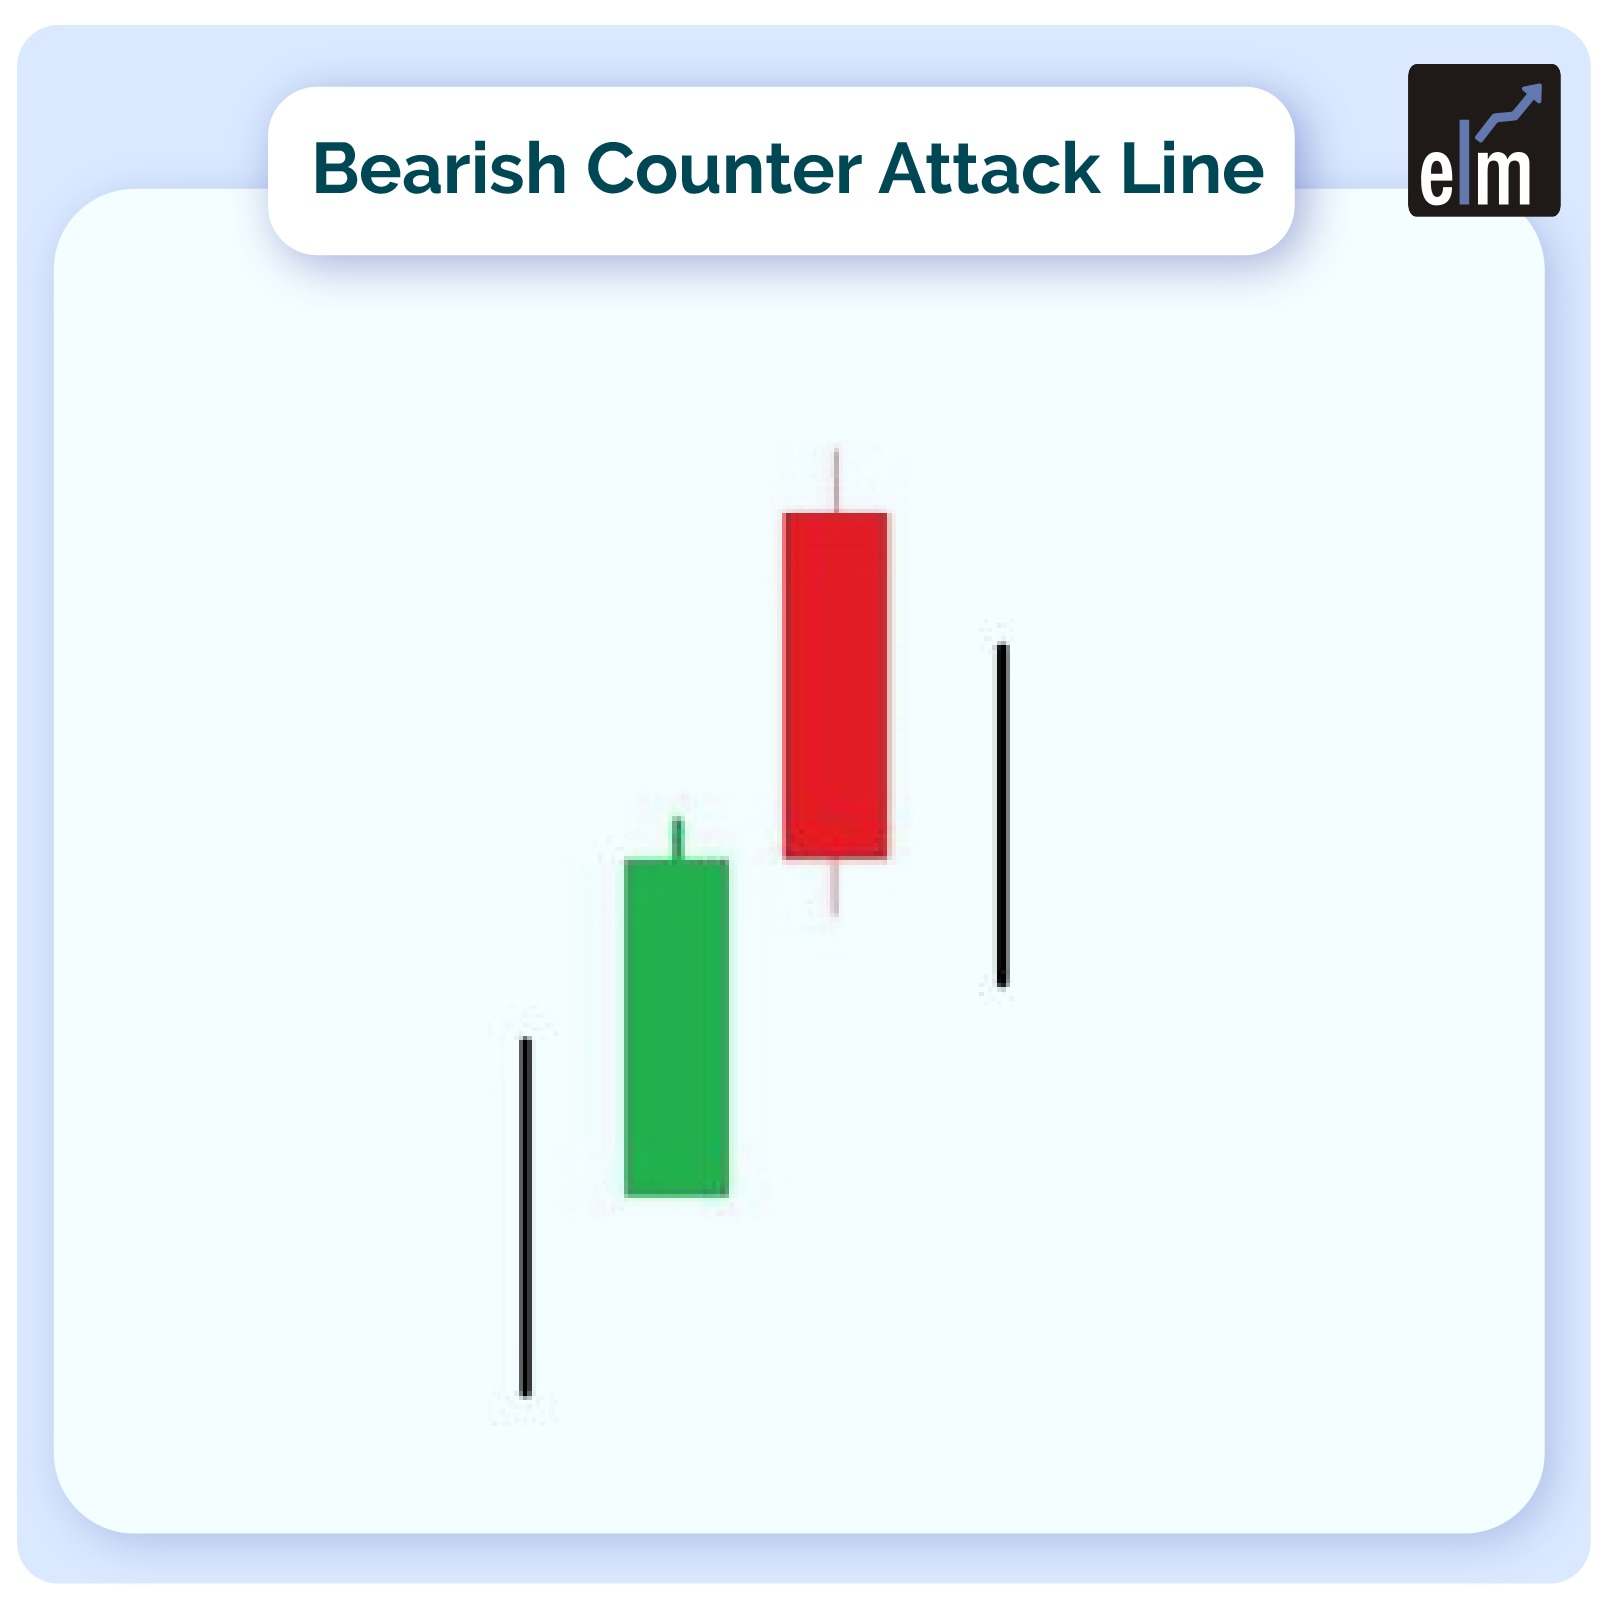
The prices are on an upswing in this candlestick chart. The bulls are a powerful force in the market, continually driving prices higher. The white-colored candle string demonstrates this. Due to the tremendous demand, the first black candle opens with a ‘gap up,’ implying that the price will continue to rise. However, the bulls lose steam at this point, allowing bears to enter.

The sellers then flood the market, driving the price down dramatically. The session closes unfavourably at about the point of the previous day’s closing due to the bears’ heavy selling push.

To know about other candlesticks, read our blog on All 35 Candlestick Chart Patterns in the Stock Market-Explained

How to use Counterattack Candlestick Patterns?

It’s one thing to notice the trend. However, using the detected pattern to enter a trade is different. As a result, before you embark on a trade based on the counterattack lines candlestick pattern, bear the following points in mind.

– To begin, keep an eye out for a strong trend. It could be either a bullish or bearish trend.

– Once you’ve determined the trend, look for a candle that opens with either a ‘gap up’ or a ‘gap down.’ The apertures should follow the current fashion.

– Pay attention to how this candle moves. The movement of the candle should be in the opposite direction of the current trend.

– Once that condition is met, make sure the candle in the middle is moving.

If all of the preceding conditions are met, a pattern can be dubbed a counterattack lines candlestick.

You can also join our course on Candlesticks Made Easy

– Once the pattern has been correctly spotted, it is best to wait for a confirmation candle before entering a trade. For example, in the case of a bullish counterattack pattern, you should only consider entering a trade if the candle that emerges after the pattern is also bullish. On the other hand, the bullish reversal is considered to have failed.

Notice how a bearish candle follows the bearish counterattack candlestick pattern? This candle verifies the trend reversal and should be used to enter the market.

Learn from Market Experts-

Trade Better with Candlesticks

Identify Trend Reversals with Candlesticks

Bottomline 

Because the counterattack lines candlestick pattern is so specialised and uncommon, it’s best to pair it with other technical indicators before making a trade choice. This way, the odds of your trade taking an unexpected turn are reduced.

We hope you found this blog informative and use it to its maximum potential in the practical world. Also, show some love by sharing this blog with your family and friends and helping us in our mission of spreading financial literacy.

Happy Investing!

Tags: basiccandlestick analysiscounterattack candlestick patternsenglishtechnical analysis
ShareTweetSend
Previous Post

Relative Strength Index (RSI) Range Shift- A Simple but Effective Trading Strategy

Next Post

How to trade using Rising and Falling Three Method Candlestick Patterns

Elearnmarkets

Elearnmarkets

Elearnmarkets (ELM) is a complete financial market portal where the market experts have taken the onus to spread financial education. ELM constantly experiments with new education methodologies and technologies to make financial education effective, affordable and accessible to all. You can connect with us on Twitter @elearnmarkets.

Related Posts

How to trade with Renko Charts Efficiently? 3
Technical Analysis

How to trade with Renko Charts Efficiently?

June 6, 2023
2.1k
Technical Analysis in Stock Trading 4
Technical Analysis

Technical Analysis in Stock Trading

May 31, 2023
7.1k
The Ultimate guide to Trading Divergences 5
Technical Analysis

The Ultimate guide to Trading Divergences

May 26, 2023
1.1k
Trading Psychology: Guide to Master Your Mind in 5 Steps 6
Technical Analysis

Trading Psychology: Guide to Master Your Mind in 5 Steps

May 24, 2023
3.2k

Leave a Reply Cancel reply

Your email address will not be published. Required fields are marked *

Follow Us

Facebook-f Twitter Instagram Linkedin-in Youtube Telegram

Register on Elearnmarkets

Continue your financial learning by creating your own account on Elearnmarkets.com

Register Free Account

Download App

Categories

  • Basic Finance
  • Derivatives
  • Financial Planning
  • Fundamental Analysis
  • Technical Analysis
  • Marketshala
  • Miscellaneous

Popular On Elearnmarkets

  • Market Superheroes:
  • Vivek Bajaj
  • Chetan Panchamia
  • Ashish Kyal
  • Premal Parekh
  • Abhijit Paul
  • Jegan
  • Sivakumar Jayachadran
  • Vishal Malkan
  • Jyoti Budhia
  • Vivek Gadodia
  • Vishal Mehta
  • Piyush Chaudhry
  • Santosh Pasi
  • Gomathi Shankar
  • Market Superheroes:
  • Vivek Bajaj
  • Chetan Panchamia
  • Ashish Kyal
  • Premal Parekh
  • Abhijit Paul
  • Jegan
  • Sivakumar Jayachadran
  • Vishal Malkan
  • Jyoti Budhia
  • Vivek Gadodia
  • Vishal Mehta
  • Piyush Chaudhry
  • Santosh Pasi
  • Gomathi Shankar
  • Courses:​
  • Options Trading
  • Dow Theory
  • Momentum Trading
  • Stock Investing
  • Stock Market for Beginners
  • Harmonic Chart Patterns
  • Algo Trading
  • Elliot Wave Theory
  • Advanced Excel
  • Cryptocurrency
  • NSE Certification Course
  • Courses:​
  • Options Trading
  • Dow Theory
  • Momentum Trading
  • Stock Investing
  • Stock Market for Beginners
  • Harmonic Chart Patterns
  • Algo Trading
  • Elliot Wave Theory
  • Advanced Excel
  • Cryptocurrency
  • NSE Certification Course
  • Webinars:
  • Bank Nifty Scalping
  • Intraday Trading Strategies
  • Options Trading Strategies
  • Options selling
  • Price Action
  • Relative Strength
  • Tax Planning
  • Options Buying
  • Growth Stocks
  • Portfolio Management
  • Relative Strength Index
  • Risk Management
  • Renko Charts
  • Crude Oil
  • Traders Psychology
  • Moving Average
  • Multibagger Stocks
  • Free Learning Modules:
  • Intraday Trading
  • Options Scalping
  • Swing Trading
  • Financial Modelling
  • RSI Indicator
  • Bollinger Bands
  • Pricing of Futures
  • Personal Finance
  • Initial Public Offerings (IPO)
  • Value Investing
  • Technical Indicators
  • Candlesticks
  • Chart Patterns
  • Option Greeks
  • ELSS Funds
  • Banking and Insurance
  • Real Estate
  • Gold
  • Book Summaries:
  • Rich Dad Poor Dad
  • Psychology of Money
  • The Intelligent Investor
  • The Richest Man in Babylon
  • Think and Trade Like a Champion
  • Value Investing and Behavioural Finance
  • Trading in the Zone
  • Learn to Earn
  • Book Summaries:
  • Rich Dad Poor Dad
  • Psychology of Money
  • The Intelligent Investor
  • The Richest Man in Babylon
  • Think and Trade Like a Champion
  • Value Investing and Behavioural Finance
  • Trading in the Zone
  • Learn to Earn
  • Tools:
  • CAGR Calculator
  • SIP Calculator
  • eLearnOptions
  • Future Value Calculator
  • Present Value Calculator
  • Atal Pension Yojana
  • Cost of Delay Calculator
  • Become a Crorepati
  • Tools:
  • CAGR Calculator
  • SIP Calculator
  • eLearnOptions
  • Future Value Calculator
  • Present Value Calculator
  • Atal Pension Yojana
  • Cost of Delay Calculator
  • Become a Crorepati

© 2023 Elearnmarkets. All Rights Reserved

  • Visit Elearnmarkets
  • Courses
  • Webinars
  • Financial Guides
  • Get Free Counselling
  • Visit Elearnmarkets
  • Courses
  • Webinars
  • Financial Guides
  • Get Free Counselling

Get Elearnmarkets App

No Result
View All Result
  • Article Categories
    • Basic Finance
    • Derivatives
    • Financial Planning
    • Fundamental Analysis
    • Technical Analysis
    • Marketshala
    • Miscellaneous
  • Language
    • Hindi
    • Bengali
    • English
  • Courses
  • Webinars

© 2020 Elearnmarkets All Rights Reserved