5 Powerful Bearish Candlestick Patterns
May 22, 2025
Top 9 Must Read Fundamental Analysis Books
May 27, 2025
Forex vs Stocks: Which Market Should You Trade First
May 13, 2025
How to Use Collar Option Strategy?
May 2, 2025
Relative Strength Index (RSI) is a momentum oscillator, developed by J. Welles Wilder, which measures the speed and velocity of price movement of trading instruments (stocks, commodity futures, bonds, forex etc.) over a specified period of time. The objective of...
Read our blog to know about NR7 and NR4 strategies for trading in the stock market.
Wedges are a type of chart pattern that is formed by converging two trend lines. They can be continuation as well as the reversal chart patterns.
A flag pattern is a type of chart continuation pattern that shows candlesticks contained in a small parallelogram. Read this blog to know in details.
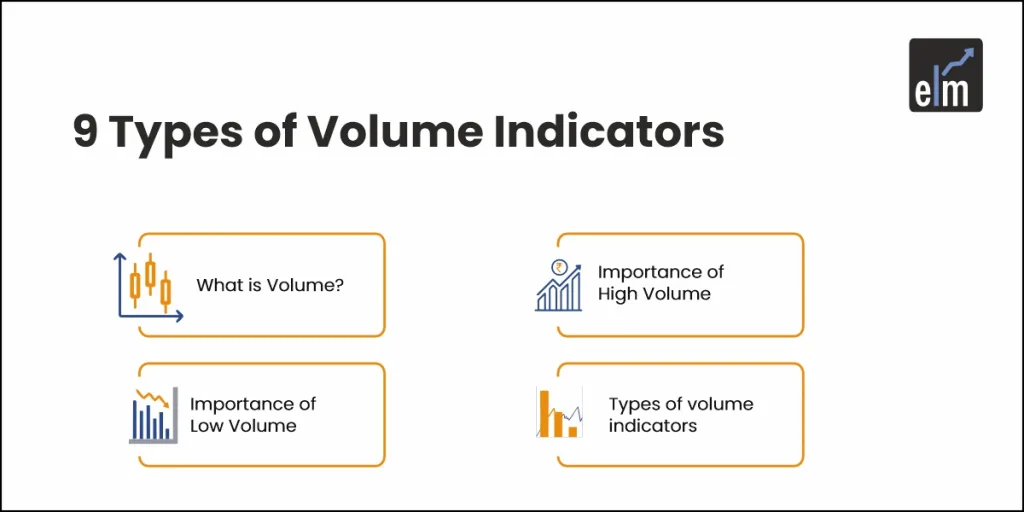
Volume plays an important role in technical analysis that helps in confirming trends and patterns.It also indicates how many stocks were bought and sold in the market at a given period. This helps us in gauging how other traders are...
Looking to understand the symmetrical triangle pattern? This article breaks down the key characteristics and provides tips on how to trade it effectively.
Looking to enhance your technical analysis skills? This guide explains the concepts of ascending and descending triangles and how to use them to make informed trading decisions.
Do you know Harmonic trading, unlike other more common trading methods, attempts to forecast future movements? So, in today’s blog let us discuss about Harmonic Patterns and different types of Harmonic Chart Patterns:
What exactly do we mean when we talk about market breadth? why is market breadth so important? So, in today's blog, we will discuss how to interpret market breadth indicators with the help of StockEdge:
In this blog, we will discuss 5 technical indicators that help us in identifying range-bound markets.
How many of you have heard business channels or analysts saying that the stock just broke out from the specific levels and can give big moves either up or down?So, in today's blog, let us discuss the 7 steps that...
Point and Figure Charting is a kind of technical chart that was developed in the late 1800s. Traders can trade and also do technical analysis by using Point and Figure Charting other than the bar and candlestick charts.
Elearnmarkets (Kredent InfoEdge Pvt. Ltd.) is a SEBI-registered Research Analyst (RA) entity (SEBI Registration No.: INH300007493). The information provided in this article is for educational and informational purposes only and should not be considered as an offer to buy or sell any securities or investment products.
The stocks, securities, and investment instruments mentioned herein are not recommendations under SEBI (Research Analysts) Regulations, 2014. Readers are advised to conduct their own due diligence and seek independent financial advice before making any investment decisions.
Investments in securities markets are subject to market risks. Please read all related documents carefully before investing. Investing in Equity Shares,
Derivatives, Mutual Funds, or other instruments carry inherent risks, including potential loss of capital. Elearnmarkets (Kredent InfoEdge Pvt. Ltd.) does not provide any guarantee or assurance of returns on any investments. Past performance is not indicative of future performance.