So many price action patterns in technical analysis, but which ones work in stock trading? Do you also wonder?
Don’t worry! In today’s blog will discuss the top 5 price action patterns that work in stock trading.
But first, let us discuss what price action trading is.
In trading, price action examines a security’s, indexes, commodities, or currencies’ behaviour in order to forecast what it will do in the future.
You may want to take a long position if your price action research indicates that the price is about to climb, or you may want to short the asset if you believe the price is due to fall.
Looking at patterns and finding crucial indications that may impact your investments are all part of understanding price action trading.
Many traders utilise various price action strategies to predict market moves and profit in the near term.
So, in today’s blog, let us discuss the Top 5 Price Action Patterns that work in Stock Trading:
Top 5 Price Action Patterns that Work in Stock Trading
1. False Breakout
False breakouts are exactly what they seem like: a breakout that didn’t extend beyond a certain level, resulting in a ‘false’ breakout of that level.
False breakout patterns are among the most important price action trading patterns to master since they are frequently a strong indicator that the price is about to change direction or that a trend is about to resume.
From the below chart of UPL LTD., prices after the breakout from the resistance level returned and crossed back to the resistance level. This indicated a false breakout and the trend reversed to a downtrend:
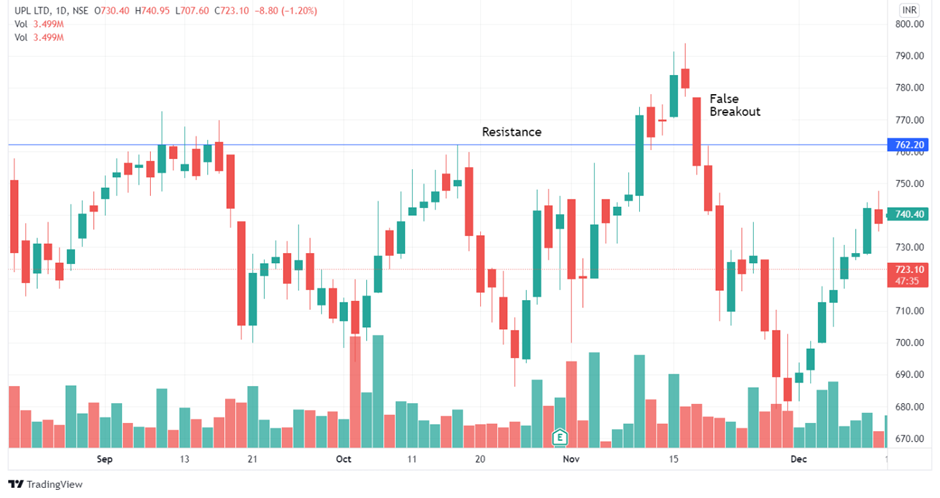
A false break of a level can be regarded as a market ‘deception,’ when the price appears to breakout but then swiftly reverses, misleading all those who took the breakout’s ‘bait.’
Amateurs will frequently enter what appears to be an ‘obvious’ breakout, only for professionals to push the market back the other way.
2. Breakout with Build-Up
First, let us discuss what build-up is. A build-up is a tight consolidation area where we notice that the size of the candles gets smaller.
So, a breakout with build-up helps the traders identify high-probability breakouts.
The main reason behind this is the bulls and bears at war near the resistance area. Therefore, the bulls will try to push the prices higher to break out from the resistance area.
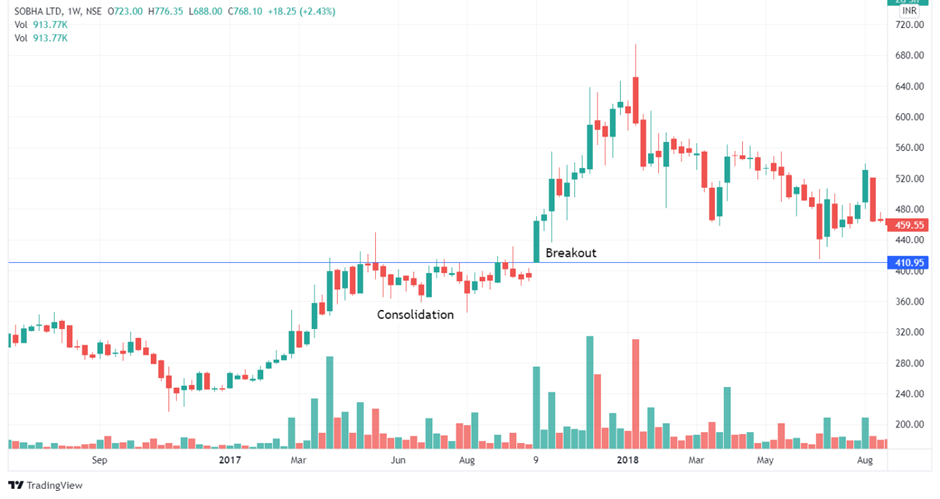
Whereas the bears will try to make prices fall from the resistance area. Thus, the prices enter a consolidated zone.
One can trade with this price action pattern when the prices break out after a tight consolidation zone near the resistance or support area.
3. Pullbacks
Price does not always move straight, and price movements in any financial market are frequently characterised by price waves. Moreover, bullish and bearish trend waves alternate in the markets.
The dominating trend waves travelled higher during an uptrend, as indicated in the graph below. The correction waves are movements in the opposite direction of the current trend. Traders who trade pullbacks search for the correction stages and enter trades during those phases.
You should wait for the price to “pull back” during a trend to get a better entry price. When the market is rising, and you believe it will continue to grow, you want to enter a trade at the lowest possible price.
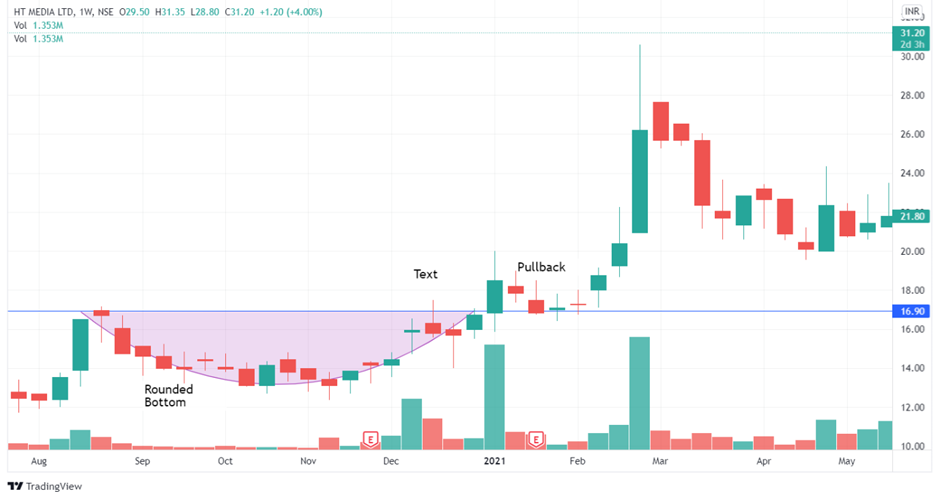
Breakout pullbacks are very common, and most traders probably use this price action pattern in trading.
Breakout pullbacks commonly happen at market turning points, when the price breakouts of a consolidation pattern. Wedges, triangles, or rectangles are the most popular consolidation patterns.
4. Breakout from Patterns
We can also place a long-short position when there is a breakout from chart patterns like Head and Shoulders, Wedges, Cup and Handle, etc.
These kinds of breakout patterns are most reliable, and one can also set a price objective after the pattern is completed and the breakout occurs.
5. Breakout and then Re-test
A retest occurs when prices reverse direction following a break and return to the breakout level.
Prices may stagnate, and short-term profit-taking selling may occur following a break to the upside, for example, after the first wave of buying.

Prices will likely recover to the breakout level, acting as a support level and drawing buying interest.
You can also take our course on Certification in Online Technical Analysis to learn more about trading using these price action patterns
Ready to master advanced technical analysis? Enroll now and unlock the power of top price action patterns in stock trading with our advanced technical analysis course!
Bottomline
As discussed, the above price action patterns can really help us in stock trading if you use technical charts for the same. Price action patterns provide day traders on the stock market with extremely obvious buy and sell signals. They are able to identify when a purchase or short-sell order has a high chance of being profitable, as well as when it would be best to take profits and close a transaction.
Frequently Asked Questions (FAQS)
What is the best pattern in price action?
With a projected objective reached about 85% of the time, the head and shoulders patterns are statistically the most accurate of the price action patterns. Two swing highs, the shoulders and the head, with the higher high in between, characterise the normal head and shoulders pattern.
How can I master price action?
You need to gain a thorough understanding of price charts and market dynamics in order to become a price action trading expert. Typically, to do this, historical market movement is examined to identify patterns and trends that can be utilised to forecast future price movements.


