

Decoding BSE Groups
November 4, 2025
Straddle vs Strangle: Which Options Strategy Fits a Volatile Market?
September 18, 2026
The CAPE Ratio, also known as the Shiller PE ratio or cyclically adjusted PE ratio, measures long-term market valuation using inflation-adjusted earnings over 10 years. This guide explains its formula, uses, advantages, limitations, and how investors can use it alongside...
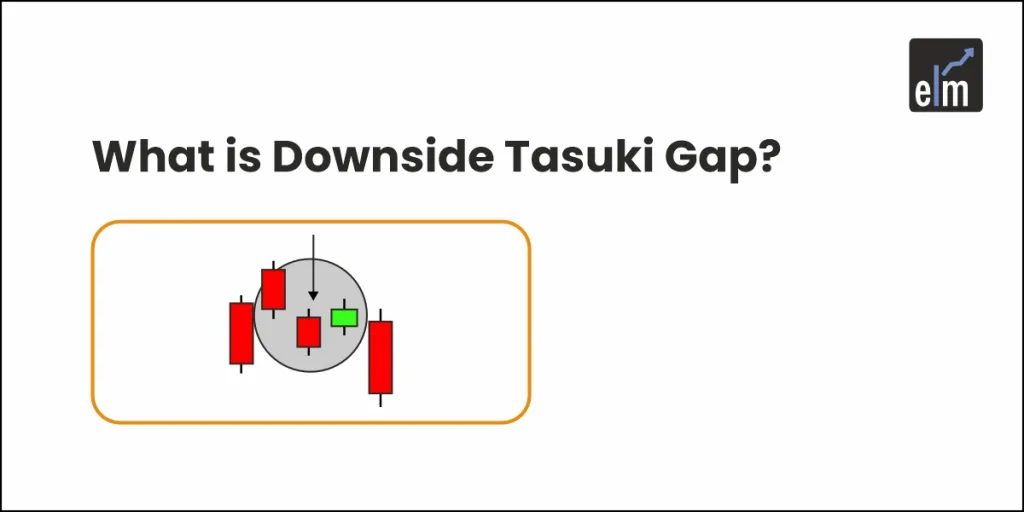
Key Takeaways Bearish Continuation Pattern: The Downside Tasuki Gap signals ongoing selling pressure in a downtrend. Three-Candle Formation: It consists of two red candles followed by a small green candle that fails to fill the gap. Indicates Weak Buyers: The...
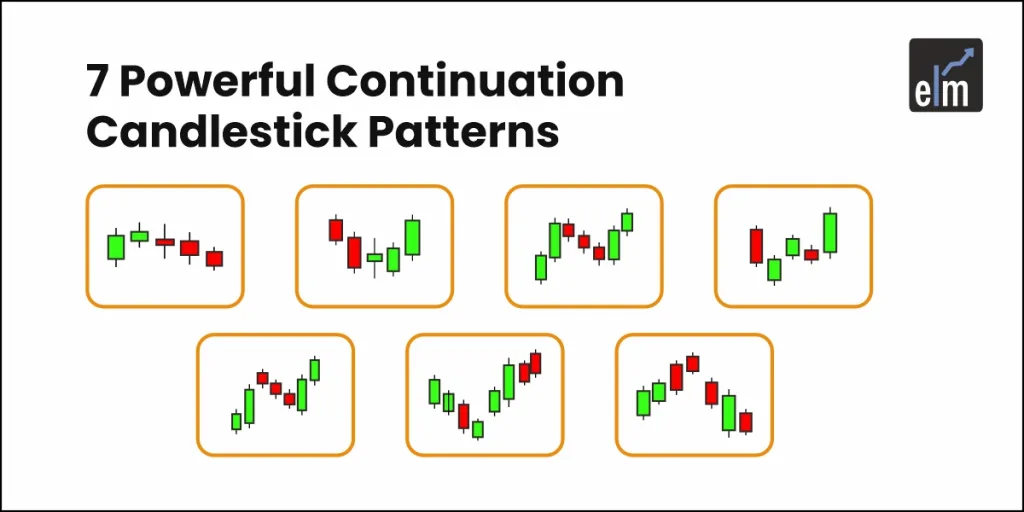
Learn about powerful continuation candlestick patterns that signal trend resumption in the financial markets.
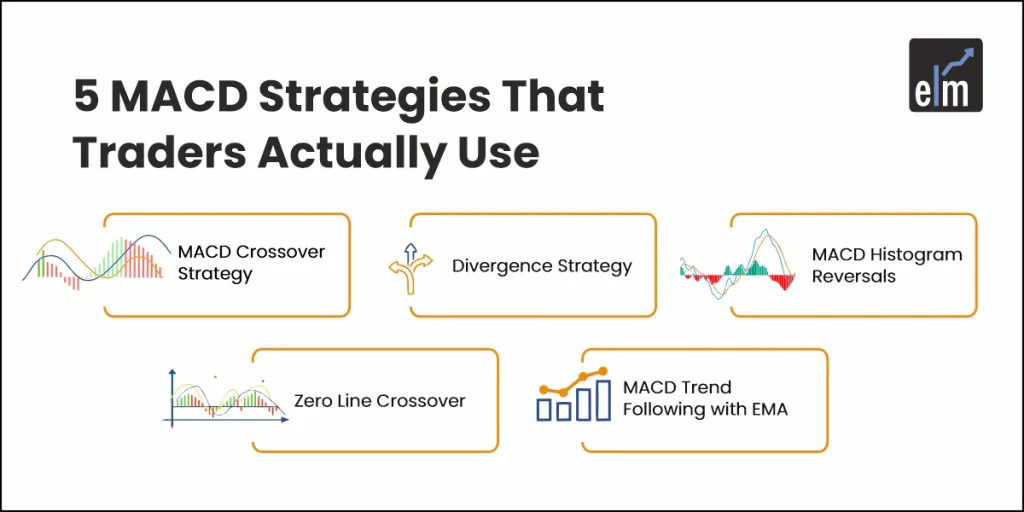
In In today's blog, we'll go through 5 trading strategies that use the MACD indicator, as well as we will also discuss how to incorporate these methodologies into your trading system.
Here is a comprehensive guide on 35 Candlestick Chart Patterns and how to trade with these candlesticks.
In the 1980s, a tool named “Bollinger Bands” was invented by John Bollinger. These bands are volatility indicators similar to the Keltner Channel. Except for the Bollinger Bands, which are placed two standard deviations above and below the moving average,...
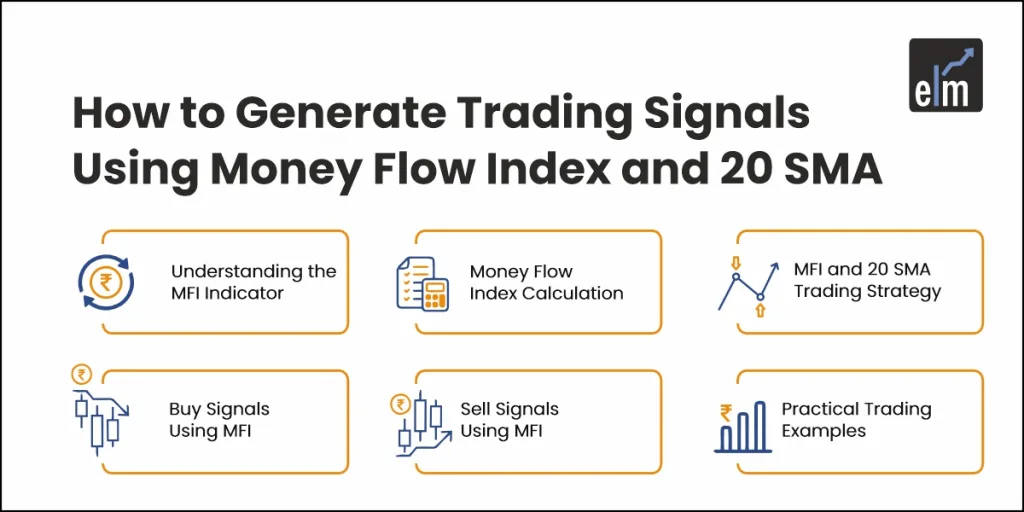
How to potentially generate trading signals for buying and selling stocks by combining the Money Flow Index (MFI) and the 20-day Simple Moving Average (SMA) technical analysis indicators.
Read our blog on On Balance Volume (OBV) technical indicator.
Parabolic Stop and Reverse (PSAR) is a technical indicator developed by J. Welles Wilder Jr., introduced in his 1978 book, "New Concepts in Technical Trading Systems." PSAR is used primarily by traders to identify potential reversals in the direction of...
In 1987, J. Welles Wilder developed the Average Directional Index (ADX) as an indicator of trend strength. He developed the ADX Indicator with commodities and daily prices in mind, but it can also be applied to stocks. ADX quantifies the...
Double top and double bottom chart patterns are important technical indicators in stock trading. Learn how to identify and interpret these patterns with this blog.
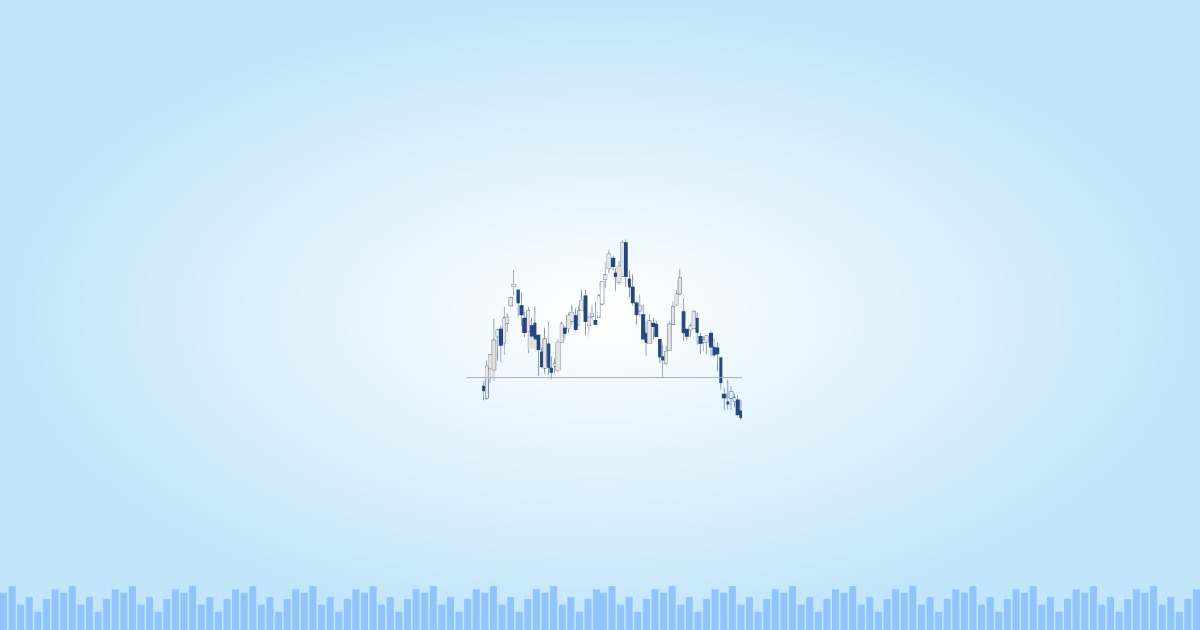
The head and shoulders pattern is a popular technical analysis tool used by traders to predict trend reversals. Learn how to interpret this pattern in our blog
Elearnmarkets (StockEdge Fintech Private Limited – formerly known as Kredent InfoEdge Private Limited) is a SEBI-registered Research Analyst (RA) entity (SEBI Registration No.: INH300007493). The information provided in this article is for educational and informational purposes only and should not be considered as an offer to buy or sell any securities or investment products.
The stocks, securities, and investment instruments mentioned herein are not recommendations under SEBI (Research Analysts) Regulations, 2014. Readers are advised to conduct their own due diligence and seek independent financial advice before making any investment decisions.
Investments in securities markets are subject to market risks. Please read all related documents carefully before investing. Investing in Equity Shares,
Derivatives, Mutual Funds, or other instruments carry inherent risks, including potential loss of capital. Elearnmarkets (StockEdge Fintech Private Limited – formerly known as Kredent InfoEdge Private Limited) does not provide any guarantee or assurance of returns on any investments. Past performance is not indicative of future performance.
Deliver breaking news, insightful commentary, and exclusive reports. Targeting readers who rely on our platform to stay ahead.
Contact Benzinga© 2024 Elearnmarkets All Rights Reserved