
The symmetrical triangle pattern is a continuation chart pattern like Ascending and Descending Triangle patterns.
This pattern is characterized by two converging trend lines that connect a series of troughs and peaks.
The trend lines should be converging to make an equal slope.
This pattern indicates a phase of consolidation before the prices breakout.
Let us discuss the formation of a symmetrical triangle pattern and how to trade with it:
What is a Symmetrical Triangle Chart Pattern?
The Symmetrical Triangle Chart Pattern indicates an ongoing period of price consolidation before the prices break.
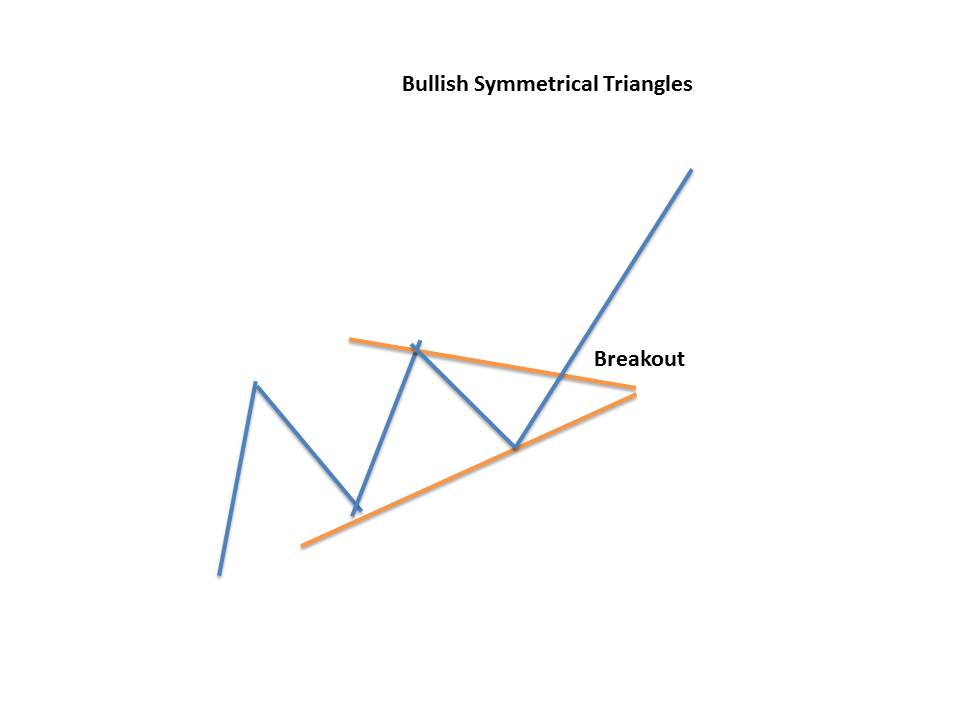
A bullish symmetrical triangle is a bullish continuation chart pattern, the movement preceding the triangle’s formation must be bullish.
On the other hand, A bearish symmetrical triangle is a bearish continuation chart pattern, the movement preceding the triangle’s formation must be bearish.
The symmetrical triangle pattern is different from a descending or ascending triangle pattern as both triangles’ lower and upper trend lines slope towards the centre point.
A horizontal upper trendline is formed in ascending triangles that predict a higher breakout. With a descending triangle, a horizontal lower trendline is formed that predicts a lower breakout.
The trend lines should be equal in their convergence slope when a symmetrical triangle is formed.
Formation of the Symmetrical Triangle Chart Pattern
Here is the formation of the Symmetrical Triangle Chart Pattern:
Trading with Symmetrical Triangle Chart Pattern
When trading with Symmetrical Triangle Chart Pattern, there are certain rules to be kept in mind:

- The converging trend lines should be converging to make an equal slope.
- The bullish symmetrical triangle should be formed in an ongoing uptrend and the prices should breakout from the upper trend line.
- The bearish symmetrical triangle should be formed in an ongoing downtrend and the prices should breakout from the lower trend line
Example
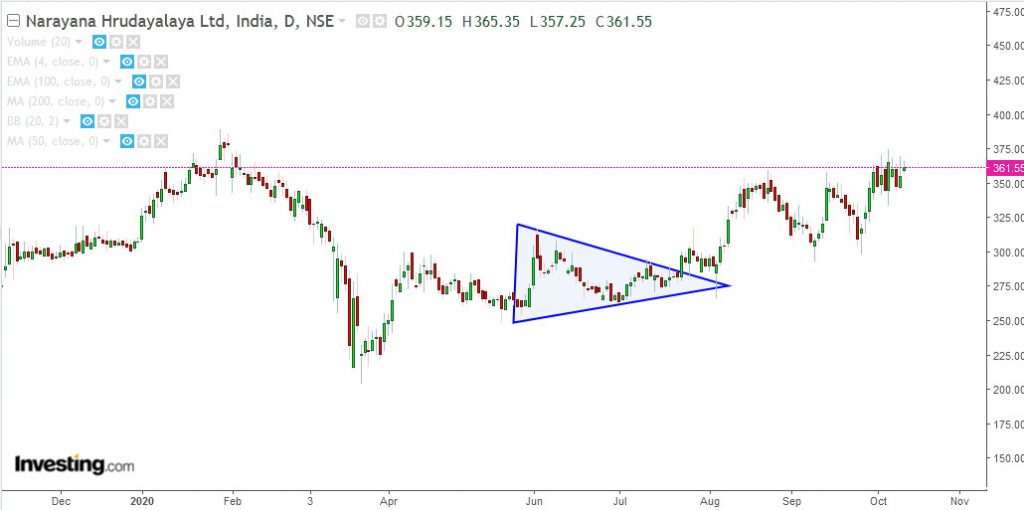
Below is an example of the bullish symmetrical triangle formed on the daily chart of Narayana Hrudayalaya Ltd.
We can see how it is formed in an ongoing uptrend and prices breakout from the upper trend line in the direction of the prior trend:
Stop Loss
The stop loss is placed right before the breakout point in a symmetrical triangle chart pattern.
Price Target
The price target is equal to the distance from the high and low of the earliest part of the pattern applied to the breakout price point.
The Symmetrical triangle works best with other chart pattern analysis.
Traders when using symmetrical triangles patterns, look for a high volume movement in a share price so the breakout is confirmed.
Other indicators can also help in estimating the duration of the breakout.
For example, the Relative Strength Index is used with the symmetrical triangle to estimate when the stock has become overbought after its breakout.
How to filter Stocks using the Symmetrical Triangle Screener?
There are so many stocks in which this chart pattern is formed and it is difficult for traders to look at the charts of more than 500 stocks for finding this pattern.
So, with the help of StockEdge, one can filter out stocks in which the Symmetrical pattern are formed:
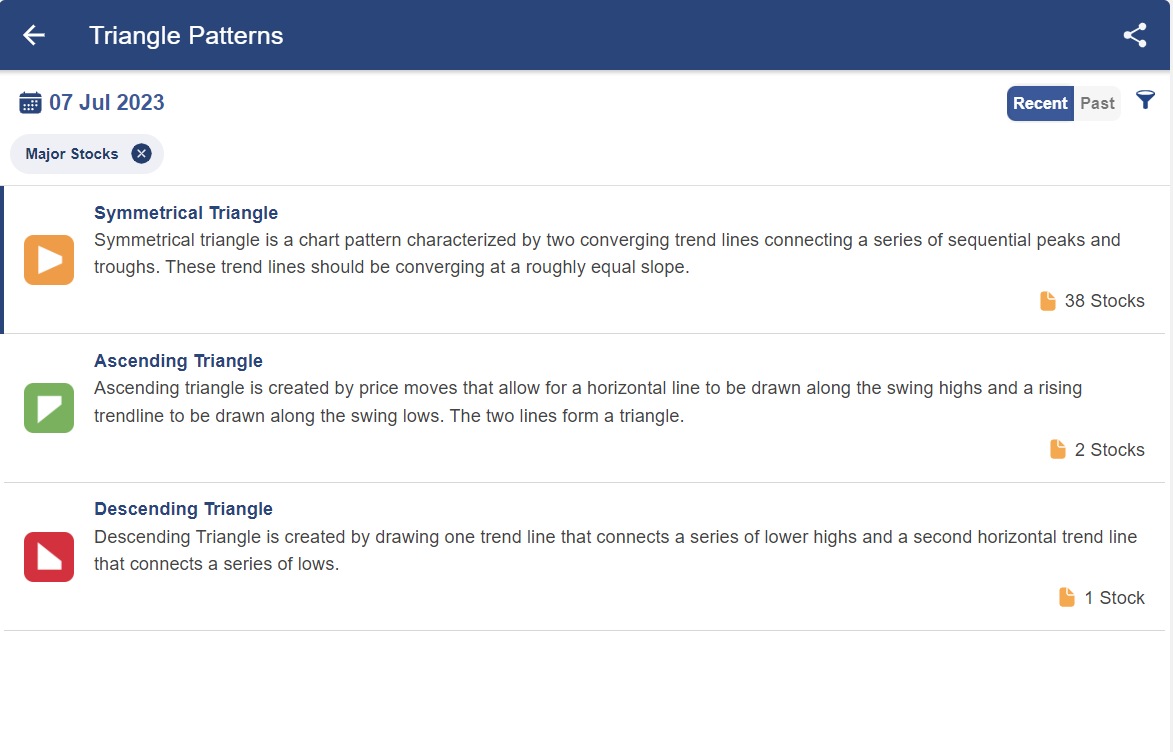
After clicking on the symmetrical pattern, you will get a list of stocks in which this pattern is formed:
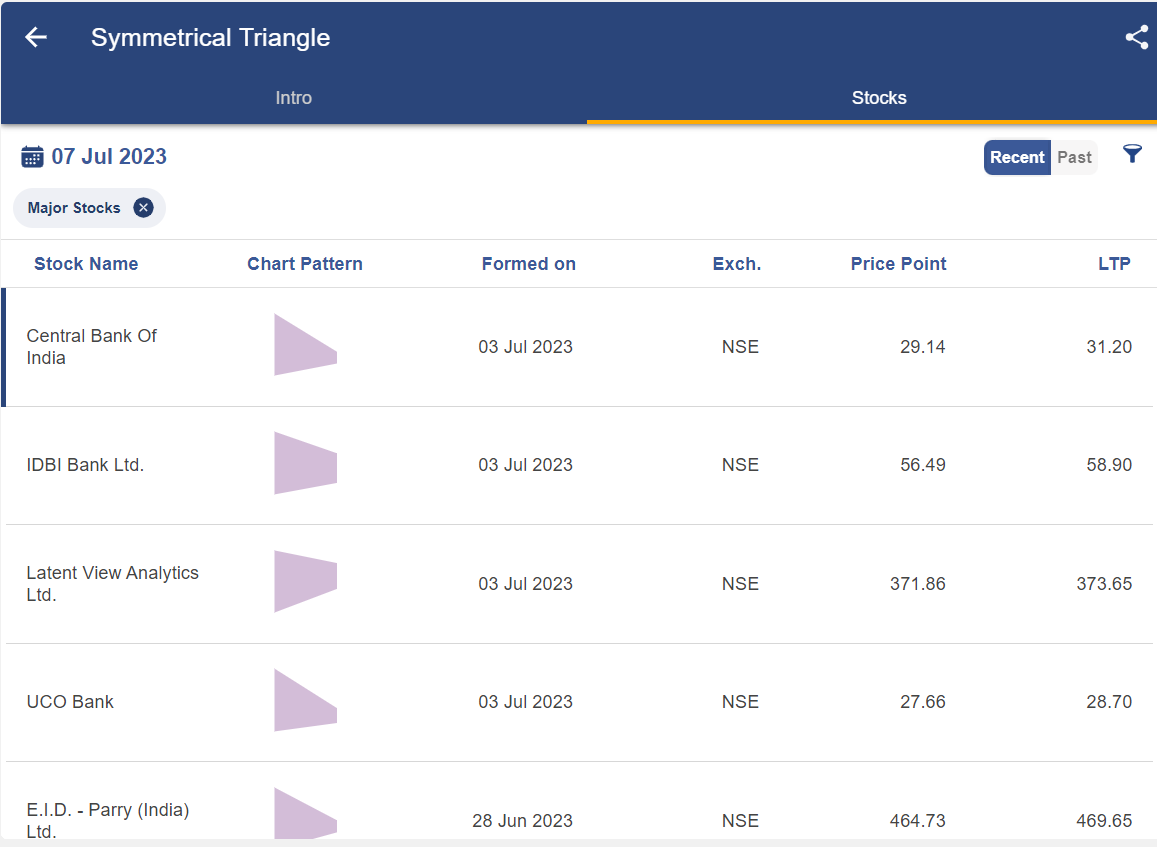
After clicking on any of the above stocks, you will get a technical chart showing the pattern as below:
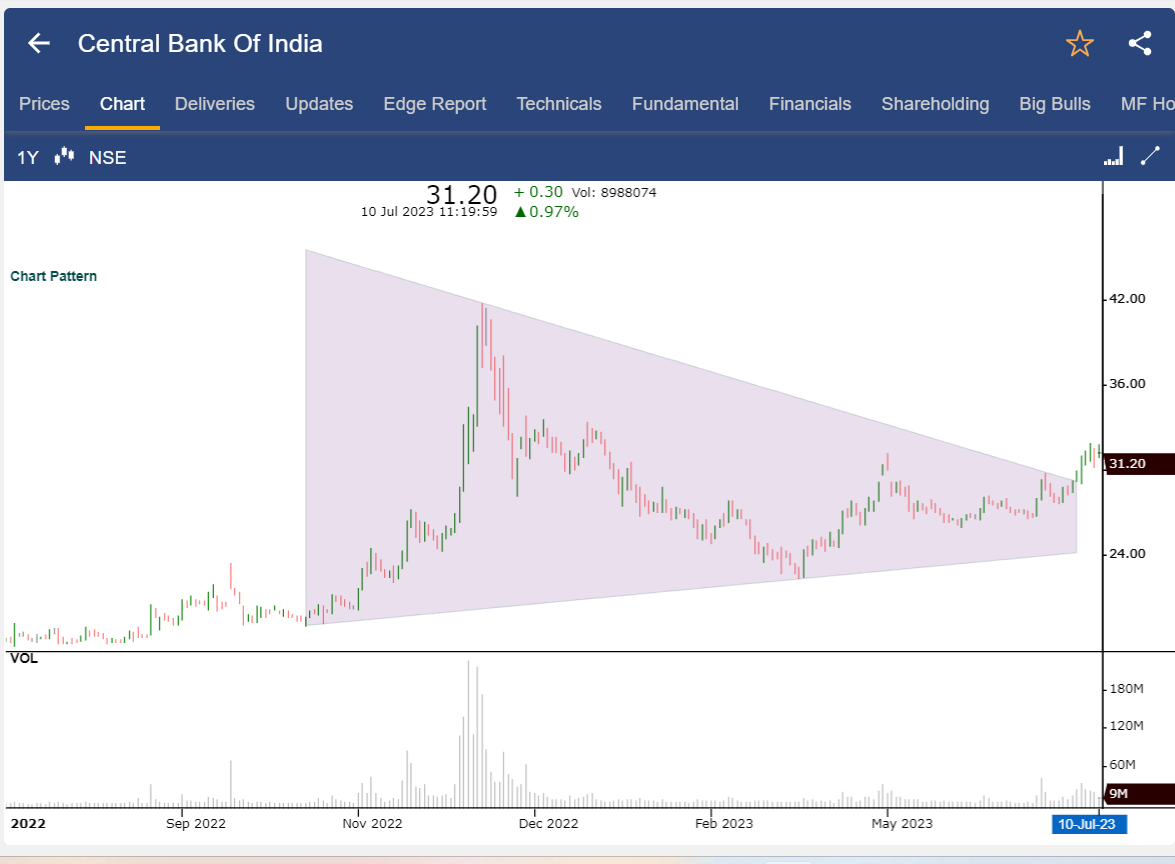
Once you have identified this chart pattern in the stocks, you can trade accordingly as discussed above.
You can also read more on Chart Patterns from our ELM School
Bottomline
The Symmetrical Triangle is a continuation chart pattern like Ascending and Descending Triangle patterns. The Symmetrical Triangle Pattern indicates an ongoing period of price consolidation before the prices break. The bullish symmetrical triangle pattern should be formed in an ongoing uptrend and the prices should breakout from the upper trend line. The bearish symmetrical triangle should be formed in an ongoing downtrend and the prices should breakout from the lower trend line.When trading with Symmetrical Triangle Pattern, there are certain rules to be kept in mind.
Frequently Asked Questions (FAQs)
What is a symmetrical chart pattern?
A symmetrical triangle is a type of chart pattern that consists of two trend lines that converge and link a sequence of peaks and troughs. These trend lines ought to be convergent with a slope that is about equal.
Is a symmetrical triangle pattern bullish?
Symmetrical triangles can serve as continuation patterns for both bullish and bearish trends. Never forget that confirmation is essential; a pattern can only be considered confirmed when the support or resistance level has been broken and tested.
What is a symmetrical triangle on the daily chart?
In symmetrical triangles, the upper and lower trendlines are tilted in the direction of the triangle’s apex due to the descending highs and ascending lows. Although they can also signal reversals, symmetrical triangles are a sign of consolidation and typically lead to the continuation of the past trend.
Is a symmetrical triangle a continuation pattern?
So far, two triangular formations have been observed: one from an upswing and a bullish market movement and one from a downtrend with a distinctly bearish appearance. On the other hand, symmetrical triangles are seen as continuation patterns that emerge in markets that are largely aimless in direction.


