The Head and Shoulders pattern is quite popular amongst the market participants due to its reliability in the past and, of course, the success ratio. Traders often study trends and patterns when analyzing the market in hopes of detecting the next most probable price movement.
Spotting and correctly identifying patterns and understanding their significance are vital to successful trading.
Let’s understand the pattern in detail.
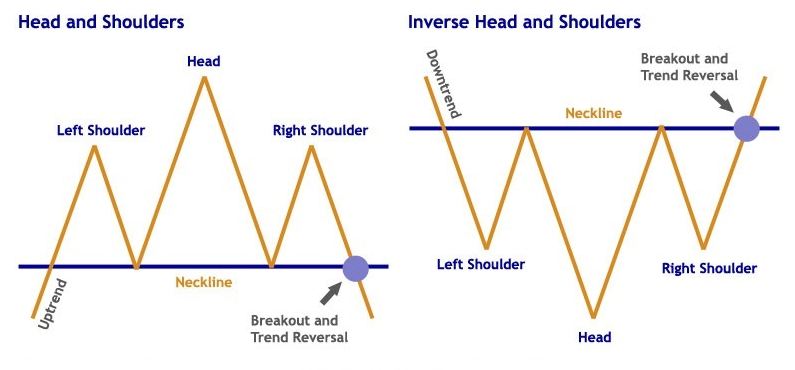
Head and Shoulders pattern, as the name suggests the shape of a head along with two shoulders. This is a reversal pattern and can act both as a bullish and bearish reversal pattern depending upon the prior trend and type of this pattern.
In today’s blog, let us discuss how to trade with head and shoulders pattern and also inverted head and shoulders pattern:
What is the Head and Shoulders Pattern?
This pattern gives a market reversal signal post breakdown from the neckline which is accompanied by heavy volume. The neckline is basically the horizontal line which joins both the troughs to each other.
The possibility of breakdown increases, if the slope of the neckline is flat to downward sloping and the right shoulder, is relatively smaller or equal to the left shoulder.
Another important aspect to remember is that post breakdown from this chart pattern, there may be a possibility of retesting to the neckline. The further breakdown is also accompanied by heavy volume which gives confirmation of the weakness.
The pattern can be formed in any timeframe from a few minutes to a weekly and monthly chart. However, the higher the timeframe higher is the chance of success.
Before we continue, it’s important to keep in mind that this pattern is almost never perfect, meaning, there will likely be small price fluctuations between the shoulders and the head, and the pattern formation is rarely perfectly shaped in its appearance.
What does an inverted head and shoulders pattern mean?
Similarly in the case of an Inverted pattern which is exactly a mirror image of the original pattern but is formed after a prior downtrend and is usually a bullish reversal pattern.
How to Interpret the Head and Shoulders Pattern?
This pattern is one of the popular patterns amongst the trader community due to its pre-determined price target estimate after the breakdown from the neckline.
The minimum target is the vertical distance from the head to the neckline post breakdown.
Usually, one can place stop loss at the high of the right shoulder and trail the same as the price corrects. With an inverse pattern, stops are usually placed at the low of the right shoulder.
Example of Head and Shoulders pattern chart:
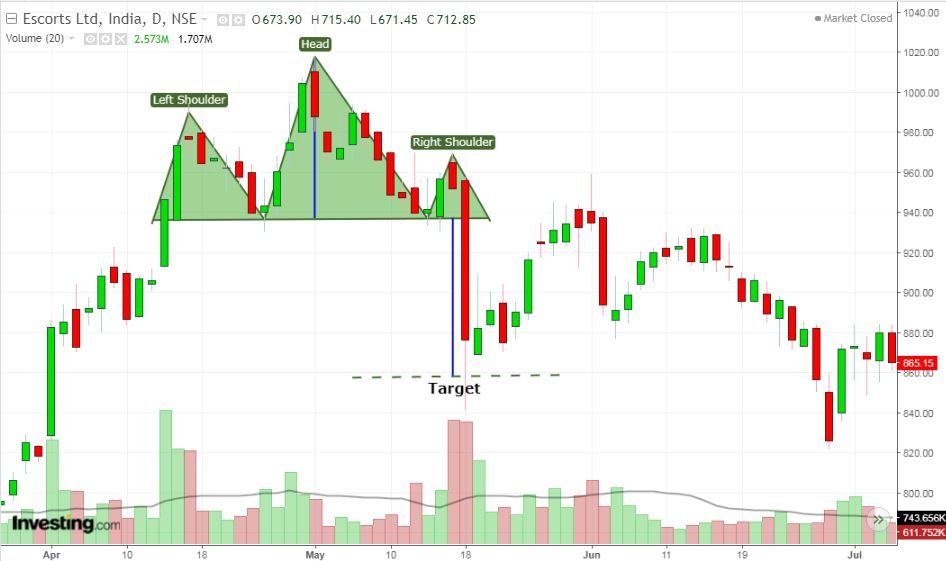
This is an example of this pattern formed in the daily chart of Escorts where post breakdown from the neckline, the stock witnessed a sharp selloff and achieved the pattern target (shown by the blue line) in a mere single candle.
Moreover, the breakdown was also supported by high volume which further confirmed the weakness.
Example of Inverse Head and Shoulders pattern:
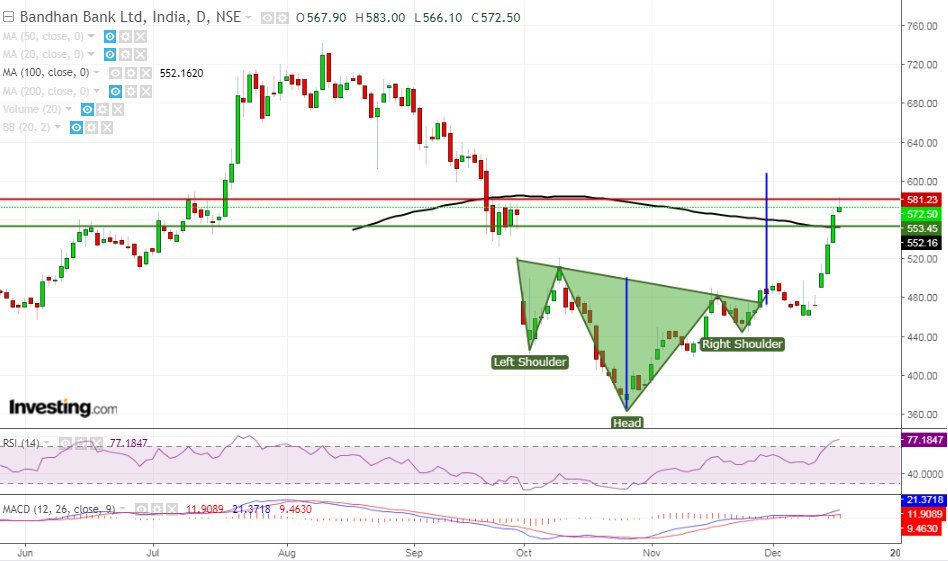
The above image is an example of an Inverted pattern which was formed in the hourly chart of Bandhan Bank Ltd. The stock witnessed sharp movement post-breakout from the pattern on a very high volume.
One important thing to note here is that the stock made a retest to the neckline here.
You can also read more on Chart Patterns from our ELM School
How to filter Stocks using a Head and Shoulders Screener?
There are so many stocks in which this chart pattern is formed and it is difficult for traders to look at the charts of more than 500 stocks for finding this pattern.
So, with the help of StockEdge, one can filter out stocks in which the head and shoulders pattern is formed:
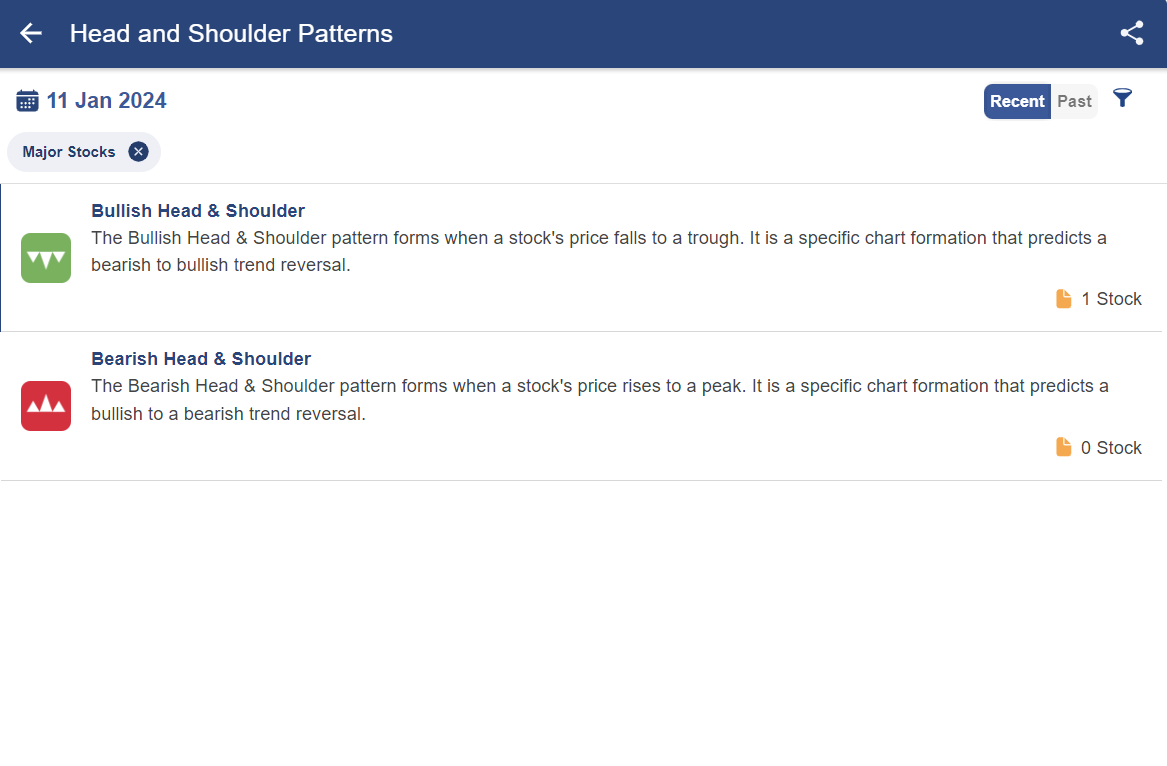
After clicking on the bullish or bearish head and shoulder, you will get a list of stocks in which this pattern is formed:

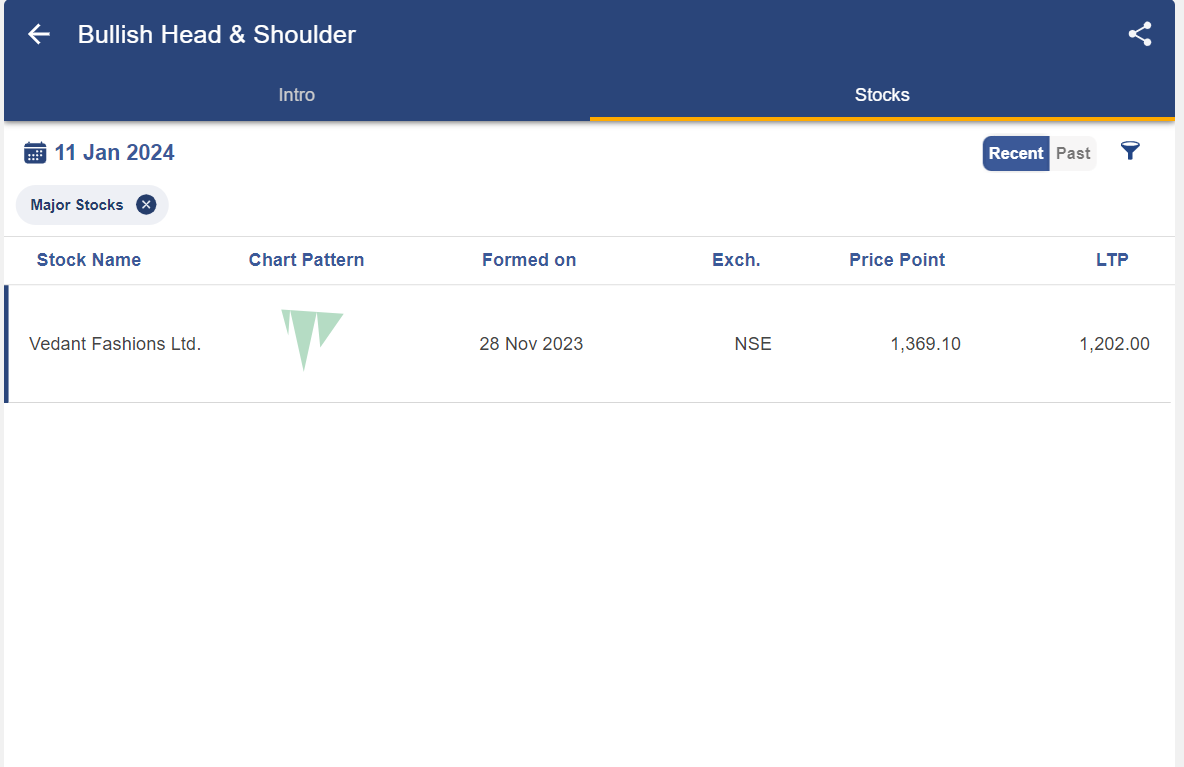
After clicking on any of the above stocks, you will get a technical chart showing the pattern as below:
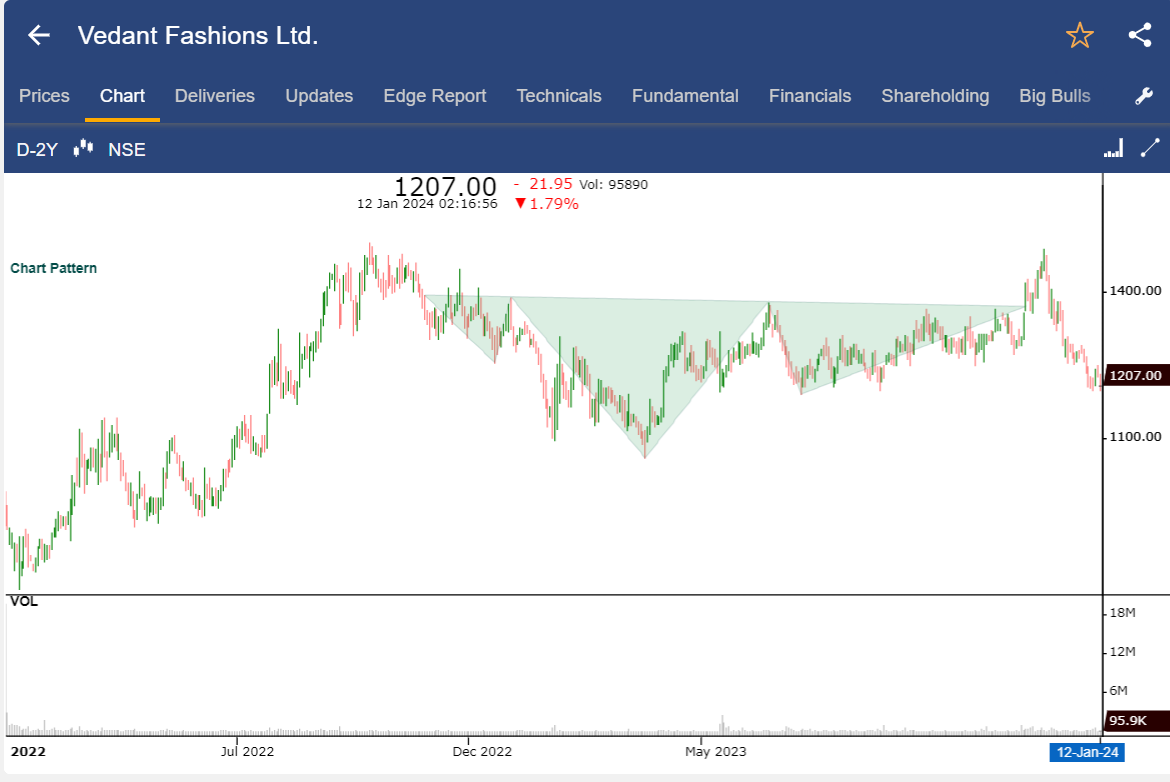
Once you have identified this chart pattern in the stocks, you can trade accordingly, as discussed above.
Bottomline
To achieve your trading goal, it’s important to incorporate discipline and adopt proper risk management. This is the reason for the popularity of the Head & Shoulders pattern due to its risk-reward objective.
However, no pattern is 100% accurate but this pattern signals a change in trend and creates a profit opportunity with a defined risk-reward.
You may take further confirmation of the possibility of a breakout by tracking the volume; the slope of the neckline and with the help of technical parameters.
Furthermore, understanding candlestick patterns can unlock valuable insights into market sentiment and potential price movements, offering traders a powerful tool for informed decision-making.
Frequently Asked Questions (FAQs)
Is a head and shoulder bearish or bullish?
A head and shoulders pattern, which is a bearish reversal pattern, indicates that the uptrend has peaked and that the reversal has begun when the succession of higher highs—the first and second peaks—is broken by the third peak, which is lower than the second.
What is the rule of head and shoulder pattern?
The head is formed when enthusiasm reaches its height and then begins to fall to a level at or very close to the stock’s prior low. The formation of the right shoulder coincides with the stock price’s subsequent rally, which falls short of its previous peak.
What is the success rate of the head and shoulders pattern?
An example of a predicted chart formation is this pattern. This pattern has long been acknowledged as a reliable pattern that can spot trend reversals.


useful….good
Hi Sampat,
Thank you for Reading!
Keep Reading!
thank you sir for informiton
one of the most popular and reliable chart pattern neatly explained.that itself can be a trading strategy provided we stick to its basic rules and apply in our daily analysis.our eyes should be trained to catch those and never miss them because of their success rate.
Thank you.
Excellent article. Wonderful set of information. Thanks for the post.