MACD Strategies or Moving Average Convergence Divergence(MACD) is regarded as one of the most important indicators in technical analysis, as it can identify opportunities across financial markets.
Did you know that this technical indicator not only helps us in identifying whether the trend is bullish or bearish but also helps us in our trading by giving us entry and exit levels of the stock?
So, in today’s blog, we’ll go through 5 MACD trading strategies that use the indicator, as well as we will also discuss how to incorporate these methodologies into your trading system.
What is Moving Average Convergence Divergence?
One of the most often used technical analysis indicators is moving average convergence divergence.
It’s a trend-following momentum indicator, which means it looks at the momentum of an asset to see whether it’s trending up or down. It may be used to generate trade signals and discover trading opportunities.
The Moving Average Convergence Divergence indicator is shown in a separate window beneath the chart. It has the appearance of a histogram with an auxiliary line.
The divergence of two moving averages is depicted in the histogram. The histogram bars increase longer as one travels away from the other; the bars get shorter as the moving averages get closer.
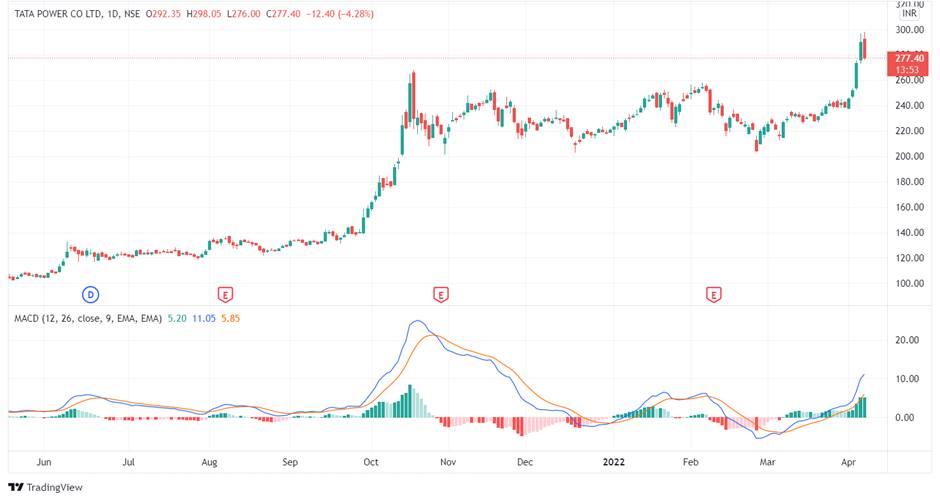
Rapid movements will show up as long bars in the MACD histogram, whereas flat will show up as short bars.
The indicator’s default values are 12,26,9. However, many traders confuse the indicator’s two lines with simple moving averages.
Remember that the lines are exponential moving averages, which will react more strongly to recent price movement than a standard moving average (SMA).
Thus, the MACD lines are represented as 12-period EMA and 26-period EMA.
Let us understand how MACD strategies work-
How does MACD Work?
Moving Average Convergence Divergence, or MACD, is a well-liked technical analysis tool that can be used to spot possible trend shifts and to suggest when to purchase and sell assets, especially in financial markets like stocks or cryptocurrencies.
A bullish signal is generated when the MACD Line crosses above the Signal Line, indicating a possible purchasing opportunity. In contrast, a bearish signal is generated when the MACD Line crosses below the Signal Line, suggesting a possible selling opportunity.
Having understood the basics of these technical trend indicators, let us discuss some MACD strategies that you employ when trading with this indicator:
5 MACD Strategies for Trading
Here are 5 MACD Strategies for Trading:
1. Crossovers
The MACD line and signal line can be utilised similarly as a stochastic oscillator, with the crossover between the two lines providing buy and sell signals.
As with most crossover strategies, a buy signal comes when the shorter-term, more reactive line – the MACD line – crosses above the slower line – the signal line. Conversely, when the MACD line crosses below the signal line, it provides a bearish sell signal.
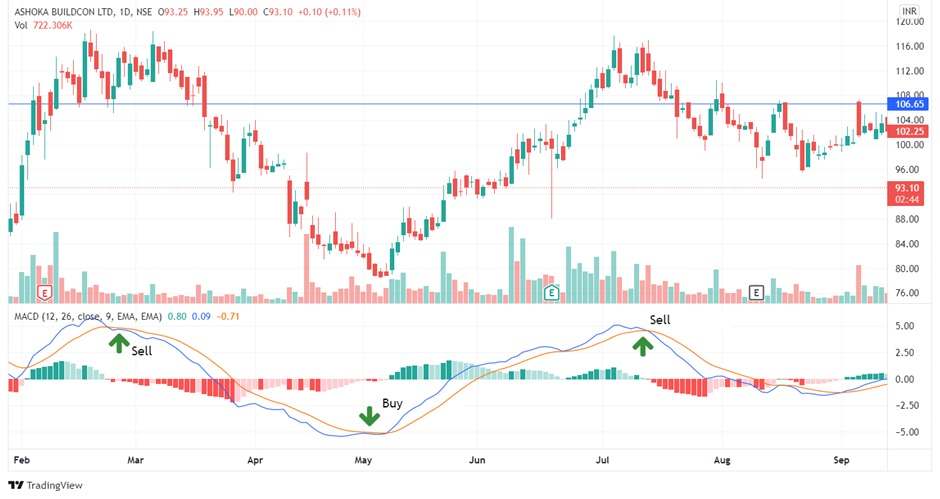
As the crossover strategy is lagging by nature, it is based on waiting for a movement to occur before opening a position.
In weaker market movements, the MACD’s biggest problem is that the price may have reached a reversal point by the time a signal is generated. This would be referred to as a ‘false signal.’ It’s worth mentioning that techniques that rely on price action for signal confirmation are frequently seen as more dependable.
2. MACD Histogram
The histogram, with the bars reflecting the difference between the MACD and signal lines, is likely the most valuable aspect of MACD indicator.
The histogram will grow in height when the market price moves aggressively in one direction, and it will diminish when the market is moving slowly.
The two moving average lines are moving wider apart as the bars on the histogram travel further away from zero.
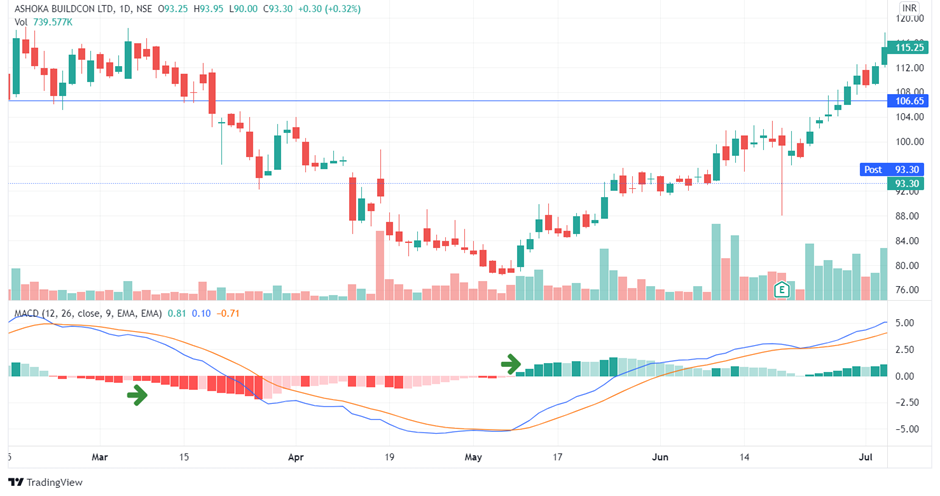
After the first expansion period has passed, a hump shape will most likely appear – this is a sign that the moving averages are tightening again, which can be a precursor to a crossing.
3. Zero Crosses
The zero-cross approach is based on the zero line being crossed by any EMAs. A new uptrend may be forming if the MACD crosses the zero line from below, while a recent downtrend may be forming if the MACD crosses from above.
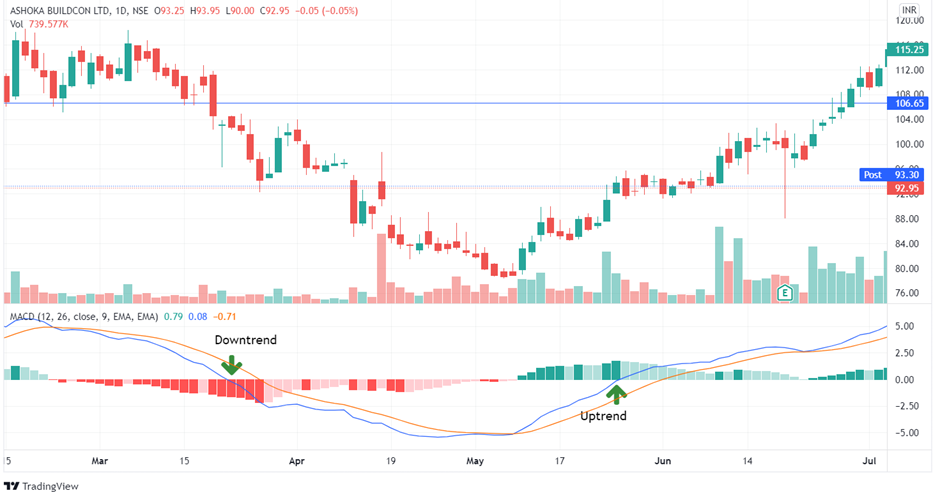
Because this is the slowest of the three signals, you will observe fewer signals and fewer false reversals. When the MACD crosses above the zero line, buy – or close a short trade – and when the MACD crosses below the zero line, sell – or close a long position.
Because of the delayed nature of this strategy, it should be utilised with caution in quick, choppy markets since the indications will often arrive too late. This can, however, be quite valuable as a technique for delivering reversal indications for significant sweeping advances.
4. MACD and Relative Vigor Index
The Relative Vigor Index is an oscillator that compares the closing price to the price range of the stock.
The calculation is a little difficult. To put it another way, think of the RVI as a cousin of the Stochastic Oscillator.
It is possible to provide more context for overbought/oversold scenarios by including an oscillator. This provides context for the MACD stock indicator, confirming whether the trend’s momentum or strength is intact.
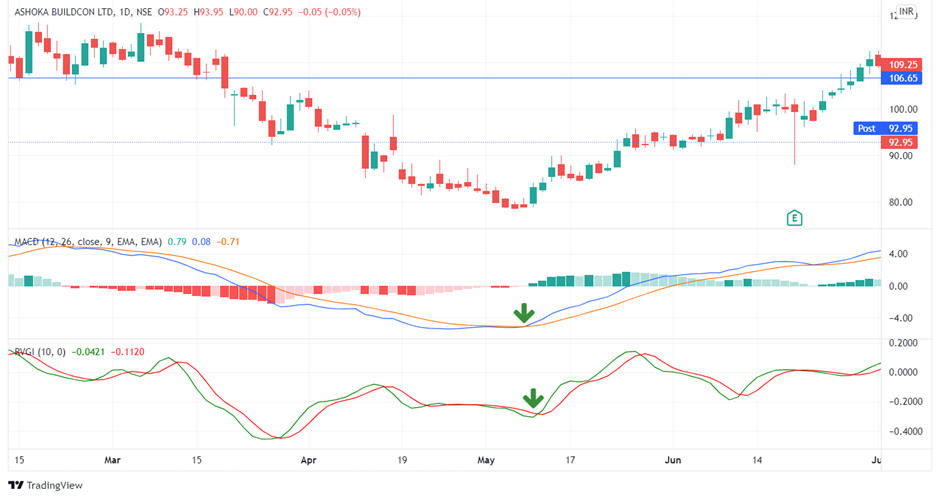
Combining these two tools has the basic goal of matching crossings.
In other words, if one of the indicators has a cross, we wait for the other indicator to cross in the same way. When this happens, we either buy or sell.
Read more about Technical Indicators from ELM School
5. MACD and Money Flow Index
Another oscillator is the money flow index, which focuses on both price and
Because the money flow index requires both price movement and volume spikes to create extreme readings, it will generate fewer buy and sell signals than other oscillators.
This approach will combine the MACD stock indicator’s crossing with the money flow index’s overbought/oversold signals (MFI). We wait for a bearish cross of the MACD lines when the MFI signals an overbought stock. If this occurs, we will be forced to go short.
In the same way, it works in the other direction. A long signal is generated by an oversold MFI reading and a bullish cross of the MACD lines. As a result, we remain until the signal line of the MACD breaks the trigger line in the opposite direction.
You can also watch our Webinar on Finding the Next Big Winner with the Help of Moving Average Convergence Divergence Indicator
Is MACD a Good Indicator?
MACD is a popular technical analysis indicator used by traders and investors to assess the momentum and trend direction of a financial instrument.
MACD provides valuable insights into the strength and duration of a trend, as well as potential trend reversals. However, like any indicator, MACD has its limitations. Traders often use MACD in conjunction with other technical indicators and tools to confirm signals and make informed trading decisions.
Ultimately, the effectiveness of MACD as an indicator depends on the trader’s strategy, risk tolerance, and experience. It is important to thoroughly understand how MACD works and combine it with other forms of analysis before making trading decisions.
Learn about MACD with Trading Strategies using RSI & MACD by Market Experts
Which Time Frame is Best for MACD?
It can be useful for day traders or others who concentrate on short-term price changes to use shorter time frames, such as 5-minute or 15-minute charts using MACD. Though they can potentially be more susceptible to noise and false signals, shorter time intervals offer more frequent signals.

Medium-Term Trading: 1-hour, 4-hour, or daily charts may be appropriate for MACD analysis for swing traders who maintain positions for a few days or weeks. Compared to shorter time frames, these time frames are better equipped to catch medium-term trends and offer more dependable indications.
Weekly or monthly charts with MACD might be useful for position traders or long-term investors who are interested in longer-term trends. These time spans concentrate more on significant trend shifts and are less susceptible to noise and short-term variations.
What is the Success Rate of the MACD Indicator?
Like any technical analysis tool, the MACD (Moving Average Convergence Divergence) indicator’s success rate is difficult to pin down to a single success rate percentage.
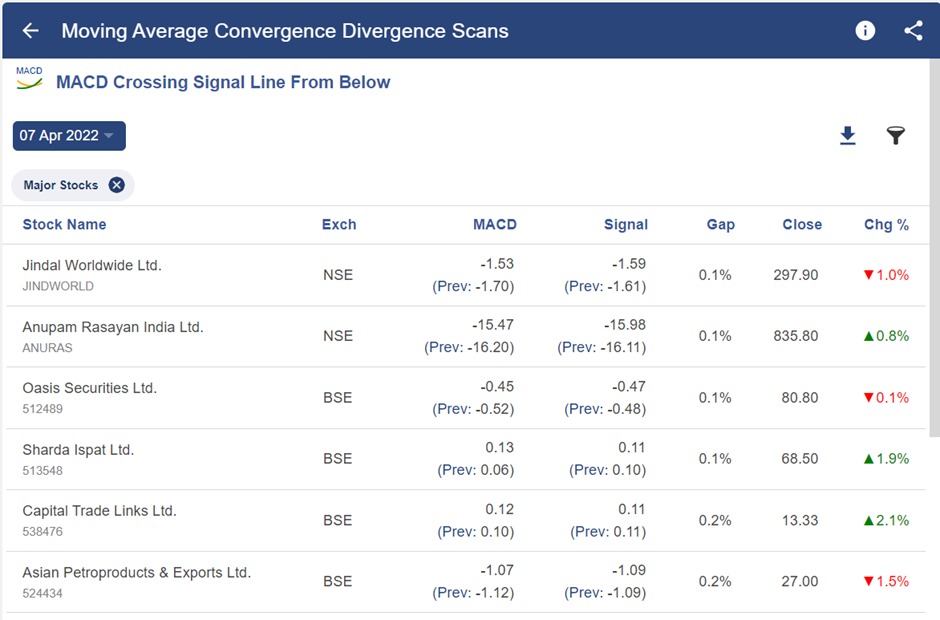
In StockEdge, multiple MACD scans help us filter the stocks for trading, as shown below.
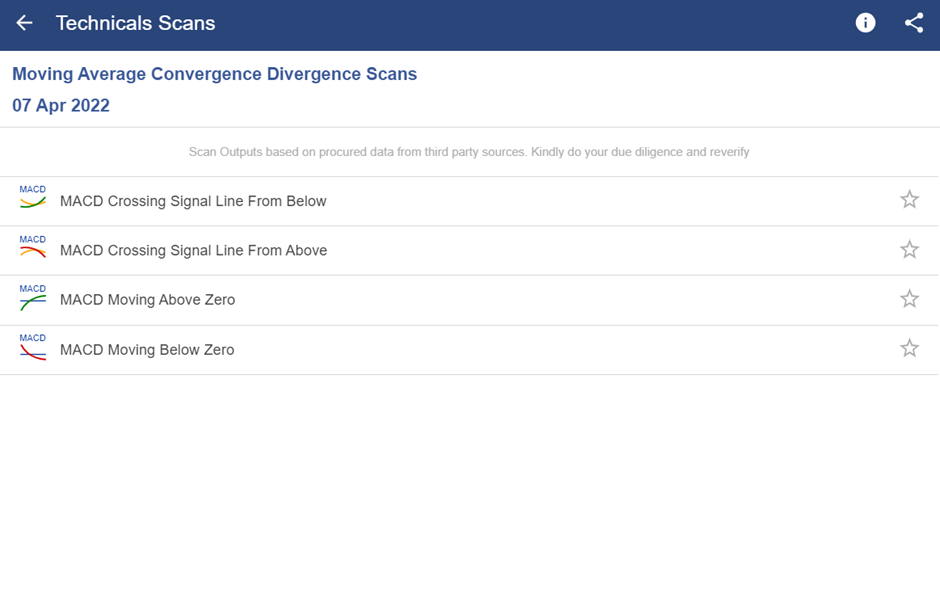
After selecting any of the scans, we get a list of stocks that full fill that criterion-
Bottomline
When initially starting as a trader, indicators and MACD trading strategies can be confusing. MACD Strategies, however, be useful tools to supplement our trading if we have the correct information and expertise. We hope you found this blog informative and use it to its maximum potential in the practical world. Also, show some love by sharing this blog with your family and friends and helping us in our mission of spreading financial literacy.
Happy Investing!
Frequently Asked Questions (FAQs)
1. Should I use MACD or RSI?
The decision to use RSI or MACD, or both, ultimately comes down to your trading objectives, preferred method, and the particular market circumstances you are working in. The tool that best fits your trading strategy can be found through trial and error and testing in a virtual environment.
2. What are the two lines in MACD?
The two lines in MACD (Moving Average Convergence Divergence) are the MACD Line and Signal Line.
3. Why are 12 and 26 used in MACD?
The Moving Average Convergence Divergence (MACD) line is typically calculated using the values 12 and 26, which are selected based on historical analysis.


I really love your article, it’s interesting
Hi,
We really appreciated that you liked our blog!
Thank you for Reading!
Keep Reading!
Very good lessons, So Many thanks.
Hi,
We really appreciated that you liked our blog!
Thank you for Reading!
Keep Reading!
Good
Hi,
We really appreciated that you liked our blog!
Thank you for Reading!
Keep Reading!