Elearnmarkets - Financial Market Learning
  • Categories
    • Basic Finance
    • Derivatives
    • Financial Planning
    • Fundamental Analysis
    • Technical Analysis
    • Marketshala
    • Miscellaneous
  • Language
    • English
    • Hindi
    • Bengali
No Result
View All Result
  • Courses
  • Webinars
  • Learn On Elearnmarkets
Elearnmarkets - Learn Stock Market, trading, investing for Free
No Result
View All Result
Home Technical Analysis Market Analysis Market Wrap
Nifty hourly chart

Weekly Nifty and Bank Nifty Technical Analysis: Bulls in Command

Elearnmarkets by Elearnmarkets
December 1, 2021
in Market Wrap, Market Analysis
Reading Time: 5 mins read
0
341
VIEWS
Share on FacebookShare on TwitterShare on WhatsApp

Nifty (weekly close approx. 9915.25):

Last week’s technical:

This week, on Monday, Nifty was mostly flat.

On Tuesday, Nifty corrected mostly due to sharp correction in ITC stock.

But, market recovered on Wednesday.

The Thursday and Friday saw quite volatile intraday trade in Nifty within a broader 80 points range.

Eventually Nifty closed the week with approx. 30 points of gain.

We had indicated this in our last weekly report that this week can be a week of consolidation if price closes below 5 DMA.

Join TMP Join TMP Join TMP

The market behaved in a similar fashion.

Hourly Technical:

In hourly time frame, Nifty has practically flat Bollinger bands which indicate further consolidation in a broader range of 9800 to 9930.

But Nifty can turn bullish if it breaks above 9930 zone.

On the downside, major hourly moving averages are situated in the zone 9880-9895.

But they do not hold much significance as the Nifty is stuck in a flat range for the last few days.

A decisive up or down move beyond the range will be crucial in the expiry week.

On the up-side, there is the much-awaited level of 10000 and on the downside, 100-hour moving average (presently at approx 9814.7) and 200-hour moving average (presently at approx. 9701.5) will be crucial.

The hourly ADX is losing momentum, while hourly RSI and hourly slow stochastic are range bound with bullish bias.

The hourly CCI is in the slightly overbought zone and indicating a neutral to a bullish bias.

The fact that Nifty closed near the highest point of the week, is in itself a bullish sign.

Nifty hourly chart

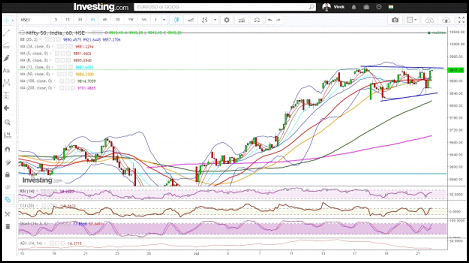
Figure: Nifty hourly chart

Daily technical:

In the daily time frame, Nifty is reasonably bullish.

This five days’ of consolidation was expected after approx 480 points of up move.

Nifty closed above all shorter-term moving averages.

On the downside, 13 DMA (presently at approx. 9812.3), 20 DMA (presently at approx. 9719.6) and 34 DMA (presently at approx. 9684.3) should be major support zones.

On the upside, the first psychological target is 10000, then 10030 to 10050.

The daily oscillators RSI, CCI and slow stochastic are showing bullish possibilities.

The next week, being an expiry week, there lies a possibility of upside breakout close to expiry.

Join: NSE Academy Certified Technical Analysis course on Elearnmarkets  to become a technical analyst expert

Nifty daily chart

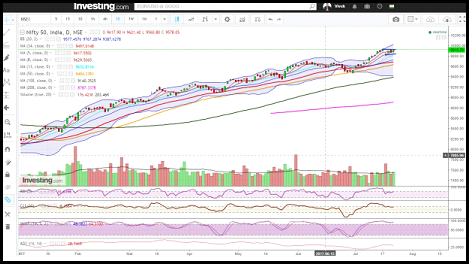
Figure: Nifty daily chart

Weekly technical:

In the weekly chart, CCI, RSI and slow stochastic are looking bullish. 100% projection of last up move from the recent low of approx. 7893.8 comes at approx. 10036 as shown in the figure.

Above that, 123.6% projection lies at approx. 10542 and 138.2% comes at approx. 10855.

These are important levels in the longer term.

Nifty weekly chart

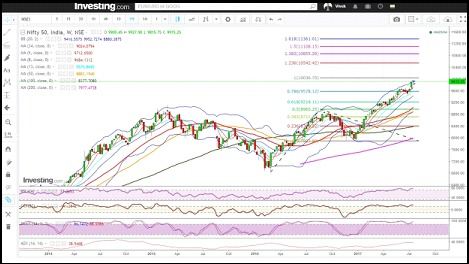
Figure: Nifty weekly chart

Nifty technical table

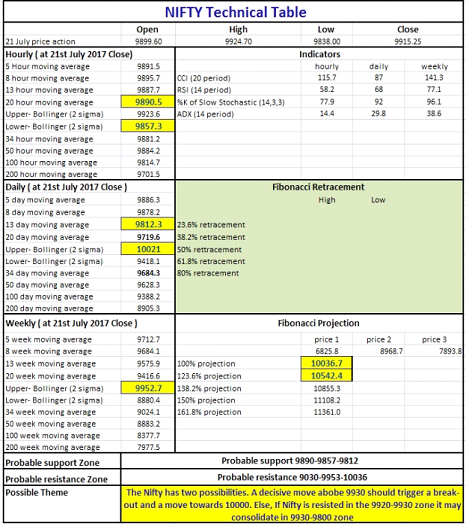
Figure: Nifty technical table

Watch the video below to  learn how to analyze the above table:

Bank Nifty (weekly close approx. 24257.05):

The Bank Nifty was in a slow and steady up move during the week. Multiple time price retraced to 20 hours and 34-hour moving averages and then eventually moved higher.

Hourly technical:

The Bank Nifty looks bullish to neutral in the hourly time frame.

This present up move is steadily being supported by 20 hourly and 34 hourly moving averages.

Any close below, 50 hourly moving average, which presently stands at approx. 24079, will give the first indication of a change of trend.

In the downside, 100-hour moving average (presently at approx. 23825.7) and 200 hour moving average (presently at approx. 23635.4) can act as support.

The hourly CCI is in bullish territory and hourly RSI and hourly slow stochastic are showing bullish to the neutral indication.

Bank Nifty hourly chart

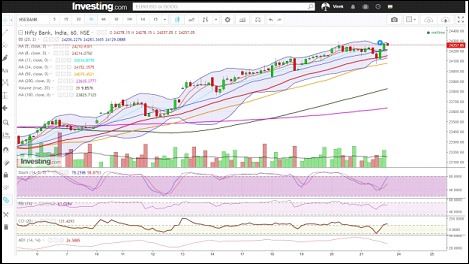
Figure: Bank Nifty hourly chart

Daily Technical:

In the daily time frame, Bank Nifty is bullish and is having a very slow and steady up move.

It is a steady move with price closing above 5 DMA for 15 days in a row.

If this move has to halt or reverse, the first indication will be provided by a close below 5 DMA which is presently situated at approx. 24132.

On the downside 8 DMA and 13 DMA are likely to act important supports which are presently situated at approx. 24022 and approx. 23824 respectively.

The daily CCI, RSI and slow stochastic are in the overbought zone and still maintaining bullish momentum.

But, any dip into the normal zone from overbought zone will indicate the possibility of fatigue or reversal.

Bank Nifty daily chart

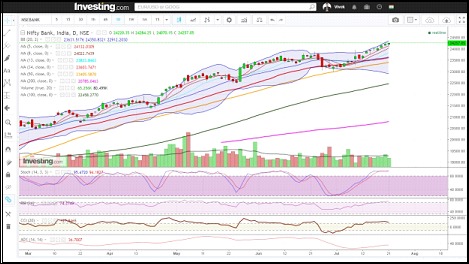
Figure: Bank Nifty daily chart

Weekly technical:

The Bank Nifty is firmly bullish in Weekly time frame.

Price has been moving up in last three week after 2-3 weeks of flattish consolidations. 100% projection of last major up move, from December low of approx. 17607 comes at approx. 24775.

Weekly slow stochastic, RSI and CCI are showing upward momentum.

If the bullish momentum is maintained, The Bank Nifty may move towards 24775 or higher in the monthly expiry week.

Bank Nifty weekly chart

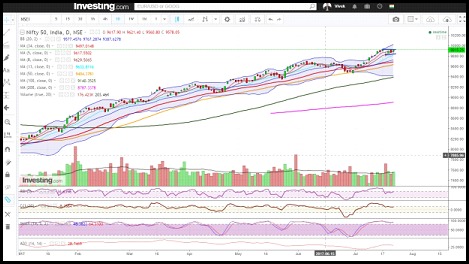
Figure: Bank Nifty weekly chart

Bank Nifty technical table

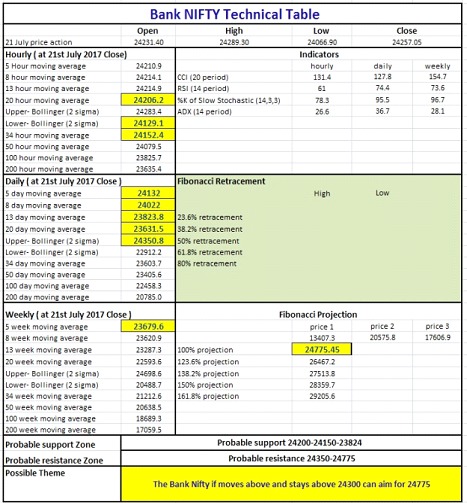
Figure: Bank Nifty technical table

In order to get the latest updates on Financial Markets visit Stockedge

Tags: english
ShareTweetSend
Previous Post

Nifty Consolidates After Wednesday’s V-Shaped Reversal

Next Post

Nifty Aims For 10000 Mark , Closes Above Resistance Zone Of 9930

Elearnmarkets

Elearnmarkets

Elearnmarkets (ELM) is a complete financial market portal where the market experts have taken the onus to spread financial education. ELM constantly experiments with new education methodologies and technologies to make financial education effective, affordable and accessible to all. You can connect with us on Twitter @elearnmarkets.

Related Posts

Hourly Chart
Market Analysis

Nifty Ends on Positive Note, Gains Approx. 475 Points on Positive Global Factors

November 18, 2020
378
Weekly Chart
Market Analysis

Huge Sell-Off Makes the Market Close in a Negative Note on the Expiry Week

November 18, 2020
175
Hourly Chart
Market Analysis

Nifty Ends in Green. Rupee Appreciates and Falling Crude Price Helped the Market to Recover Approx. 140 Point

November 18, 2020
129
Hourly Chart
Market Analysis

Sell Off Continues. Nifty Ends The Week With Three Consecutive Red Candles

November 18, 2020
141

Leave a Reply Cancel reply

Your email address will not be published. Required fields are marked *

Follow Us

Facebook-f Twitter Instagram Linkedin-in Youtube Telegram

Register on Elearnmarkets

Continue your financial learning by creating your own account on Elearnmarkets.com

Register Free Account

Download App

Categories

  • Basic Finance
  • Derivatives
  • Financial Planning
  • Fundamental Analysis
  • Technical Analysis
  • Marketshala
  • Miscellaneous

Popular On Elearnmarkets

  • Market Superheroes:
  • Vivek Bajaj
  • Chetan Panchamia
  • Ashish Kyal
  • Premal Parekh
  • Abhijit Paul
  • Jegan
  • Sivakumar Jayachadran
  • Vishal Malkan
  • Jyoti Budhia
  • Vivek Gadodia
  • Vishal Mehta
  • Piyush Chaudhry
  • Santosh Pasi
  • Gomathi Shankar
  • Market Superheroes:
  • Vivek Bajaj
  • Chetan Panchamia
  • Ashish Kyal
  • Premal Parekh
  • Abhijit Paul
  • Jegan
  • Sivakumar Jayachadran
  • Vishal Malkan
  • Jyoti Budhia
  • Vivek Gadodia
  • Vishal Mehta
  • Piyush Chaudhry
  • Santosh Pasi
  • Gomathi Shankar
  • Courses:​
  • Options Trading
  • Dow Theory
  • Momentum Trading
  • Stock Investing
  • Stock Market for Beginners
  • Harmonic Chart Patterns
  • Algo Trading
  • Elliot Wave Theory
  • Advanced Excel
  • Cryptocurrency
  • NSE Certification Course
  • Courses:​
  • Options Trading
  • Dow Theory
  • Momentum Trading
  • Stock Investing
  • Stock Market for Beginners
  • Harmonic Chart Patterns
  • Algo Trading
  • Elliot Wave Theory
  • Advanced Excel
  • Cryptocurrency
  • NSE Certification Course
  • Webinars:
  • Bank Nifty Scalping
  • Intraday Trading Strategies
  • Options Trading Strategies
  • Options selling
  • Price Action
  • Relative Strength
  • Tax Planning
  • Options Buying
  • Growth Stocks
  • Portfolio Management
  • Relative Strength Index
  • Risk Management
  • Renko Charts
  • Crude Oil
  • Traders Psychology
  • Moving Average
  • Multibagger Stocks
  • Free Learning Modules:
  • Intraday Trading
  • Options Scalping
  • Swing Trading
  • Financial Modelling
  • RSI Indicator
  • Bollinger Bands
  • Pricing of Futures
  • Personal Finance
  • Initial Public Offerings (IPO)
  • Value Investing
  • Technical Indicators
  • Candlesticks
  • Chart Patterns
  • Option Greeks
  • ELSS Funds
  • Banking and Insurance
  • Real Estate
  • Gold
  • Book Summaries:
  • Rich Dad Poor Dad
  • Psychology of Money
  • The Intelligent Investor
  • The Richest Man in Babylon
  • Think and Trade Like a Champion
  • Value Investing and Behavioural Finance
  • Trading in the Zone
  • Learn to Earn
  • Book Summaries:
  • Rich Dad Poor Dad
  • Psychology of Money
  • The Intelligent Investor
  • The Richest Man in Babylon
  • Think and Trade Like a Champion
  • Value Investing and Behavioural Finance
  • Trading in the Zone
  • Learn to Earn
  • Tools:
  • CAGR Calculator
  • SIP Calculator
  • eLearnOptions
  • Future Value Calculator
  • Present Value Calculator
  • Atal Pension Yojana
  • Cost of Delay Calculator
  • Become a Crorepati
  • Tools:
  • CAGR Calculator
  • SIP Calculator
  • eLearnOptions
  • Future Value Calculator
  • Present Value Calculator
  • Atal Pension Yojana
  • Cost of Delay Calculator
  • Become a Crorepati

© 2023 Elearnmarkets. All Rights Reserved

  • Visit Elearnmarkets
  • Courses
  • Webinars
  • Financial Guides
  • Get Free Counselling
  • Visit Elearnmarkets
  • Courses
  • Webinars
  • Financial Guides
  • Get Free Counselling

Get Elearnmarkets App

No Result
View All Result
  • Article Categories
    • Basic Finance
    • Derivatives
    • Financial Planning
    • Fundamental Analysis
    • Technical Analysis
    • Marketshala
    • Miscellaneous
  • Language
    • Hindi
    • Bengali
    • English
  • Courses
  • Webinars

© 2020 Elearnmarkets All Rights Reserved

Suggested Learning

Technical Analysis Made Easy

Certification in Online Technical Analysis

Online NSE Academy Certified Capital Market Professional (E-NCCMP)