Nifty close 11143.10: Friday’s market could be a night mare for the stock market participant. On this day Nifty nearly crashed 400 points and it went below 10900 mark but swiftly recovered from that level and managed to close above 11100. But Nifty is still below 11150 mark that was the initial support for the index from its previous trading level. Huge sell off in financial sector, High oil price and regular fall in rupee have been suspected as a major reason of this sharp fall.
Now the benchmark index is trading at its crucial support level which 11100 mark. Closing below this level could bring major sell off for the upcoming trading days.
However, for the short term market may face resistance at 11350 level and for support it will be 11100 level.
Hourly Technical: In the Hourly Chart Nifty is in a downtrend so as per the trend Nifty likely to remain in the same trend or it will consolidate for few trading hours.
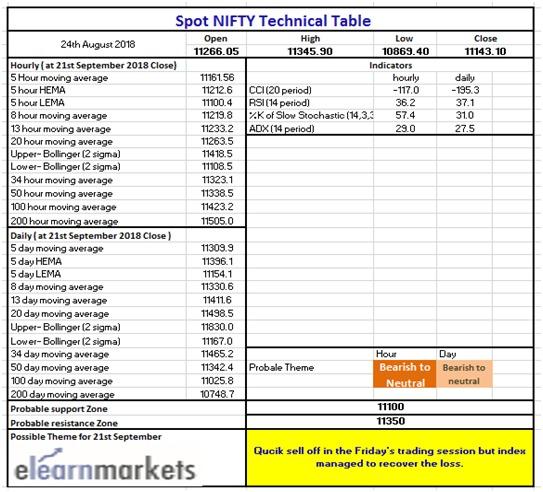
Because of this sudden shortfall all indicators are in a phase of recovery. Most of them are bouncing back from the oversold level. RSI is at level 36 (approx..), Stochastic is just above 50, ADX is above 28 and CCI is below -100.
So as per the position of the indicator, Nifty may follow its previous trend or it will consolidate as we mentioned earlier.
11100 is going to be the initial support and for the 11350 is going to react.

(Hourly chart)
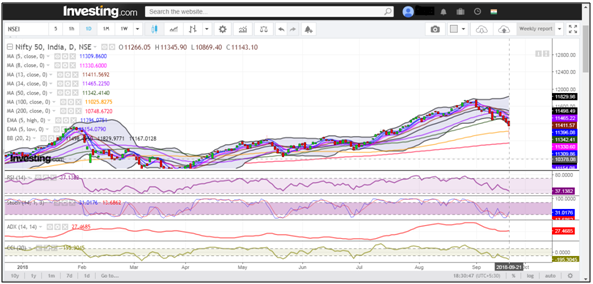
Daily Technical: In the Daily chart of Nifty the huge sell off is nothing but a spike because of the quick recovery. However, Nifty is in a downtrend in the daily chart and there is high chance to continue the prevailing trend. There is also a high chance for the index to consolidate for short term.
Let’s discuss the indicators. RSI is below 40, Stochastic is coming out from its oversold level, ADX is above 25 and CCI is below -190.
Indicators are suggesting the trend likely to continue until the index close above 11350 level. Closing above this level may bring the bulls back in the market. Just like the hourly chart Nifty is likely to take support from 11100 level in case of another short fall.

(Daily chart)
Weekly Technical: In the weekly chart it is clearly visible that the benchmark index has taken support from its previous swing high which is present at around 11100 level and the index is in a phase of correction within a strong uptrend. This can be called as normal pullback.
The candle size is pretty big compare to other candles this is the only factor that is raising tension.
In the weekly chart Nifty is likely to face resistance at 11550 to 11600 level and for the support it could be 11100 and 10800 level.
The indicators are taking a sharp dip in the weekly chart. RSI is just below its 55 level, Stochastic is below 50, ADX is below 25 and the CCI is near its 0 level but is in the positive zone.
So overall it is phase of correction and as per the technical we can see the trend line is not broken. It just pulled back near that trend line level.
For longer term we are expecting market is likely to stay bullish but for short term either correction or consolidation may take place.

(Weekly chart)
You can use stockedge app to get cutting edge over others in both short term trading and investing. Here you not only get data at one particular place but can also create your own based on your own technical and fundamental parameter. See the video below to know about various features in Stockedge app.

(Technical Table)


