Nifty (weekly close approx. 9886.35):
Last week’s technical:
This week market opened gap-up above the previous resistance at approx. 9710 and bounced from hourly 20-period moving average at approx. 9668.
This was a good entry point for long trade as the 9710 resistance was broken in the morning and market was kind enough to give entry lower at the hourly mid-Bollinger line.
This was a very low-risk entry.
Then the market started going up and by afternoon it broke above 9720.
Someone could have taken a long entry even then, as the market was breaking above resistance zone of approx. 9700-9710.
The market moved higher to approx 9829.
After that, till Wednesday afternoon there was a flattish consolidation prices came close to 20 hours moving average at approx 9788 and then it moved up till 9908.
Friday saw a gap-up and open, the opening price eventually became high for the entire day.
Moreover, there was a bearish engulfing pattern.
Someone, who had sold at the close of the first-hour candle, could have made quick 35 points in Nifty to approx. 9845.
Again market moved 35-45 points up from hourly mid-Bollinger during the day itself.
So market gave good entries at logical levels multiple times during the week.
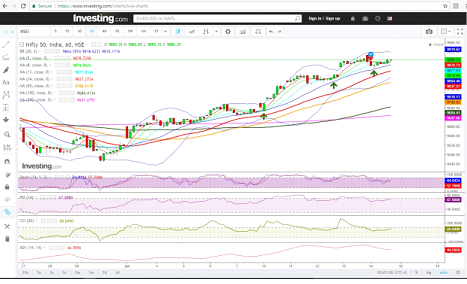
Nifty hourly chart
Next week’s technical possibilities:
The Nifty closed the week on a bullish note.
It has been closing above the 5 days moving average for last two weeks.
In this rally, which started from December 2016, we can see that Nifty has consolidated after every 200-400 points of rallies.
Hence there is the possibility of consolidation next week.
But, that will happen if the market suddenly goes sideways or price closes below 5-day moving average which presently stands at approx. 9878 or below 34 hourly moving average, which presently stands at approx 9838.
Simultaneously we have to look-out for hourly CCI going below 50, or daily CCI moving below 0 or fast stochastic and RSI moving back to the normal zone from overbought level.
We should keep on looking for bearish candlestick reversal pattern formation in the daily chart.
On the other hand, there is a good possibility that the market may continue the uptrend and move higher towards psychologically important 10000 level in Nifty.
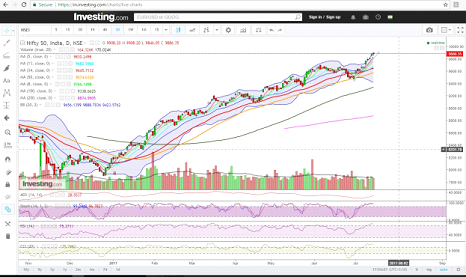
Nifty daily chart
Longer-term possibilities based on probable Elliott wave counts
If we look at longer term charts, we can see that 100% projection of last up move (approx 6825 to approx.8968) from the recent low of approx 7894 comes at approx 10036. Hence it is possible that the market moves towards it and eventually beyond this point.
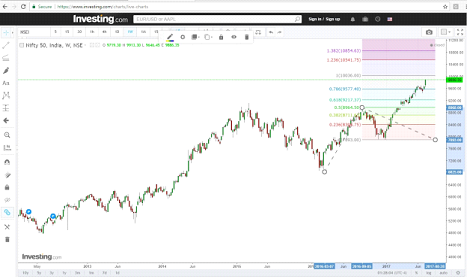
Nifty weekly chart
We have drawn a possible set of Elliott Wave count in the monthly chart below.
As we can see, we are in the midst of a probable 3rd wave, within major wave 3 in progression.
The Major 3rd Wave is approaching 1.618% of the major wave 1 (920 to 6357), towards approx. 11049.
Again wave, within major wave was normal, i.e. just approx. 1.12% (i.e. normal, not extended) of the wave within, there is a possibility that the ongoing may be extended.
The 61.8% extension of to is 11068.
But, an extended can take Nifty beyond that, but we have to look at the internal wave of for this cancellation if Nifty breaches 11000 with force.
Elliot wave counts are subject to change with market movement.
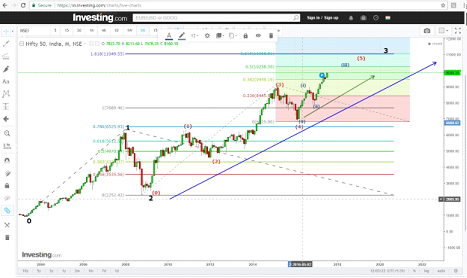
Nifty monthly chart
Bank Nifty (weekly close approx. 23937.7):
Last week’s technical:
Bank Nifty opened on Monday with a gap up, breaking out from the small consolidation range.
Then Bank Nifty retraced to 23512 which was close to the hourly mid-Bollinger line and from there rallied around approx. 200 points.
Then again price retraced towards 34 hourly moving average and bounced again (approx 23520 to 23940).
Then again on Friday, Bank Nifty came near to hourly mid-Bollinger line approx 23736 and bounced 180-200 points by day end.
So, even Bank Nifty was very much trending this week and gave multiple opportunities based on hourly support zones.
But still, Bank-Nifty is lagging behind Nifty in this leg of the market.
While Bank Nifty has closed near the previous top, Nifty has moved much beyond.
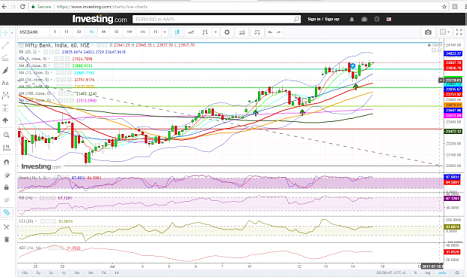
Bank Nifty hourly chart
Next week’s technical possibilities:
There is a possibility that Bank Nifty breaks out next week above previous resistance zone.
Daily CCI has moved above 100 and daily fast stochastic is in overbought zone.
If that happens Bank Nifty may move towards approx. 24425 which is 100% projection of last up move from approx. to approx. 23898, projected from recent low approx. 22996.
On the downside 20 dma and 34 dma may act as a support in 23480-23520 zone.
Below that, 50 dma, presently at approx. 23266, may act as a strong support.
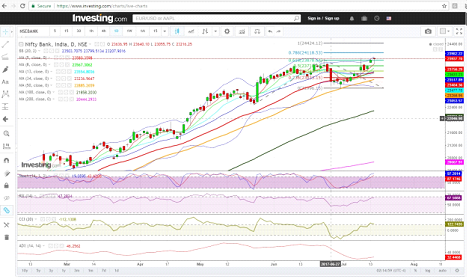
Bank Nifty daily chart
Longer-term possibilities based on probable Elliott wave counts:
As we can see in the chart below, according to the probable we count we are within (3) within major wave 5.
The 61.8% projection of move from 0 to 3, from the bottom of 4 comes at approximately 24280.
But as wave 3 was just approx 1.3 times of wave 1 (normal not extended) and also looking at the internal waves of ongoing major wave 5, we can assume that 5 is likely to be an extended 5th wave.
Also 100% projection of move from to, from the bottom of comes at approx. 24776.
Elliot wave counts are subject to change with market movement.
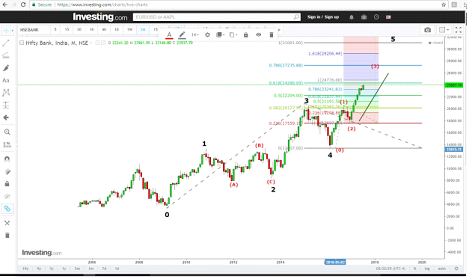
Bank Nifty Monthly chart
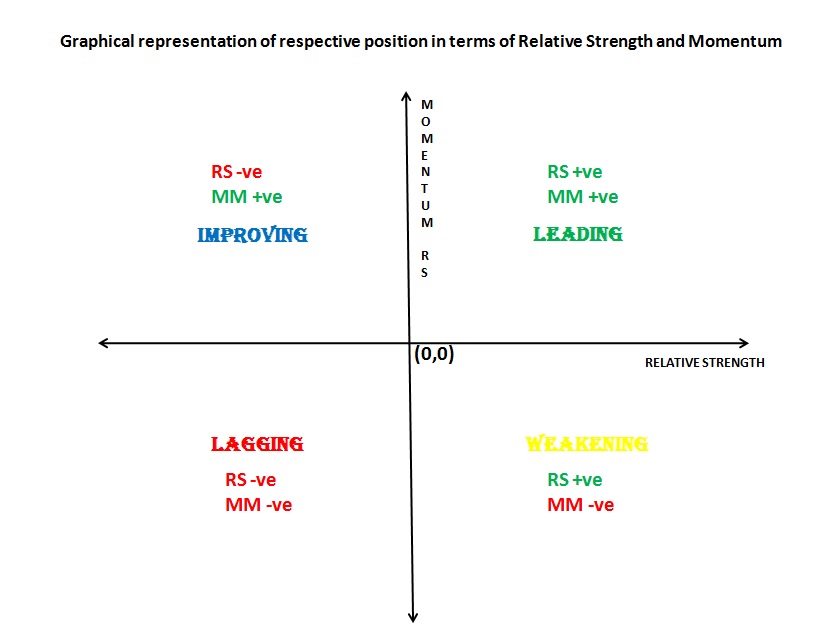
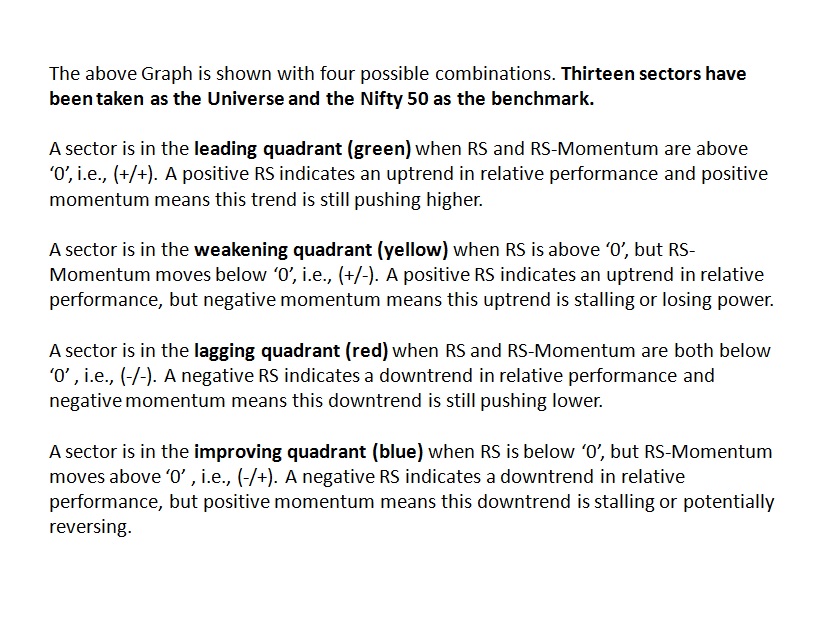
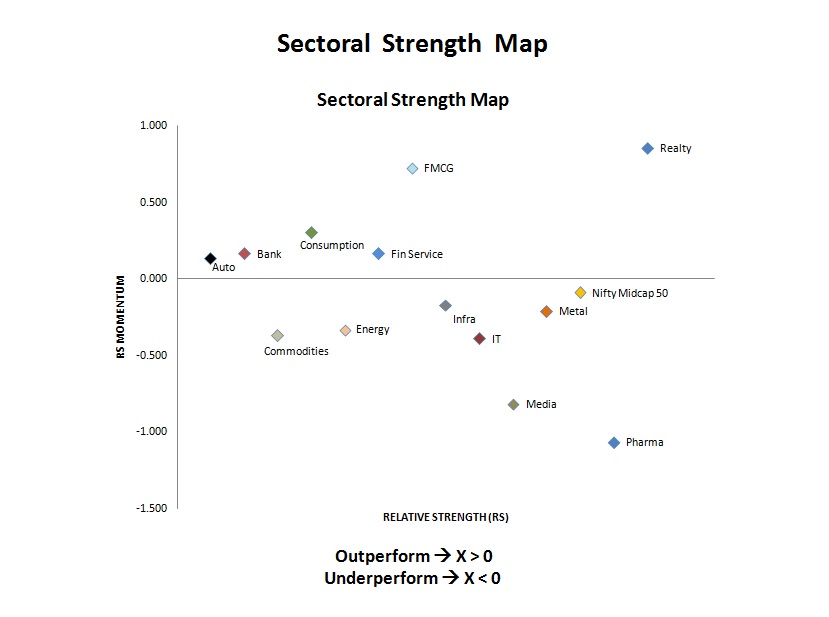
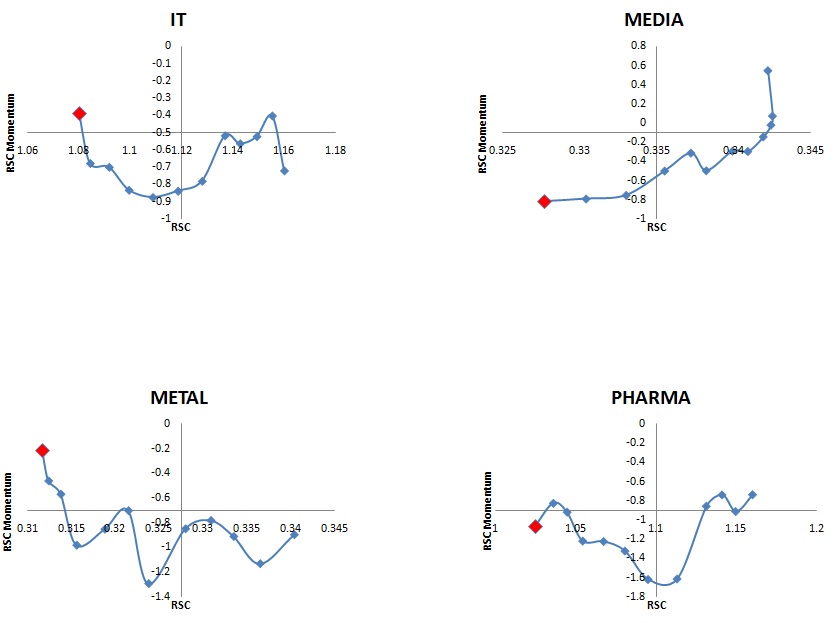
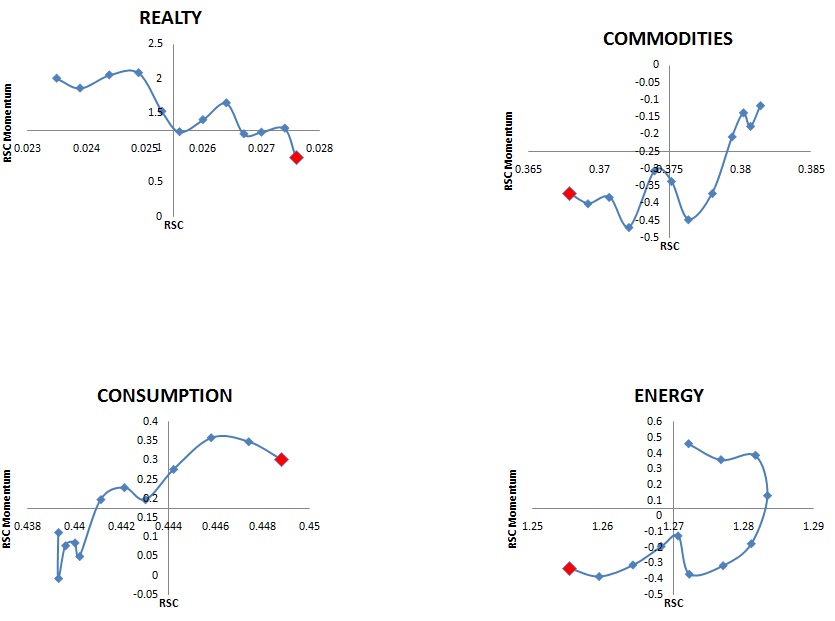
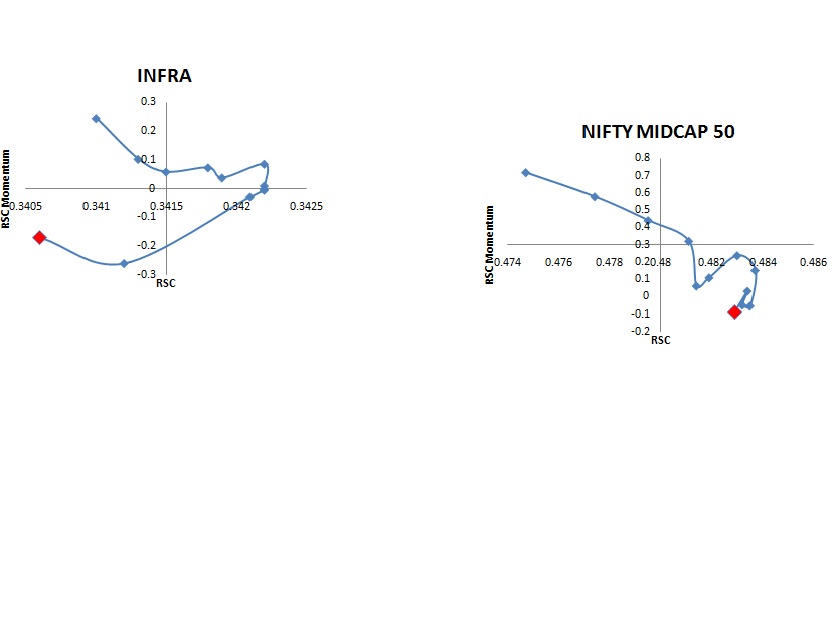
Below we give you a snapshot of relative strength and weakness ofthe entire market during last week. The classification is broadly based on sectoral strength and weakness.


