Elearnmarkets - Financial Market Learning
  • Categories
    • Basic Finance
    • Derivatives
    • Financial Planning
    • Fundamental Analysis
    • Technical Analysis
    • Marketshala
    • Miscellaneous
  • Language
    • English
    • Hindi
    • Bengali
No Result
View All Result
  • Courses
  • Webinars
  • Learn On Elearnmarkets
Elearnmarkets - Learn Stock Market, trading, investing for Free
No Result
View All Result
Home Technical Analysis Market Analysis Market Wrap
Nifty hourly

Nifty Consolidates After Wednesday’s V-Shaped Reversal

Elearnmarkets by Elearnmarkets
March 24, 2022
in Market Wrap, Market Analysis
Reading Time: 2 mins read
0
147
VIEWS
Share on FacebookShare on TwitterShare on WhatsApp

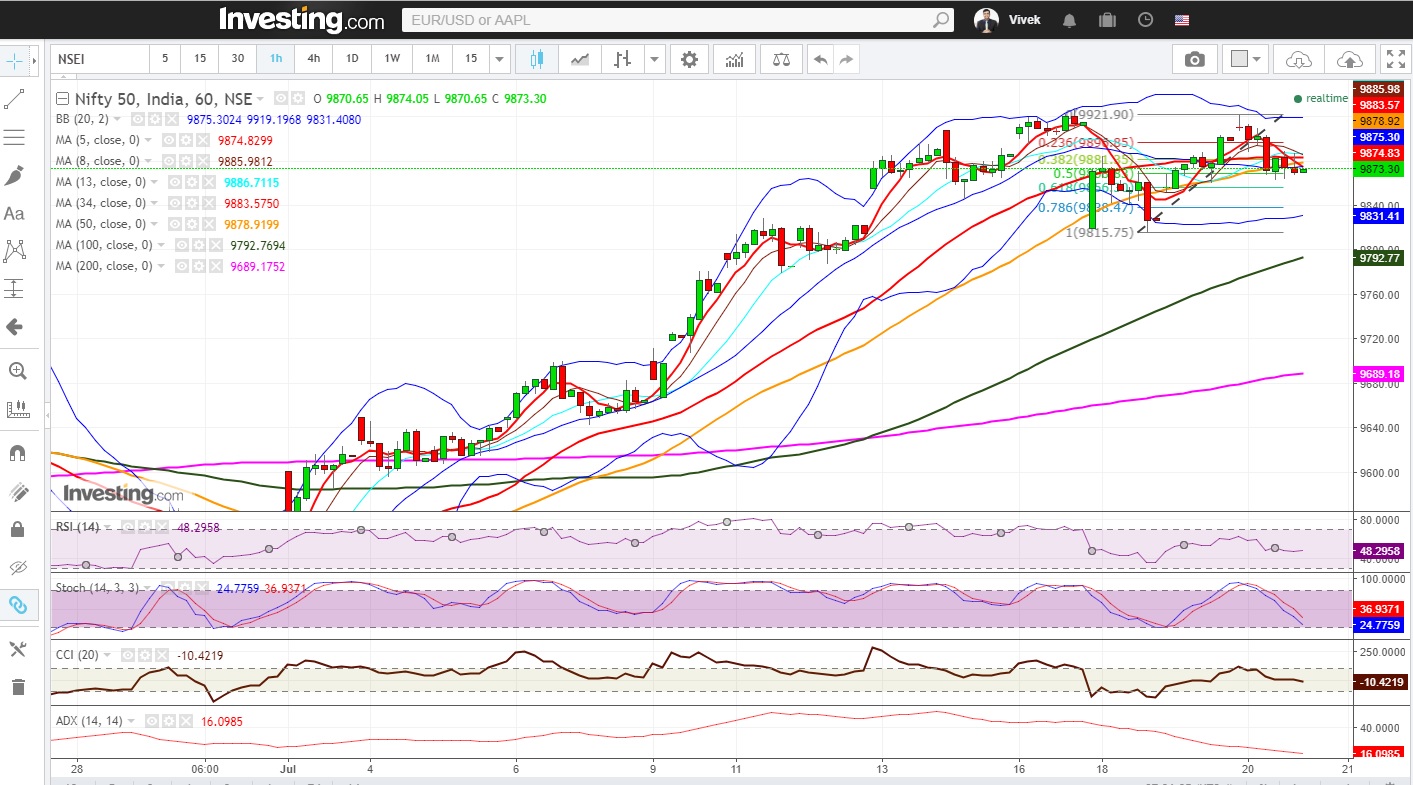
Nifty (close approx. 9873.30): Nifty opened gap-up today after yesterday’s up move and the day-high was formed in first hour of trading at approx. 9921.90, very close to all time high.
Hourly technicals : The Nifty formed a shooting star candlestick reversal pattern in hourly chart in the very first hour of the day and drifted down steadily. Towards the end of the day, it consolidated near 50 hourly moving average, which is presently at approx. 9878.9. The hourly Bollinger is practically flat and hourly ADX is indicating fatigue in the momentum. For tomorrow, hourly upper (approx. 9919) and lower (approx. 9831) Bollinger band levels should provide important resistance and support. Also, 61.8% retracement of last major rise from approx. 9815.75 to approx. 9921.9 lies at approx. 9856.30. Below that, 100 hour moving average, which is presently at approx. 9792.8 is important level to watch out.

On the other hand, if there is a breakout above 9930, the Nifty can aim for 10000. Hourly CCI and RSI are also close to mid-point of their respective normal range and hourly slow stochastic is close to bottom of normal range. Tomorrow being a Friday and only 5 days remaining for July series expiry, Nifty may consolidate for next 2-3 days between 9800 to 9930 zone.

Nifty hourly
Figure: Nifty hourly chart
Daily technicals: Nifty closed between 5 dma (at approx. 9880.5) and 8 dma (at approx. 9862). On the upside 9930 and 10000 are important levels to watch out for. On the down side, 13 dma is at approx. 9789.1, which should act as a good support. The mid-Bollinger line (20 dma) stands at approx. 9705.3.
The daily slow stochastic is still in overbought territory and the daily RSI and CCI are just inside their normal range after Thursday’s price action. Overall, Nifty remains bullish to neutral, in the daily time-frame based on daily technical parameters.Figure :Nifty daily chart

At present, with 5 trading sessions remaining for July expiry, 9900 call saw approx. 9 lakh additions and 9800 put saw approx. 2.5 lakh addition in open interest. 9800 put now has approx. 65 lakh and 9900 call and 10000 call has approx 52 lakh and 71 lakh open interest. Hence, Nifty may choose to consolidate in next two to three trading sessions. But, a sharp price move in either direction will require revisit of technical parameters.

NIFTY option analysis

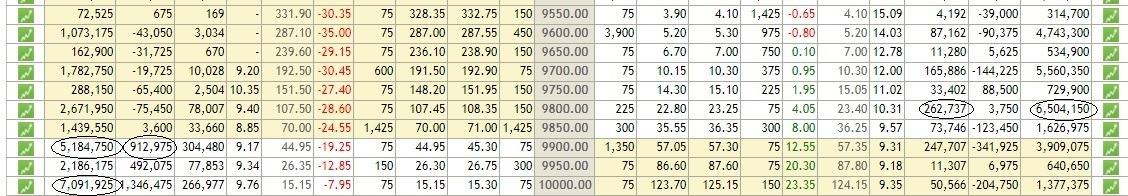
Figure: Nifty options data, source www.nseindia.com

Join TMP Join TMP Join TMP

Figure : Nifty technical Table

Tags: english
ShareTweetSend
Previous Post

Nifty shrugged off ITC induced Tuesday sell-off in a bullish move on Wednesday, closes above 5 DMA

Next Post

Weekly Nifty and Bank Nifty Technical Analysis: Bulls in Command

Elearnmarkets

Elearnmarkets

Elearnmarkets (ELM) is a complete financial market portal where the market experts have taken the onus to spread financial education. ELM constantly experiments with new education methodologies and technologies to make financial education effective, affordable and accessible to all. You can connect with us on Twitter @elearnmarkets.

Related Posts

Hourly Chart
Market Analysis

Nifty Ends on Positive Note, Gains Approx. 475 Points on Positive Global Factors

November 18, 2020
378
Weekly Chart
Market Analysis

Huge Sell-Off Makes the Market Close in a Negative Note on the Expiry Week

November 18, 2020
175
Hourly Chart
Market Analysis

Nifty Ends in Green. Rupee Appreciates and Falling Crude Price Helped the Market to Recover Approx. 140 Point

November 18, 2020
129
Hourly Chart
Market Analysis

Sell Off Continues. Nifty Ends The Week With Three Consecutive Red Candles

November 18, 2020
141

Leave a Reply Cancel reply

Your email address will not be published. Required fields are marked *

Follow Us

Facebook-f Twitter Instagram Linkedin-in Youtube Telegram

Register on Elearnmarkets

Continue your financial learning by creating your own account on Elearnmarkets.com

Register Free Account

Download App

Categories

  • Basic Finance
  • Derivatives
  • Financial Planning
  • Fundamental Analysis
  • Technical Analysis
  • Marketshala
  • Miscellaneous

Popular On Elearnmarkets

  • Market Superheroes:
  • Vivek Bajaj
  • Chetan Panchamia
  • Ashish Kyal
  • Premal Parekh
  • Abhijit Paul
  • Jegan
  • Sivakumar Jayachadran
  • Vishal Malkan
  • Jyoti Budhia
  • Vivek Gadodia
  • Vishal Mehta
  • Piyush Chaudhry
  • Santosh Pasi
  • Gomathi Shankar
  • Market Superheroes:
  • Vivek Bajaj
  • Chetan Panchamia
  • Ashish Kyal
  • Premal Parekh
  • Abhijit Paul
  • Jegan
  • Sivakumar Jayachadran
  • Vishal Malkan
  • Jyoti Budhia
  • Vivek Gadodia
  • Vishal Mehta
  • Piyush Chaudhry
  • Santosh Pasi
  • Gomathi Shankar
  • Courses:​
  • Options Trading
  • Dow Theory
  • Momentum Trading
  • Stock Investing
  • Stock Market for Beginners
  • Harmonic Chart Patterns
  • Algo Trading
  • Elliot Wave Theory
  • Advanced Excel
  • Cryptocurrency
  • NSE Certification Course
  • Courses:​
  • Options Trading
  • Dow Theory
  • Momentum Trading
  • Stock Investing
  • Stock Market for Beginners
  • Harmonic Chart Patterns
  • Algo Trading
  • Elliot Wave Theory
  • Advanced Excel
  • Cryptocurrency
  • NSE Certification Course
  • Webinars:
  • Bank Nifty Scalping
  • Intraday Trading Strategies
  • Options Trading Strategies
  • Options selling
  • Price Action
  • Relative Strength
  • Tax Planning
  • Options Buying
  • Growth Stocks
  • Portfolio Management
  • Relative Strength Index
  • Risk Management
  • Renko Charts
  • Crude Oil
  • Traders Psychology
  • Moving Average
  • Multibagger Stocks
  • Free Learning Modules:
  • Intraday Trading
  • Options Scalping
  • Swing Trading
  • Financial Modelling
  • RSI Indicator
  • Bollinger Bands
  • Pricing of Futures
  • Personal Finance
  • Initial Public Offerings (IPO)
  • Value Investing
  • Technical Indicators
  • Candlesticks
  • Chart Patterns
  • Option Greeks
  • ELSS Funds
  • Banking and Insurance
  • Real Estate
  • Gold
  • Book Summaries:
  • Rich Dad Poor Dad
  • Psychology of Money
  • The Intelligent Investor
  • The Richest Man in Babylon
  • Think and Trade Like a Champion
  • Value Investing and Behavioural Finance
  • Trading in the Zone
  • Learn to Earn
  • Book Summaries:
  • Rich Dad Poor Dad
  • Psychology of Money
  • The Intelligent Investor
  • The Richest Man in Babylon
  • Think and Trade Like a Champion
  • Value Investing and Behavioural Finance
  • Trading in the Zone
  • Learn to Earn
  • Tools:
  • CAGR Calculator
  • SIP Calculator
  • eLearnOptions
  • Future Value Calculator
  • Present Value Calculator
  • Atal Pension Yojana
  • Cost of Delay Calculator
  • Become a Crorepati
  • Tools:
  • CAGR Calculator
  • SIP Calculator
  • eLearnOptions
  • Future Value Calculator
  • Present Value Calculator
  • Atal Pension Yojana
  • Cost of Delay Calculator
  • Become a Crorepati

© 2023 Elearnmarkets. All Rights Reserved

  • Visit Elearnmarkets
  • Courses
  • Webinars
  • Financial Guides
  • Get Free Counselling
  • Visit Elearnmarkets
  • Courses
  • Webinars
  • Financial Guides
  • Get Free Counselling

Get Elearnmarkets App

No Result
View All Result
  • Article Categories
    • Basic Finance
    • Derivatives
    • Financial Planning
    • Fundamental Analysis
    • Technical Analysis
    • Marketshala
    • Miscellaneous
  • Language
    • Hindi
    • Bengali
    • English
  • Courses
  • Webinars

© 2020 Elearnmarkets All Rights Reserved

Suggested Learning

Technical Analysis Made Easy

Certification in Online Technical Analysis

Online NSE Academy Certified Capital Market Professional (E-NCCMP)