Nifty close 10472.50: This week Nifty traded in a range bound zone. Thursday trading session was the shock for the traders but On Friday Nifty recover the 238(approx.) points. RBI liquidity injection and fall in crude prices push the market sentiment which influenced the Index to give a positive close.
But in other hand Nifty is still below 10500 mark which is a psychological resistance level and below this level it is a bear territory. To continue its bullish sentiment Nifty has to give a positive close above 10550 level. But in case of further down fall 10000 mark is going to act as a support for the Index.
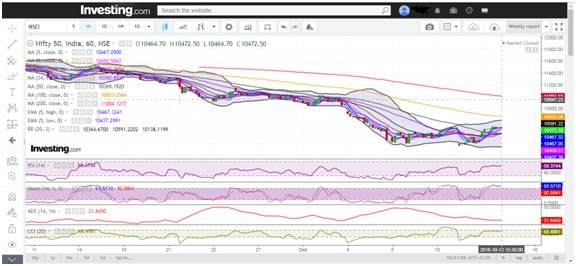
Hourly Technical: As per the hourly chart the index is in verge of 10500 mark. As we mentioned it is a crucial resistance level and we can see the candle sizes are getting smaller as Nifty heading toward this level.
If the index crosses this level (10500) 10650 mark will be the another stepping stone which is going to be the important resistance level. In case of more down fall 10350 and 10200 will be the major support for the index.
Let’s look at the Indicators, RSI is near its 60 level, Stochastic is above 90 (overbought), ADX is above 20 and the CCI is trading in its normal territory (approx. 68.49).
So, the Indicators position are suggesting that the momentum is building up but not so much, where the price is in the overbought condition.
Consolidation likely to take place if the index opens at the same level (previous closing), in case of gap up opening there is a chance of further up move.

(Hourly chart)
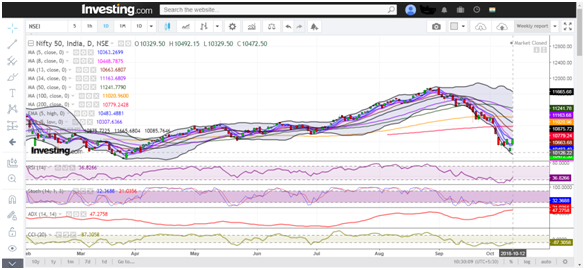
Daily Technical: As we mentioned earlier this week Nifty has traded in a range bound zone. Closing above 10500 mark will bring back the buyer’s confidence about the market. By seeing the closing candle (Friday), we can expect that the prevailing sentiment may change soon.
In technical, RSI is above 35, Stochastic is also above 30, ADX is just below 50 and the CCI is trading at -87.70 (approx.).
So overall the indicators are getting back to their normal zone, strength is easing but it is still in a high level (ADX). Chance of Indecisionahead.

(Daily chart)
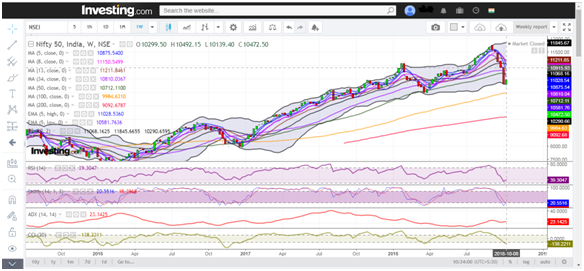
Weekly Technical: It is the first time Nifty ends in positive note after the 5 consecutive red candles. In the weekly chart it is a pullback from a support level (10200). If we look closely there is a hidden divergence in the weekly chart (Price is making higher lows or similar low but the indicator is making lower low, it is a bullish sign but it does not perform well as our conventional divergence does) so it is expected that the sentiment is going to change soon and Nifty will start recover the losses.
Most of the indicators are in a phase of bounce back, RSI is below 40, Stochastic is at 20.59 (approx), ADX is just below 25 and the CCI is below -100 mark.
So as per the technical bounce back was expected and it happened. But important thing is it will continue its recovery or not?
In the weekly chart support came from 10150 to 10200 level so we can expect that these recent support is going continue back the index but if the further fall takes place 10000 is going to act. For resistance 10600 mark and in case of further up move 10800 will react.

(Weekly chart)
You can use stockedge app to get cutting edge over others in both short term trading and investing. Here you not only get data at one particular place but can also create your own combination scans based on your own technical and fundamental parameter. See the video below to know about various features in Stockedge app.

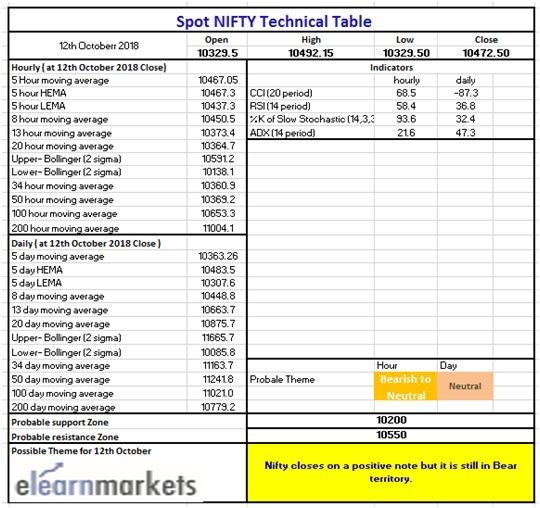
(Technical Table)


Thanks For Information.
Welcome