Nifty close 10030.00: From the last two months the market is witnessing continuous sell off. This is the 1750 (approx) points correction from the beginning of the September month. We have previously mentioned that the prolonged weakness in the rupee, high crude oil price and the trade war have been the major reason behind this market correction. FII has pulled off more than approx Rs.25000 crore from the Indian equity market within last two month and other global economical factors are also supporting the bears.
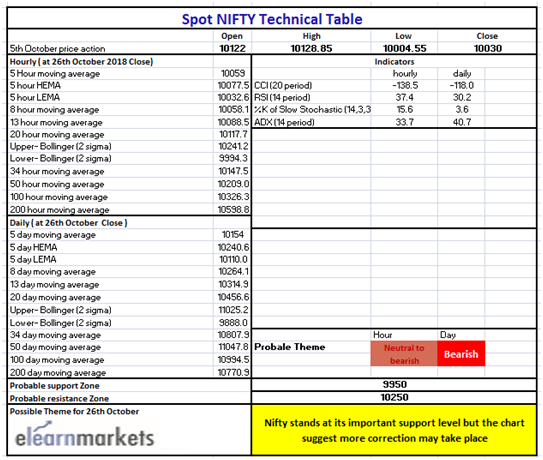
At the end of the October expiry the market is standing at its very important support level which is at 10000 level. Below this there is another support from 10800 mark. Resistance is at 10200 level. The recent market scenario depict that market has high chance to sink below this support level.
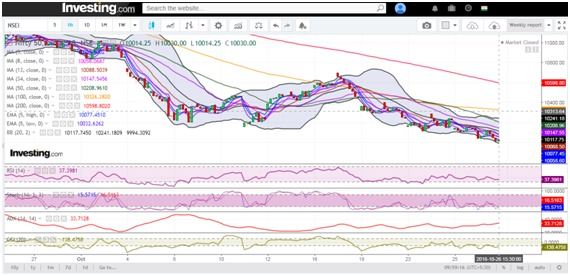
Hourly Technical: In the Hourly chart it is a clear downtrend with a little twist. Positive divergence is present the chart but this is too weak for the recent market condition but chance of a pullback is expected.
In the technicals, RSI is at below 40, stochastic is below its oversold level, ADX is above 30 and the CCI is near its -140 level.
So Indicators are suggesting that the market is in a week phase and according to the divergence in the RSI indicator a little pullback towards 10150 mark is possible.
In case of the up move, 10150 mark is going to act as a Resistance level where as 10000 mark is being the important support for the Index.

(Hourly chart)
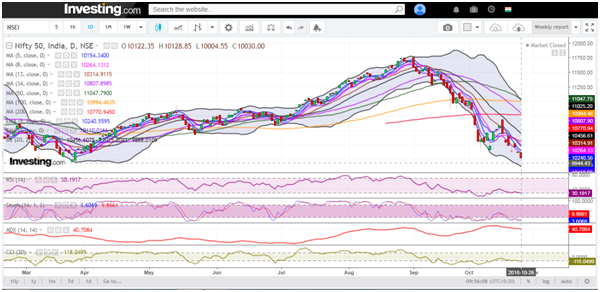
Daily Technical: In the weekly chart the nifty has a made a small bearish belt hold pattern which suggests further down side may take place. As we have mentioned earlier, as per the current market condition we are standing at a verge of important support. The immediate support after the 10000 mark is 9950 and 9800. The resistance would be 10250 mark for the index.
Lets, discuss the indicator. RSI is at its 30 mark, Stochastic is below 10 (Oversold), ADX is at 40 and the CCI is near its -120 level.
So indicators are in the oversold level but a little positive sign is building up in the chart. Price is making lower lows but RSI is either trading higher or staying at the same level. As a result there could be a pullback in the upside. But overall market sentiment is pretty much bearish so in the long term how much effective this pullback would be, this is questionable.

.
(Daily chart)
Weekly Technical: The market closes just above the 100 MA line (presently at 10026.08 mark). This is the initial support for the index. But by seeing the candles size we can easily understand that the fear is at play and more down side is possible.
10800 level is the support for the index and 10250 is going to act as resistance in case of any upside.
Lets talk about the indicator, RSI is just above 30, Stochastic is super oversold level (presently at 1.44), ADX is flat (presently at 23.14 approx) and the CCI is below -150.
It is very clear that the market is in no mood to bounce back immediately and it is extremely bearish. If any bounce back happens it would be only because of 10000 mark and 100MA line.

(Weekly chart)
You can use Stockedge app to get cutting edge over others in both short term trading and investing. Here you not only get data at one particular place but can also create your own combination scans based on your own technical and fundamental parameter. See the video below to know about various features in Stockedge app.

(Technical Chart)


