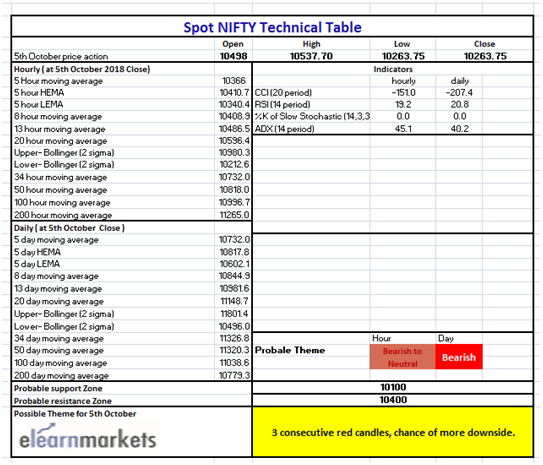
Nifty close 10263.75: This is one of the sharpest corrections the market has ever witnessed. Every macro and micro factors are working against the index. Rupee is depreciating, crude oil is trading at its 4year high and sharp rise in U.S treasury yield. These are the major factors behind this sharp correction of the index.
Nifty closes this week on a negative note (approx. 10263) and consecutive three red candles has been formed in the daily chart by the benchmark index. Market totally in the favour of bears and further down side is possible. In the monthly chart Nifty is trading below its mid Bollinger line (approx.10327.56) and this line was the strong support for the index. So now this will work as a resistance for the index and for support, we are expecting 10000 to 10050 levels will work.
By considering the strength of the downfall it can be expected that the index could take a dip below the 10000 mark and if that is happen 9700 level likely to act as a support.
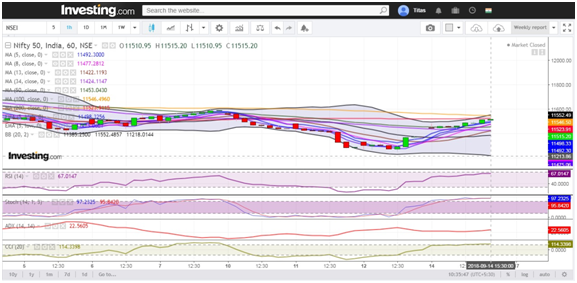
Hourly Technical: As we can see from the hourly chart, the major fall took place in just one candle and it is 200 (approx.) points fall. Technically it is a bearish engulfing candle and as per theory market likely to continue its downfall.
Lower Bollinger band could act as a support level for further correction and presently it is at 10212.55 (approx.) .Due to the presence of 8 and 5 EMA lines Nifty likely to face resistance at 10350 to 10400 levels in case of any pull back.
Lets discuss the indicator, RSI is below 20, Stochastic is trading flat because it is at 0 level, ADX is super high], it is at 45 (approx.) and CCI is below -150.
Overall, strength (ADX) of the downfall is very high and in case of further downfall this would be the one of the major technical factor.

(Hourly chart)
Daily Technical: In the daily chart the index is below all the important moving average lines so there is no initial support for the index except the psychological support levels. 10000 mark is the key psychological support level for the index.
Last three candles are the red candles and size of the candles is large. Fear is in the driver sit and bears will likely to continue the run so immediate bounce back is not expected. But in case the pull back happen 10350 level will work as a resistance.
Most of the indicators are in the oversold level. RSI is at 20 (approx), Stochastic is at 0 level, ADX is very strong and it is at its 40 level (approx.), CCI is -207.
So it is a clear picture and it is important to mention just because it is in a super oversold area we should not jump into the market with all our money. Because no one knows the actual bottom of this correction so we should wait for the market to cool down or else we can go for systematic investment.
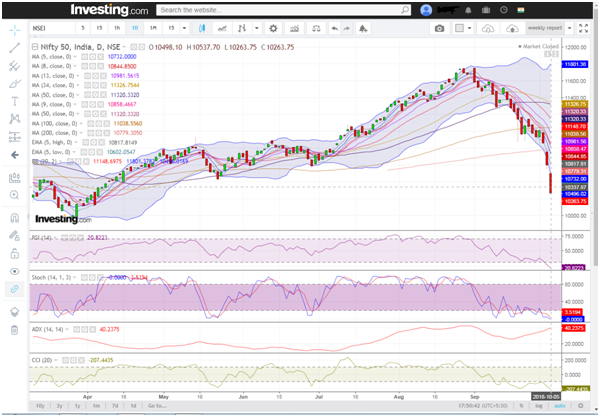
(Daily chart)
Weekly Technical: Index is below the lower Bollinger line in the weekly chart and most of the short term MA lines are above the current market price where only 100 (9962.34 approx.) and 200 (9072.54 approx.) MA lines are below the price. They are expected to act as a support level in case of more down side.
As per the price indicators are also taking a sharp dip, RSI is 34 (approx), Stochastic is at 0, ADX is above 20 and CCI is below -110.
No immediate pull back is expected as per the indicator position but little chance of consolidation can be expected from the market due to the huge sell off on Friday’s trading session.
Hence the bottom is not created by the market and volatility is high. It is advisable that we should wait for the market until a bottom is formed before making any huge investment.
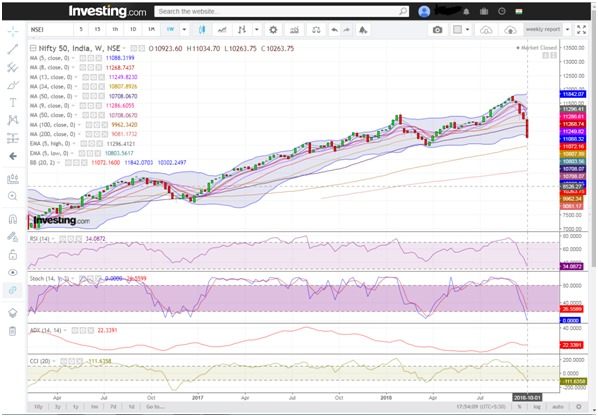
(Weekly chart)
You can use stockedge app to get cutting edge over others in both short term trading and investing. Here you not only get data at one particular place but can also create your own combination scans based on your own technical and fundamental parameter. See the video below to know about various features in Stockedge app.
(Technical Table)


