Key Takeaways
- Chart patterns visually represent price action and help traders analyze market behavior and spot trend reversals or continuations.
- They are essential tools that complement other technical indicators like support, resistance, and volume.
- Chart patterns are classified into three types: continuation (trend continues), reversal (trend changes), and bilateral (high volatility/uncertainty).
- Common reversal patterns include Head and Shoulders, Double Top, Double Bottom, Cup and Handle, and Rounding Bottom.
- Common continuation patterns include Wedges, Pennants, Symmetrical Triangles, Ascending Triangles (bullish), and Descending Triangles (bearish).
- Key Takeaways
- What are Chart Patterns?
- Why Chart Pattern Analysis Matters
- Types of Chart Patterns
- Top 10 Essential Chart Patterns:
- Pattern Recognition Quick Reference
- Trading Chart Patterns Effectively
- How to Use Chart Patterns Scanners in StockEdge?
- You can also watch our video below-
- Bottomline
- Frequently Asked Questions (FAQs)
Chart patterns transform complex market activity into visual representations that traders can interpret and act upon. These formations consolidate all buying and selling activity into comprehensive pictorial records, providing a framework for analyzing the ongoing battle between bullish and bearish forces in the market.
By mastering chart patterns, traders gain the ability to identify who controls the market at any given moment and position themselves strategically. These patterns complement other technical analysis tools such as volume indicators, support and resistance levels, RSI, and Fibonacci retracements, creating a complete analytical framework.
In order to get grips with them, here are the top 10 chart patterns that every trader should know when trading in the stock market. But before knowing that let us discuss the basics of the chart patterns:
What are Chart Patterns?
Chart patterns put all buying and selling that’s happening in the stock market into a concise picture. It provides a complete pictorial record of all trading and a framework for analyzing the battle between bulls and bears.
Chart patterns can help us in determining who is winning the battle, and also allow traders to position themselves accordingly. Chart pattern analysis can be used to make short-term as well as long-term forecasts.
The data used by the chart patterns can be intraday, daily, weekly, monthly or yearly. Gaps and reversals may form in one trading session, while broadening tops and dormant bottoms may require many months to form.
Why Chart Pattern Analysis Matters
Chart patterns represent recurring formations that emerge repeatedly across different markets and timeframes. This repetition stems from consistent human psychology and trader behavior patterns. Recognizing these formations early provides a significant competitive advantage in the markets.
The versatility of chart patterns allows them to work across various timeframes from intraday charts to monthly and yearly perspectives. Simple formations like gaps might complete within a single trading session, while complex structures such as broadening tops or rounding bottoms may require months or even years to fully develop.
Chart pattern analysis serves both short-term tactical trading and long-term strategic positioning, making it an indispensable skill for traders at all experience levels.
Types of Chart Patterns
Chart patterns fall into three primary categories based on their implications for future price movement:
1. Continuation Patterns
These formations suggest that the prevailing trend will resume after a period of consolidation. They indicate temporary pauses in the dominant trend rather than complete reversals. Traders use continuation patterns to add to existing positions or enter new trades aligned with the established trend.

2. Reversal Patterns
These structures signal potential trend changes, warning that the current directional movement may be exhausting and preparing to reverse. Reversal patterns help traders exit positions before significant adverse moves or establish new positions in the emerging trend direction.
3. Bilateral Patterns
These formations indicate market uncertainty and heightened volatility. They suggest that price could break decisively in either direction, requiring traders to remain prepared for movement in multiple scenarios.
Top 10 Essential Chart Patterns:
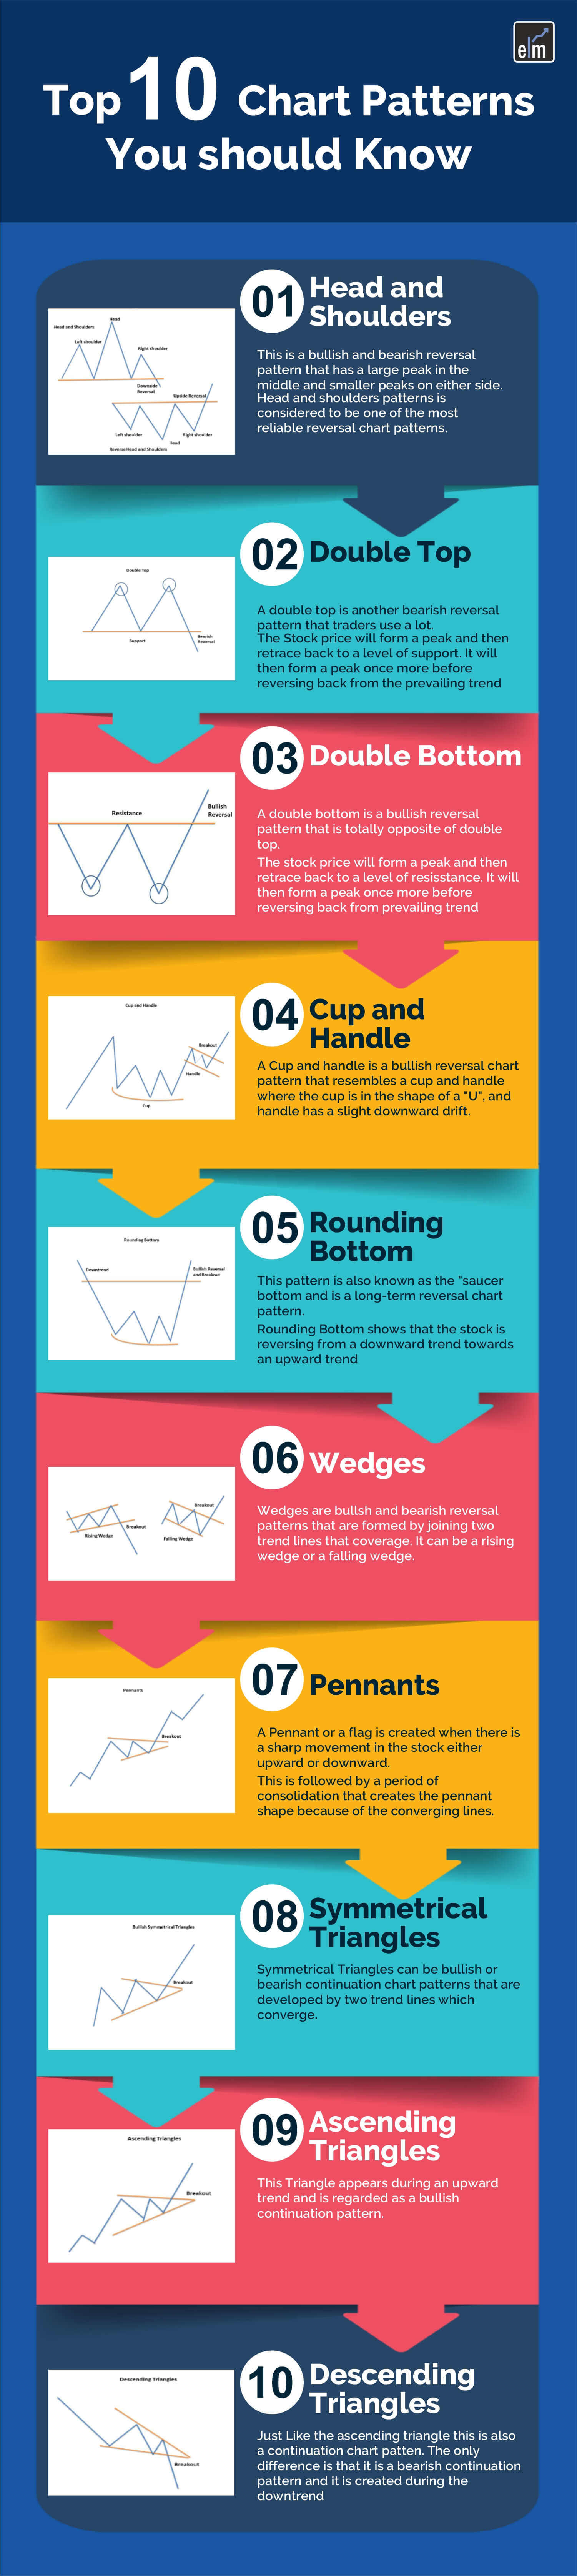
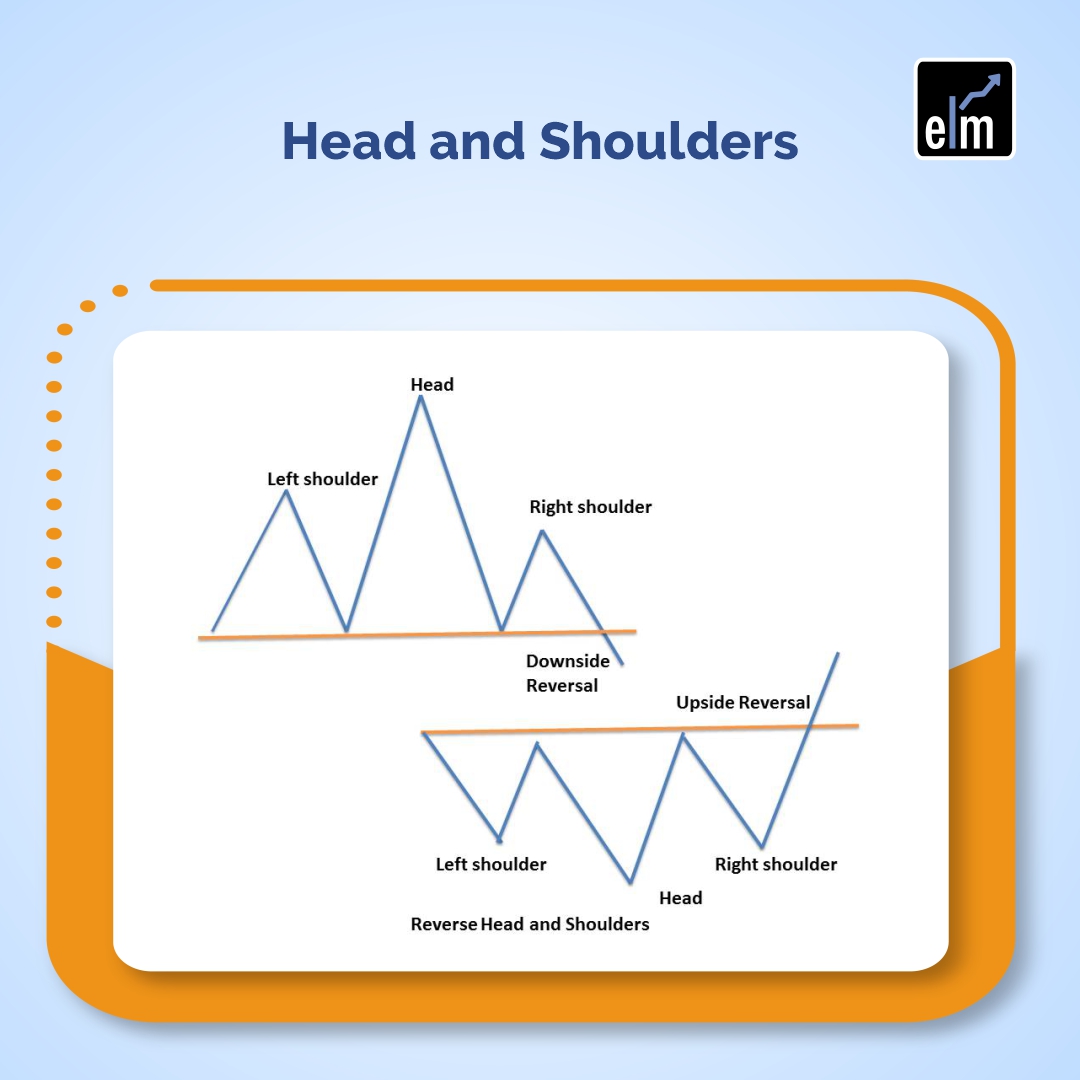
1. Head and Shoulders
Type: Reversal Pattern (Bearish)
The head and shoulders pattern ranks among the most reliable reversal formations in technical analysis. This pattern consists of three peaks: a middle peak (the head) that rises higher than two surrounding peaks (the shoulders) of roughly equal height.
Formation Process:
- Prices rise to form the first peak (left shoulder) and decline to a support level
- Prices rally again to form a higher peak (head) and fall back to the same support level
- Prices rise once more to form a third peak (right shoulder) lower than the head
- The pattern completes when prices break below the neckline (support level connecting the lows) with increased volume
The head and shoulders pattern signals that buying pressure is weakening and a bearish reversal is likely. Its inverse form (inverse head and shoulders) provides a bullish reversal signal.
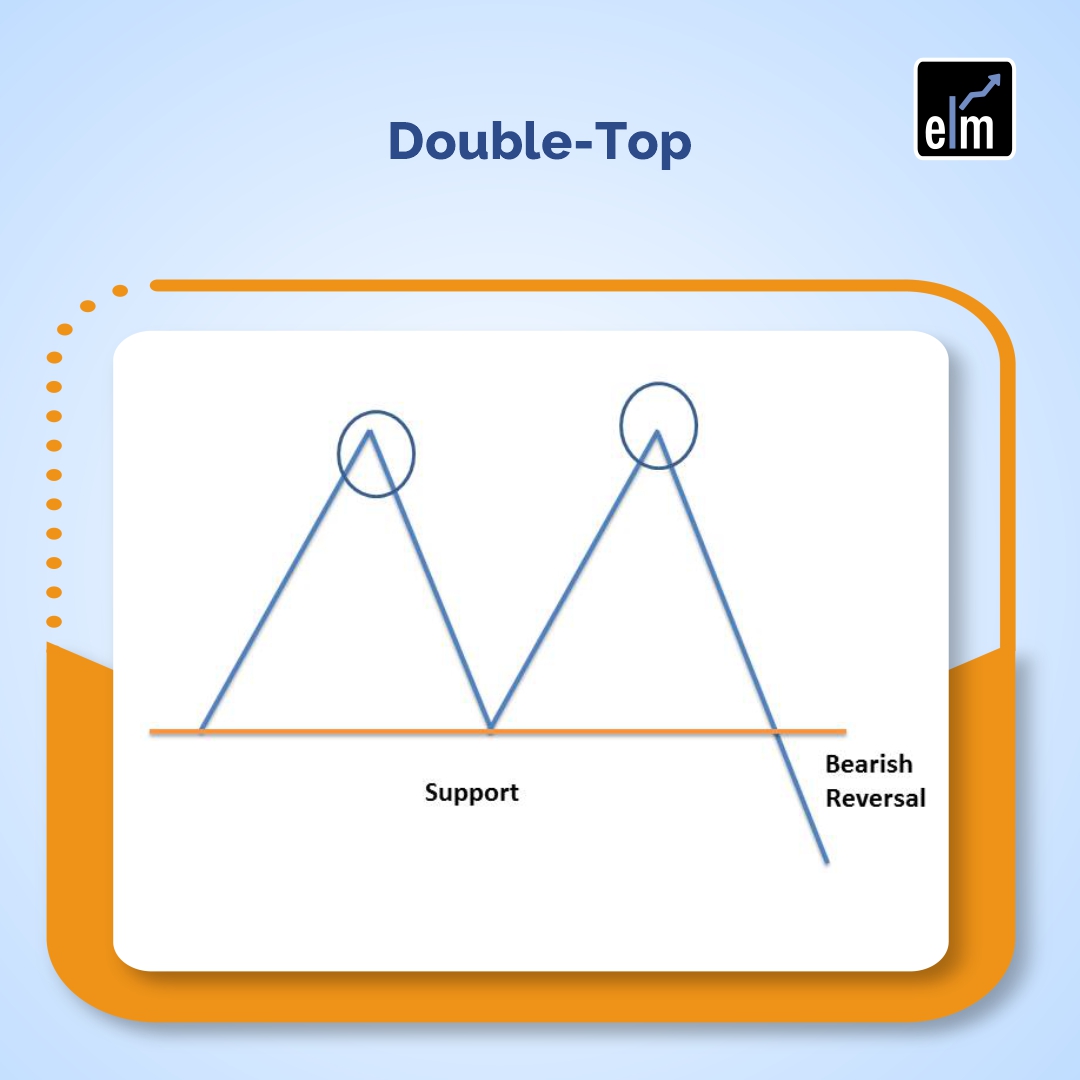
2. Double top
Type: Reversal Pattern (Bearish)
The double top pattern appears after an uptrend when prices struggle to break through a resistance level twice before reversing downward.
Formation Process:
- Prices rise to form a peak and encounter resistance
- Prices pull back to a support level
- Prices rally again to test the same resistance level but fail to break through
- Prices decline below the support level, confirming the reversal
This pattern indicates that buyers attempted twice to push prices higher but failed, suggesting weakening momentum and an impending downtrend. The distance between the peaks and the support level can help estimate the potential decline.
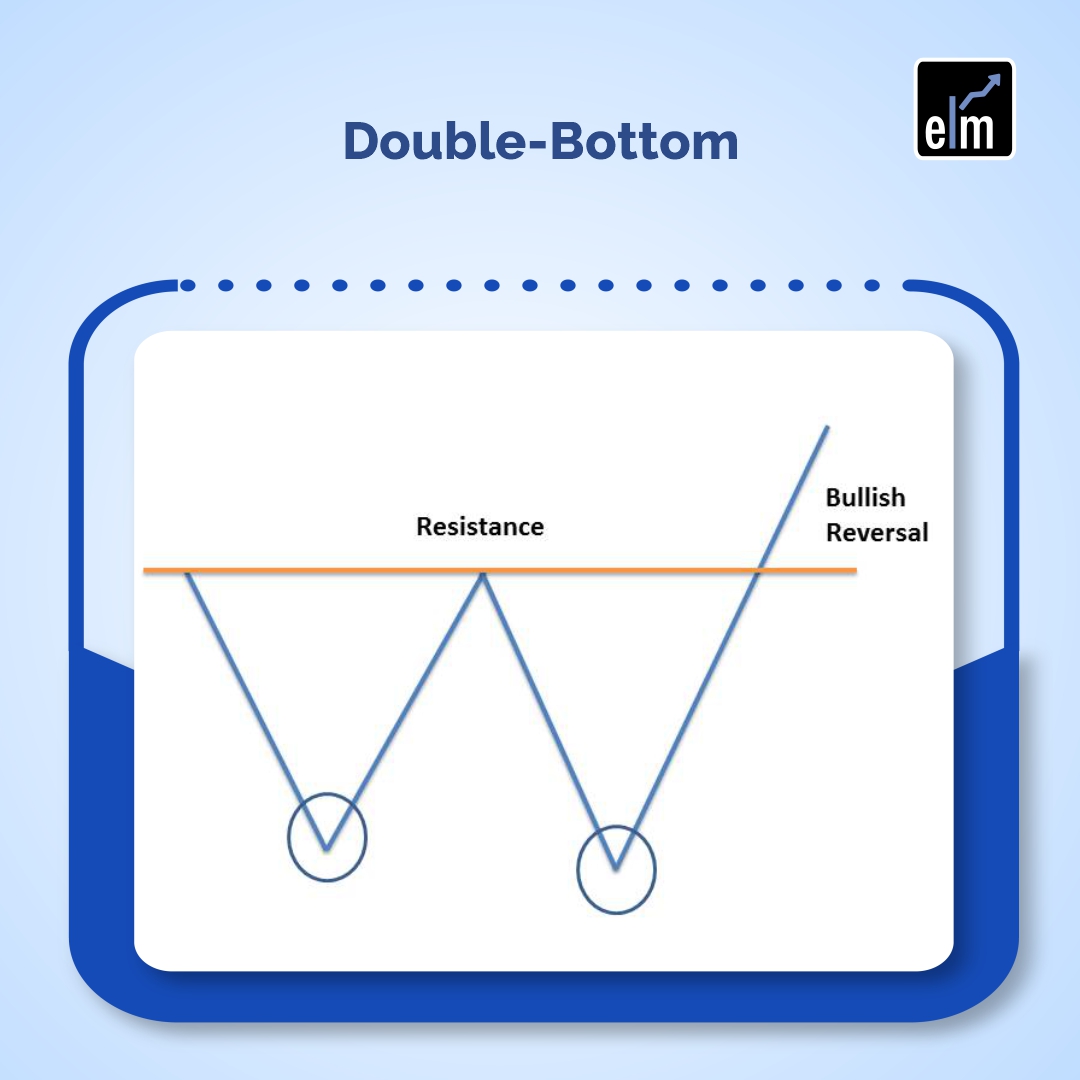
3. Double Bottom
Type: Reversal Pattern (Bullish)
Also known as the W pattern, the double bottom is the bullish counterpart to the double top pattern.
Formation Process:
- Prices decline to form a trough and encounter support
- Prices bounce back to a resistance level
- Prices fall again to test the same support level but hold
- Prices break above the resistance level, confirming the reversal
This formation signals that selling pressure is exhausting after two failed attempts to push prices lower. When prices break above the middle resistance level, it confirms a transition from a downtrend to an uptrend.
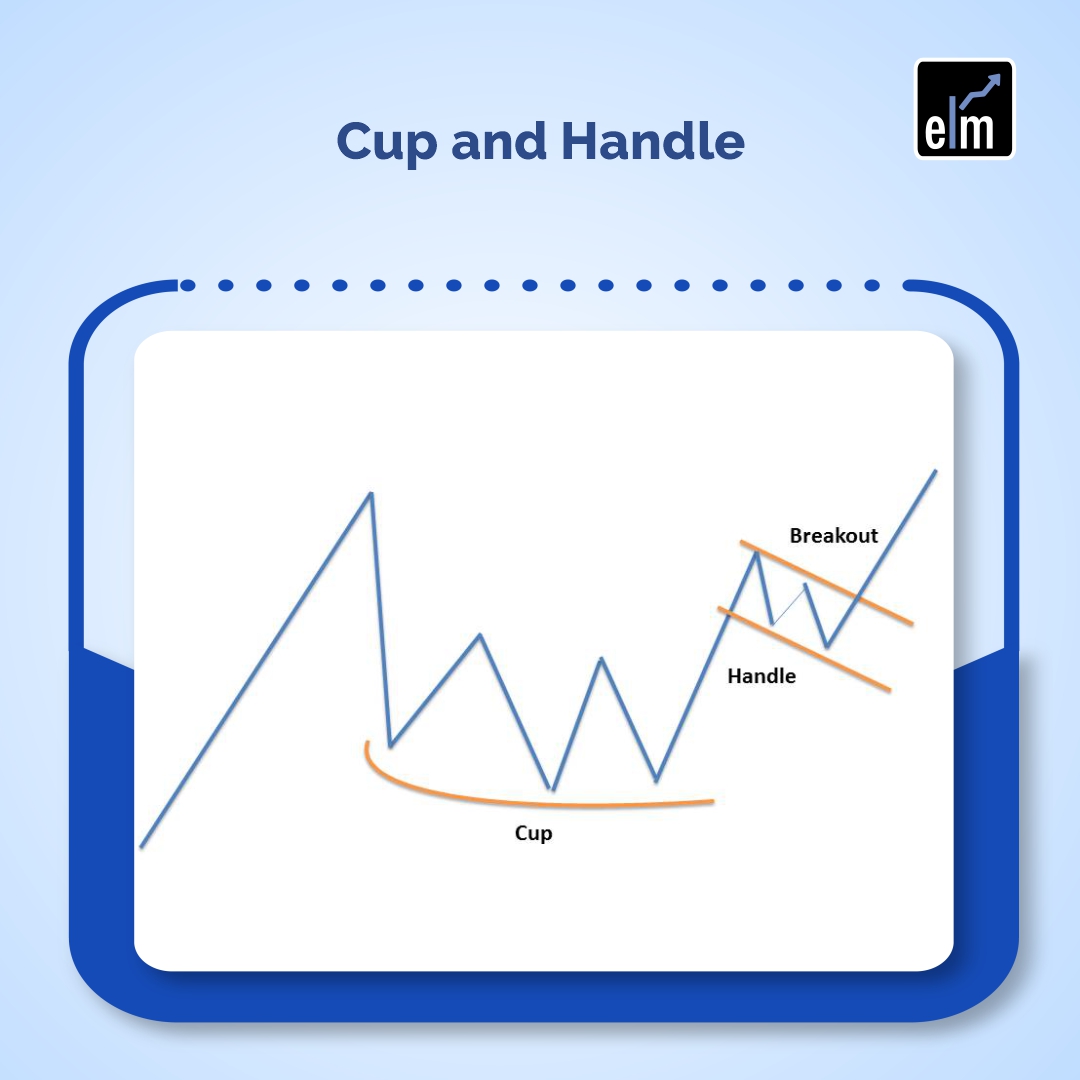
4. Cup and Handle
Type: Reversal/Continuation Pattern (Bullish)
The cup and handle pattern resembles a teacup when viewed on a chart, featuring a rounded bottom (cup) followed by a small downward drift (handle).
Formation Process:
- Prices decline gradually, forming a rounded “U” shape (the cup)
- Prices begin recovering and approach the previous high
- A brief consolidation or slight pullback forms the handle
- Prices break above the handle’s resistance with increased volume
The cup typically takes longer to form than the handle and shows decreasing volume during the bottom formation. The handle should form in the upper half of the cup for optimal strength. This pattern works as both a reversal after a downtrend and a continuation within an uptrend.
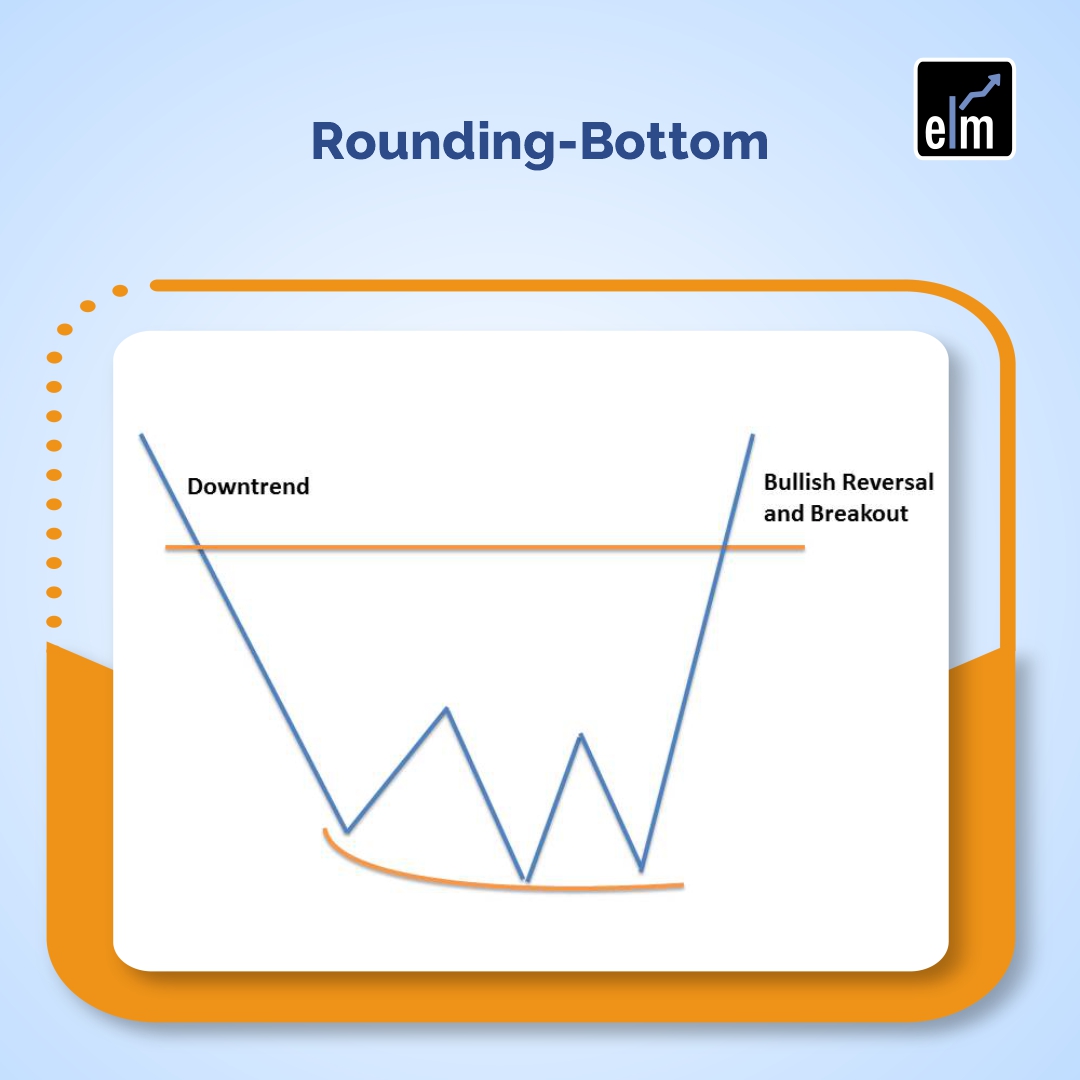
5. Rounding Bottom
Type: Reversal Pattern (Bullish)
Also called the saucer bottom, this long-term reversal pattern indicates a gradual shift from a downtrend to an uptrend.
Formation Process:
- Prices decline gradually with decreasing momentum
- Prices form a smooth, rounded bottom over an extended period
- Prices gradually rise with increasing momentum
- Volume typically decreases during the formation and increases as prices rise
The rounding bottom differs from the cup and handle by lacking a distinct handle. This pattern can take months or even years to develop, making it particularly significant for long-term investors. The gradual nature reflects a slow but steady shift in market sentiment from bearish to bullish.
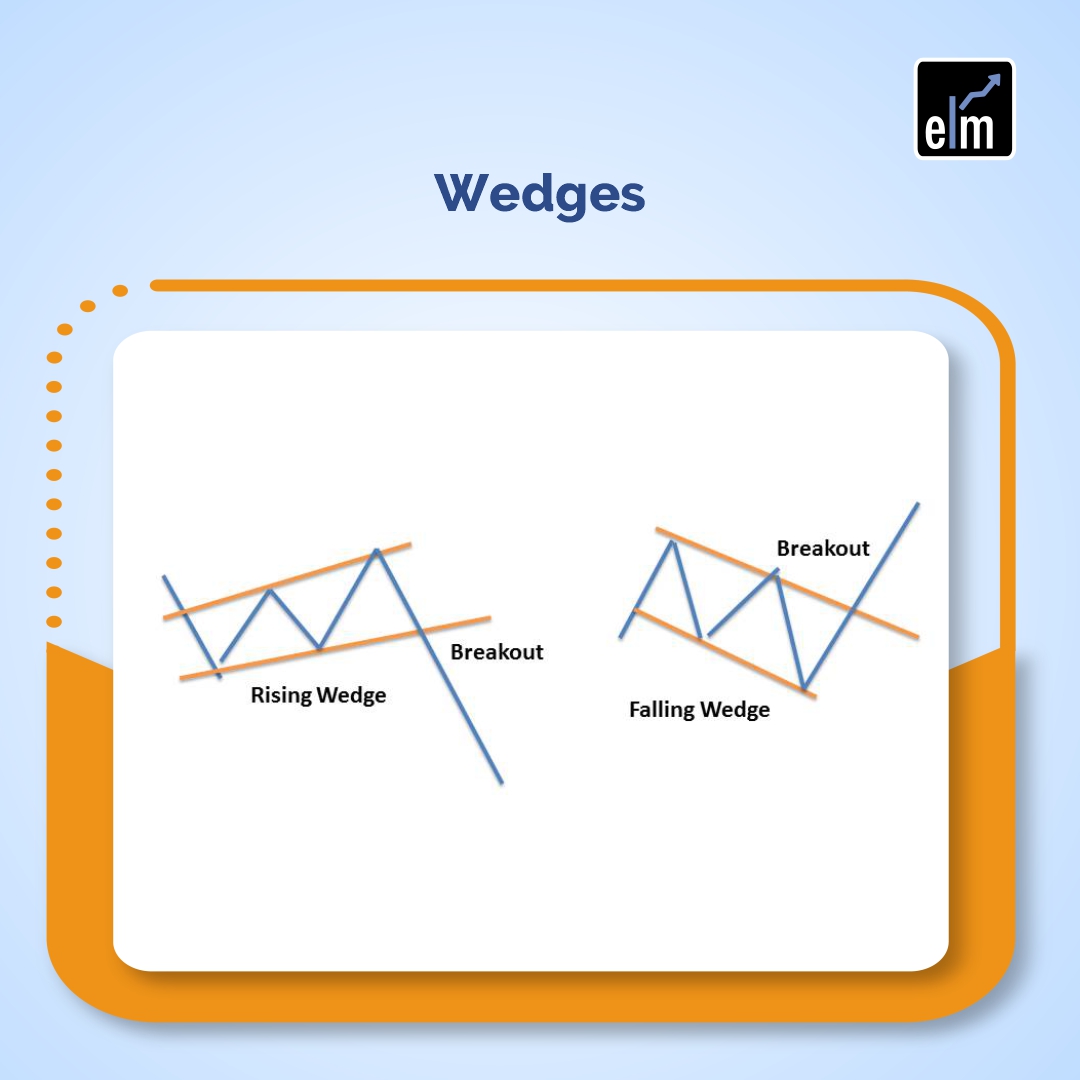
6. Wedges
Type: Reversal and Continuation Patterns (Bullish or Bearish)
Wedge patterns form when two converging trend lines contain price action, creating a narrowing price channel.
Rising Wedge (Typically Bearish):
- Both trend lines slope upward
- Upper trend line has a less steep slope than lower trend line
- Often appears at the end of an uptrend as a reversal pattern
- Can also function as a bearish continuation within a downtrend
- Breakdown typically occurs through the lower trend line
Falling Wedge (Typically Bullish):
- Both trend lines slope downward
- Lower trend line has a less steep slope than upper trend line
- Often appears at the end of a downtrend as a reversal pattern
- Can also function as a bullish continuation within an uptrend
- Breakout typically occurs through the upper trend line
Wedges signal decreasing volatility and momentum in the current direction, often preceding a significant move opposite to the wedge’s slope. Volume typically decreases as the wedge forms and increases dramatically at the breakout.
7. Pennants
Type: Continuation Patterns (Bullish or Bearish)
Pennant patterns form after sharp, substantial price movements and signal brief consolidations before the trend resumes.
Formation Process:
- A strong directional move occurs (flagpole) with high volume
- Prices consolidate within converging trend lines, forming a small symmetrical triangle
- The consolidation lasts typically one to three weeks
- Prices break out in the same direction as the initial move with increased volume
Pennants resemble small flags on charts and indicate that the market is taking a brief pause before continuing in the established direction. They’re particularly reliable when the initial move (flagpole) is strong and decisive, and the consolidation shows decreasing volume.

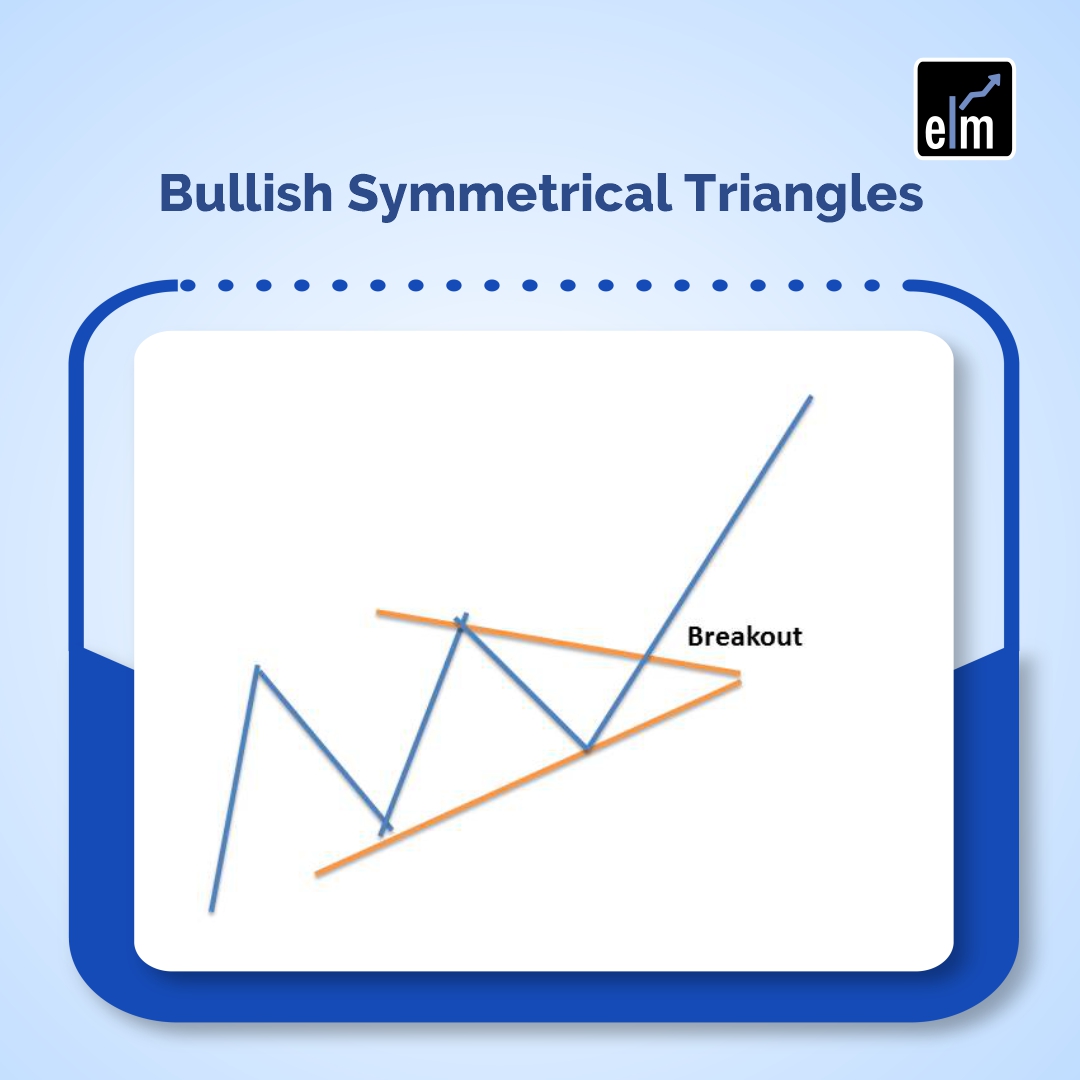
8. Symmetrical Triangles
Type: Continuation Patterns (Direction depends on prevailing trend)
Symmetrical triangles form when prices create a series of lower peaks and higher troughs, converging toward an apex.
Formation Process:
- An upper trend line connects lower highs
- A lower trend line connects higher lows
- These trend lines converge at a similar angle
- Volume typically decreases as the pattern develops
- Breakout occurs before price reaches the apex, usually with increased volume
Symmetrical triangles indicate market indecision and equilibrium between buyers and sellers. The pattern typically resolves in the direction of the prevailing trend, though traders should wait for confirmed breakout direction before trading. The pattern becomes less reliable as price approaches too close to the apex without breaking out.
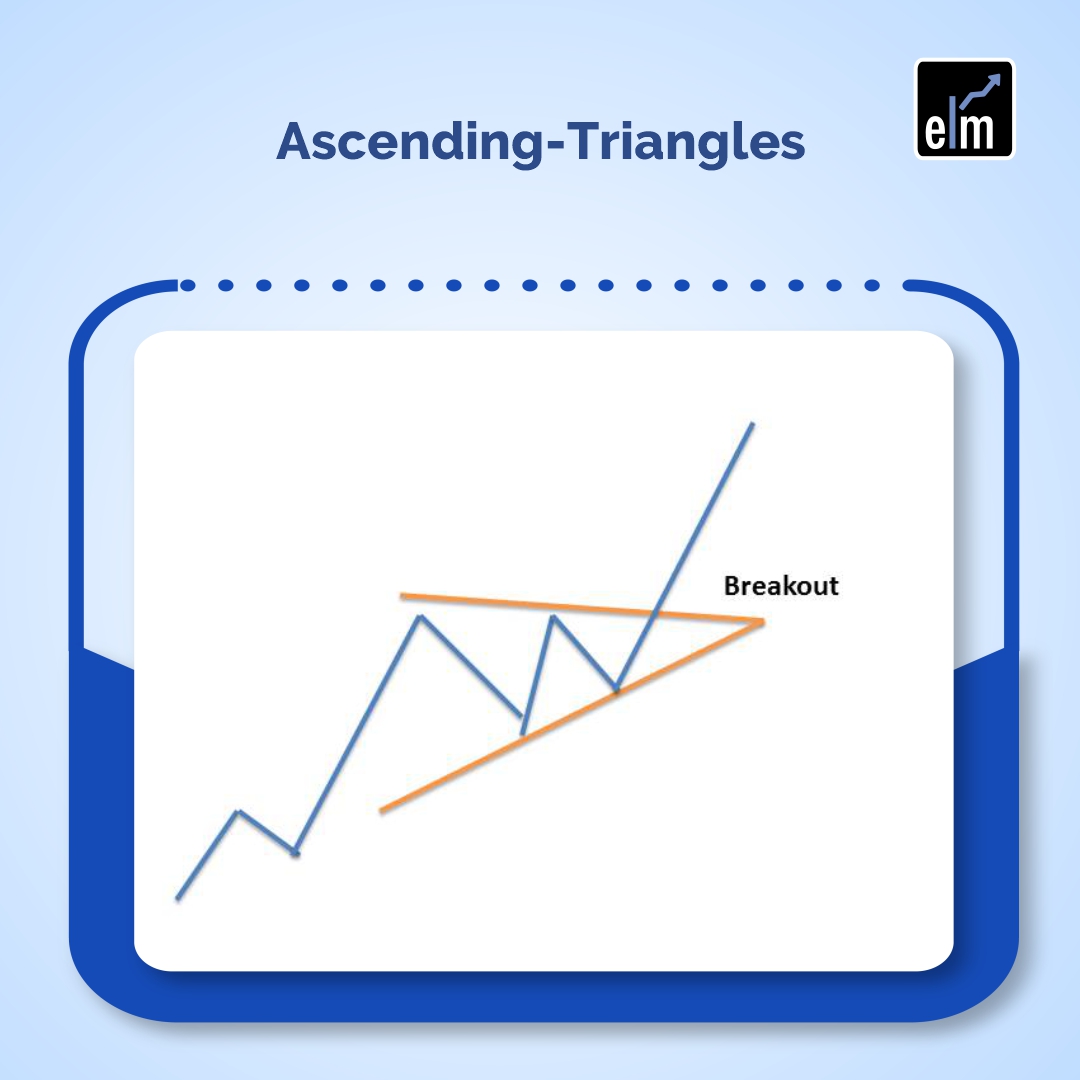
9. Ascending Triangles:
Type: Continuation Pattern (Bullish)
Ascending triangles feature a flat upper resistance line and an upward-sloping lower support line, indicating increasing buying pressure.
Formation Process:
- Prices repeatedly test a horizontal resistance level without breaking through
- Each successive low is higher than the previous low
- The pattern forms a right triangle shape
- Volume typically decreases during formation
- Breakout occurs upward through the resistance level with increased volume
While ascending triangles most commonly appear during uptrends as continuation patterns, they can occasionally form at the end of downtrends as reversal patterns. Regardless of location, they’re considered bullish formations because they demonstrate buyers becoming progressively more aggressive while sellers hold a consistent price level.
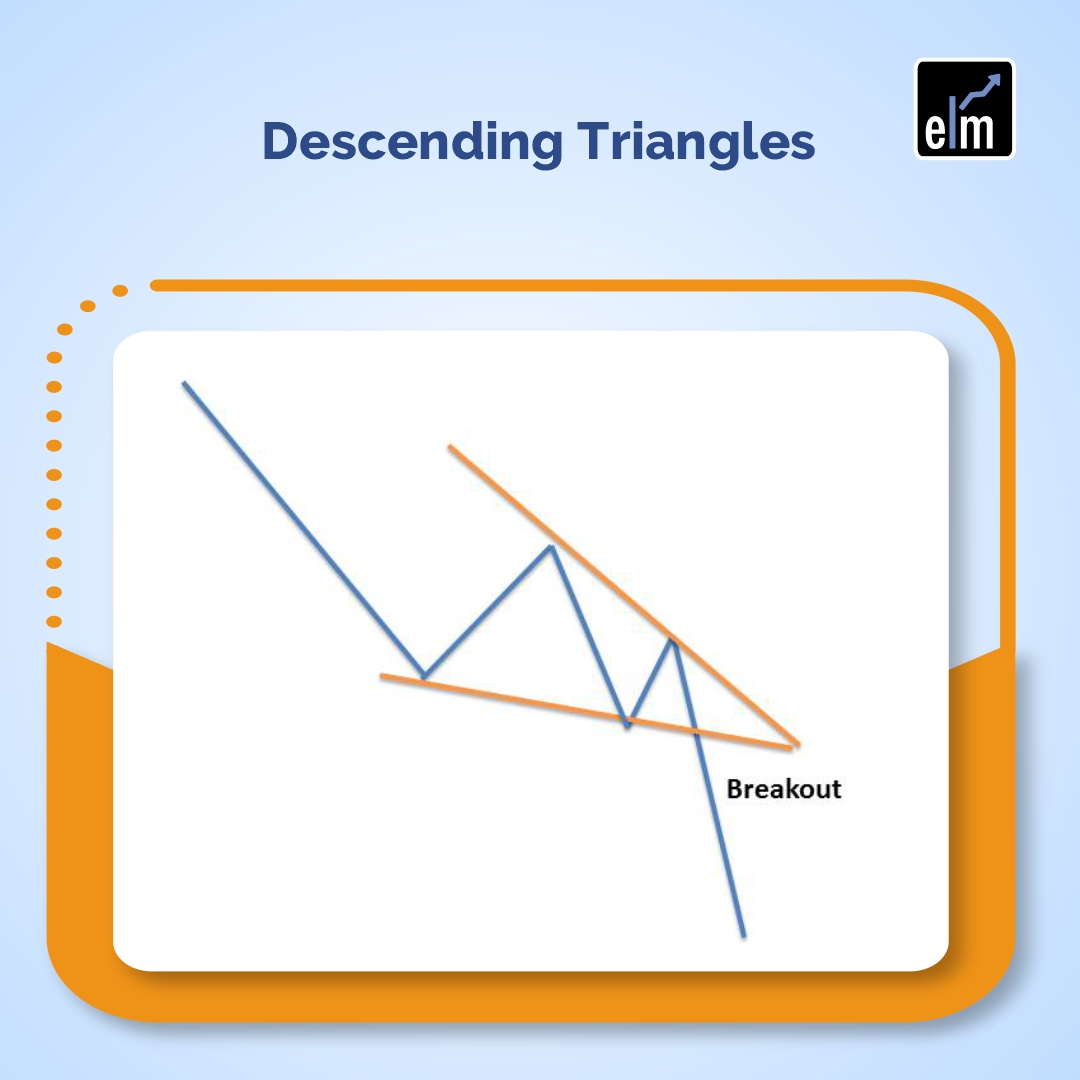
10. Descending Triangles
Type: Continuation Pattern (Bearish)
Descending triangles are the bearish counterpart to ascending triangles, featuring a flat lower support line and a downward-sloping upper resistance line.
Formation Process:
- Prices repeatedly test a horizontal support level
- Each successive high is lower than the previous high
- The pattern forms an inverted right triangle shape
- Volume typically decreases during formation
- Breakdown occurs downward through the support level with increased volume
Descending triangles most frequently appear during downtrends as continuation patterns but can occasionally emerge at the end of uptrends as reversal patterns. The formation indicates sellers becoming increasingly aggressive while buyers maintain a consistent price floor. The pattern resolves when sellers finally overwhelm the support level.
Pattern Recognition Quick Reference
| Pattern | Type | Direction | Formation Time | Reliability |
| Head and Shoulders | Reversal | Bearish | Weeks to Months | Very High |
| Inverse Head & Shoulders | Reversal | Bullish | Weeks to Months | Very High |
| Double Top | Reversal | Bearish | Weeks to Months | High |
| Double Bottom | Reversal | Bullish | Weeks to Months | High |
| Cup and Handle | Reversal/Continuation | Bullish | Months | High |
| Rounding Bottom | Reversal | Bullish | Months to Years | High |
| Rising Wedge | Reversal/Continuation | Bearish | Weeks to Months | Moderate-High |
| Falling Wedge | Reversal/Continuation | Bullish | Weeks to Months | Moderate-High |
| Pennants | Continuation | Trend Direction | Days to Weeks | Moderate-High |
| Symmetrical Triangle | Continuation | Trend Direction | Weeks to Months | Moderate |
| Ascending Triangle | Continuation | Bullish | Weeks to Months | High |
| Descending Triangle | Continuation | Bearish | Weeks to Months | High |
Trading Chart Patterns Effectively
Successfully trading chart patterns requires more than simple pattern recognition. Consider these essential principles:
- Volume Confirmation: Valid breakouts typically occur with noticeably increased volume. Low-volume breakouts often fail and reverse.
- Pattern Completion: Wait for confirmed breakouts beyond pattern boundaries rather than anticipating breaks before they occur.
- Target Estimation: Many patterns provide price targets based on their dimensions. For example, the height of a head and shoulders pattern projected downward from the neckline suggests a minimum decline target.
- False Breakouts: Not all pattern breakouts succeed. Use stop-loss orders to protect against false breakouts that reverse quickly.
- Context Matters: Evaluate patterns within the broader market context, including trend strength, market conditions, and other technical factors.
How to Use Chart Patterns Scanners in StockEdge?
StockEdge has developed a deeper analysis of stock charts and has developed this unique feature to identify some key chart patterns in StockEdge charts for you; you will receive a list of stocks where respective chart patterns have recently formed, allowing you to capitalize on trade opportunities as soon as a chart pattern is formed.
The StockEdge Pro version has five categories of chart patterns. There are 12 unique chart pattern types covering bullish, bearish, and neutral momentum.
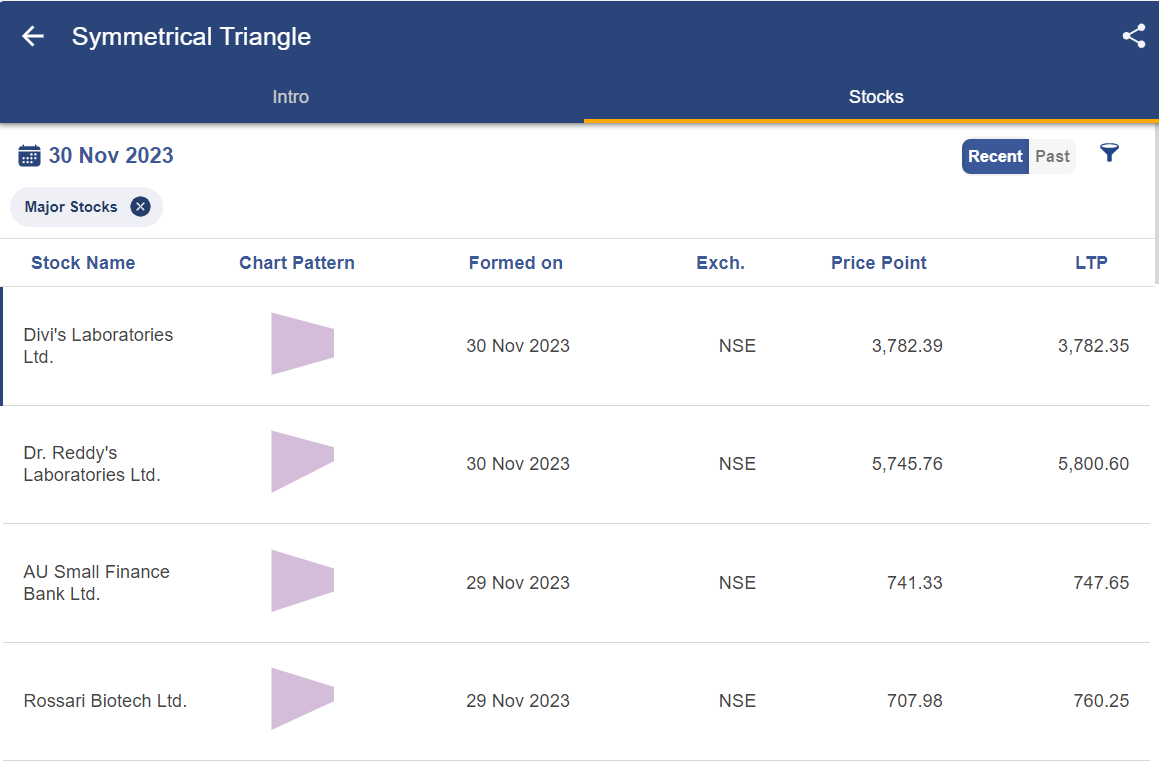
After clicking on any of the above chart patterns, you will get a list of different types of that particular chart pattern, for example, when we click on Triangle patterns, we will get the list as shown below:
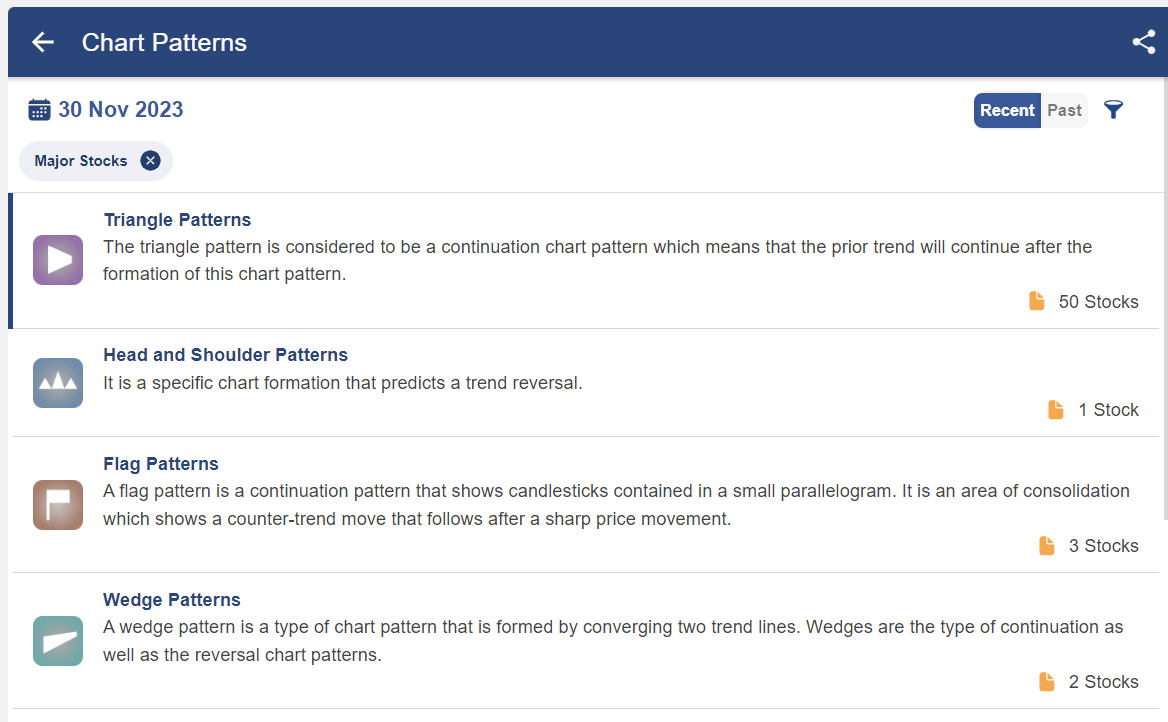
To get the list of stocks exhibiting a particular type of chart pattern, click on the name of that chart pattern:
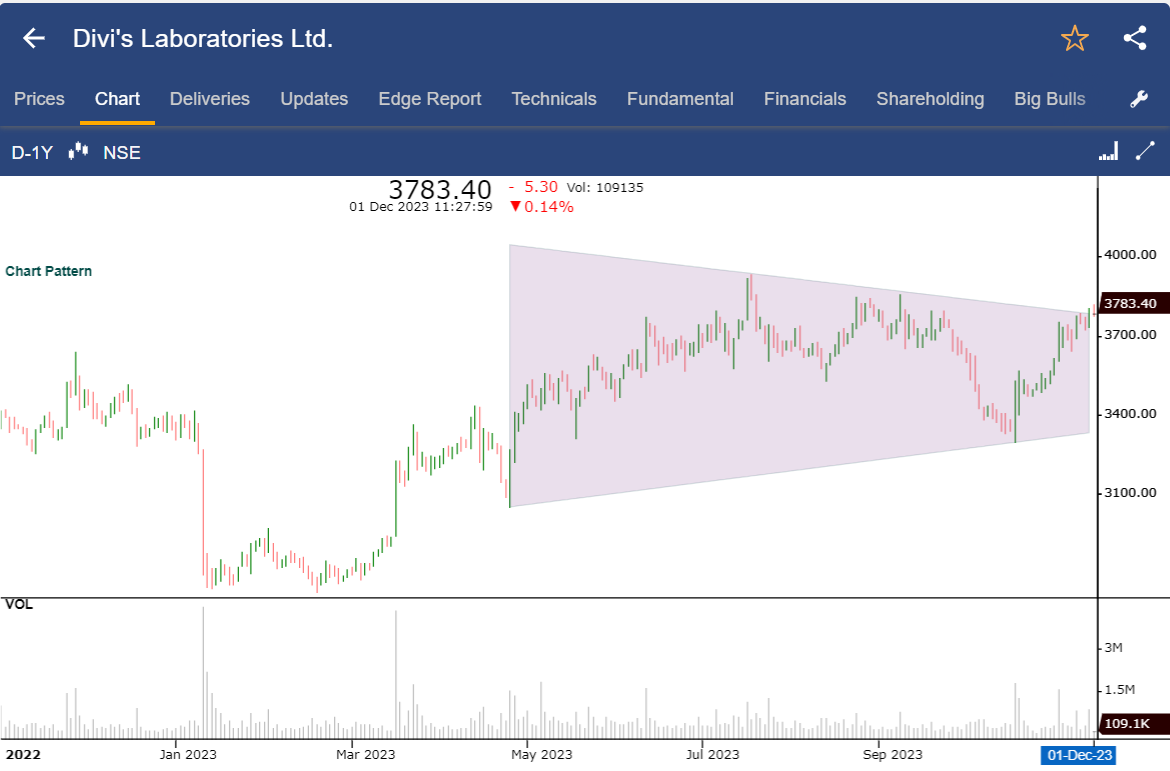
By clicking on the stock’s name, the stock chart will be shown below:
You can also watch our video below–
Begin your journey into trading confidently! Explore essential chart patterns with our stock market courses for beginners. Enroll now for success!
Bottomline
Chart patterns provide traders with visual roadmaps for understanding market psychology and anticipating future price movements. By recognizing these recurring formations and understanding their implications, traders can make more informed decisions about entry points, exit points, and risk management.
Mastering chart patterns requires dedicated study, practice, and experience. Begin with the foundational patterns outlined in this guide, practice identifying them on historical charts, and gradually incorporate them into your trading strategy alongside other technical analysis tools. Remember that no pattern guarantees success effective trading combines pattern recognition with proper risk management, volume analysis, and confirmation from multiple technical indicators.
If you’re interested in learning more about how candlesticks work, join our Candlestick Patterns Course developed by Market Experts
Frequently Asked Questions (FAQs)
1. Which chart pattern has the highest success rate?
The head and shoulders pattern, particularly the inverse head and shoulders in bull markets, demonstrates exceptional reliability with reported accuracy rates around 88% and average price changes of approximately 50%. However, success rates vary based on market conditions, timeframe, and proper pattern identification. Combining pattern analysis with volume confirmation and other technical indicators significantly improves success rates across all patterns.
2. How many chart patterns should a beginner learn first?
Beginners should focus on mastering 3-5 core patterns before expanding their repertoire. Start with the most reliable and common formations: head and shoulders, double tops/bottoms, and triangles (ascending, descending, symmetrical). Once you can consistently identify these patterns and understand their implications, gradually add more complex formations like cup and handle, wedges, and pennants to your analytical toolkit.
3. Can chart patterns work on all timeframes?
Yes, chart patterns function across all timeframes from one-minute charts to monthly and yearly charts. However, reliability generally increases on higher timeframes (daily, weekly, monthly) because these incorporate more data and reduce the impact of random market noise. Shorter timeframes generate more frequent signals but also produce more false patterns. Match your pattern analysis timeframe to your trading style. Day traders focus on hourly charts, while investors analyze daily and weekly patterns.
4. How do you distinguish between continuation and reversal patterns?
Context is crucial. Consider where the pattern appears within the trend structure. Reversal patterns typically form after extended trends and show signs of momentum exhaustion. Continuation patterns appear mid-trend during consolidation periods. However, some patterns like wedges can function as either type depending on context. Always analyze the pattern’s position within the larger trend, volume characteristics, and preceding price action to determine its likely classification.
5. What percentage of chart patterns fail?
No pattern guarantees success. Even the most reliable patterns fail approximately 10-30% of the time depending on market conditions and pattern quality. Factors affecting pattern reliability include incomplete formations, low volume on breakouts, conflicting technical signals, and sudden fundamental news. This inherent uncertainty makes risk management, stop-loss orders, and position sizing crucial components of any pattern-based trading strategy.
6. Should I wait for pattern completion before trading?
Generally, yes. Trading before pattern completion significantly increases risk because patterns can transform or fail to complete entirely. Wait for confirmed breakouts beyond pattern boundaries with accompanying volume increase before entering positions. However, experienced traders sometimes enter positions during pattern formation using tighter stop-losses, accepting higher risk for potentially better entry prices. Beginners should strictly wait for confirmed completions.
7. How important is volume in chart pattern analysis?
Volume serves as critical confirmation for chart patterns. Decreasing volume during pattern formation followed by increasing volume on the breakout validates the pattern’s reliability. High-volume breakouts demonstrate genuine conviction behind the price move, while low-volume breakouts often reverse as false signals. Always analyze volume alongside price action. Patterns with proper volume characteristics have significantly higher success rates than those without.
8. Can chart patterns predict exact price targets?
Chart patterns provide estimated price targets rather than exact predictions. These targets are calculated using the pattern’s dimensions for example, measuring the height of a triangle or head and shoulders pattern and projecting that distance from the breakout point. These targets represent minimum expected moves in many cases. Actual price movement may exceed or fall short of targets depending on market conditions, momentum, and other factors. Use pattern-based targets as guidelines rather than guarantees.
9. What’s the difference between basic and complex chart patterns?
Basic patterns involve simpler structures with fewer components like double tops, double bottoms, and simple triangles. These typically complete faster and are easier to identify. Complex patterns like head and shoulders, cup and handle, or rounding bottoms involve more intricate formations, take longer to develop, and require more sophisticated analysis. Beginners should master basic patterns before attempting to trade complex formations, as misidentification of complex patterns leads to poor trading decisions.
10. How do market conditions affect chart pattern reliability?
Market conditions significantly impact pattern performance. Patterns tend to work better in trending markets with clear directional bias compared to choppy, range-bound markets. Continuation patterns perform better in strong trends, while reversal patterns gain importance during trend exhaustion. High volatility can distort pattern formations or trigger premature breakouts. Economic events, earnings announcements, and news can override pattern signals. Always consider broader market context when evaluating individual chart patterns.


Basic and very essential knowledge about chart patterns, explained easily and briefly.
Excellent teaching of Chart Patterns
Hi,
Thank you for Reading!
Keep Reading!
HI, SIR,
AWESOME TEACHING OF CHART PATTERNS
THANK YOU VERY MUCH😃👌🏻
Hi,
We really appreciated that you liked our blog! Thank you for your feedback!
Keep Reading!
Hi Sakshi,
Awesome. Explained very simple way and in detail. Thanks a lot!
Thank you,
Praveen
Hi,
We really appreciated that you liked our blog!
Thank you for Reading!
Keep Reading!
Very good
Hi,
We really appreciated that you liked our blog!
Thank you for Reading!
Keep Reading!