Elearnmarkets - Financial Market Learning
  • Categories
    • Basic Finance
    • Derivatives
    • Financial Planning
    • Fundamental Analysis
    • Technical Analysis
    • Marketshala
    • Miscellaneous
  • Language
    • English
    • Hindi
    • Bengali
No Result
View All Result
  • Courses
  • Webinars
  • Learn On Elearnmarkets
Elearnmarkets - Learn Stock Market, trading, investing for Free
No Result
View All Result
Home Technical Analysis
5 Types of Elliott Wave Pattern to Understand the Market Behaviour 1

5 Types of Elliott Wave Pattern to Understand the Market Behaviour

Elearnmarkets by Elearnmarkets
September 26, 2022
in Technical Analysis, Charts, Patterns & Indicators
Reading Time: 8 mins read
2
49k
VIEWS
Share on FacebookShare on TwitterShare on WhatsApp

Elliott Wave Pattern- Do you know that these patterns can help you in understanding market behaviour?

Yes! It’s absolutely true! But before driving into patterns lets us actually understand what is the Elliott wave principle:

The Elliott wave principle is a form of technical analysis that helps traders in analyzing financial market cycles.

With the help of this Elliott wave theory, traders can forecast market trends by identifying extremes in prices and investor psychology.

Elliott Wave Theory suggests that movements of the market follow a sequence of crowd psychology cycles.

Join TMP Join TMP Join TMP

The Elliott Wave Patterns are formed according to the ongoing market sentiment, which alternates between bullish and bearish cycles.

However, the Elliott Wave should not be considered as a technical indicator but a theory that helps in predicting the behaviour of the market.

In this blog we will discuss the 5 main types of Elliott Wave Pattern which will help the traders in predicting the market behaviour:

Table Of Contents
  1. What is Elliott Wave Theory?
  2. What are Motives and Corrective Waves?
    • 1. Motive Waves:
    • 2. Corrective Waves:
  3. Below are the 5 main types of Elliott Wave Patterns:
    • 1. Impulse:
    • 2. Diagonal:
    • 3. Zig-Zag:
    • 4. Flat:
    • 5. Triangle:
  4. Bottomline:

What is Elliott Wave Theory?

The Elliott Wave Theory suggests that the stock prices move continuously up and down in the same pattern known as waves that are formed by the traders’ psychology.

The theory holds as these are recurring patterns, the movements of the stock prices can be easily predicted.

Investors can get an insight into ongoing trend dynamics when observing these waves and also helps in deeply analyzing the price movements.

But traders should take note that interpretation of the Elliot wave is subjective as investors interpret it in different ways.

Before discussing the patterns, let us discuss Motives and Corrective Waves:

What are Motives and Corrective Waves?

The Elliott Wave can be categorized into Motives and Corrective Waves:

1. Motive Waves:

Motive waves move in the direction of the main trend and consist of 5 waves that are labelled as Wave 1, Wave 2, Wave 3, Wave 4 and Wave 5.

Wave 1, 2 and 3 move in the direction of the main direction whereas Wave 2 and 4 move in the opposite direction.

There are usually two types of Motive Waves- Impulse and Diagonal Waves.

2. Corrective Waves:

Waves that counter the main trend are known as the corrective waves.

Corrective waves are more complex and time-consuming than motive waves. Correction patterns are made up of three waves and are labelled as A, B and C.

The three main types of corrective waves are Zig-Zag, Diagonal and Triangle Waves.

Now let us come to Elliott Wave Patterns:

Below are the 5 main types of Elliott Wave Patterns:

5 Types of Elliott Wave Pattern to Understand the Market Behaviour 2
5 Types of Elliott Wave Pattern to Understand the Market Behaviour 3
5 Types of Elliott Wave Pattern to Understand the Market Behaviour 4

1. Impulse:

Impulse is the most common motive wave and also easiest to spot in a market.

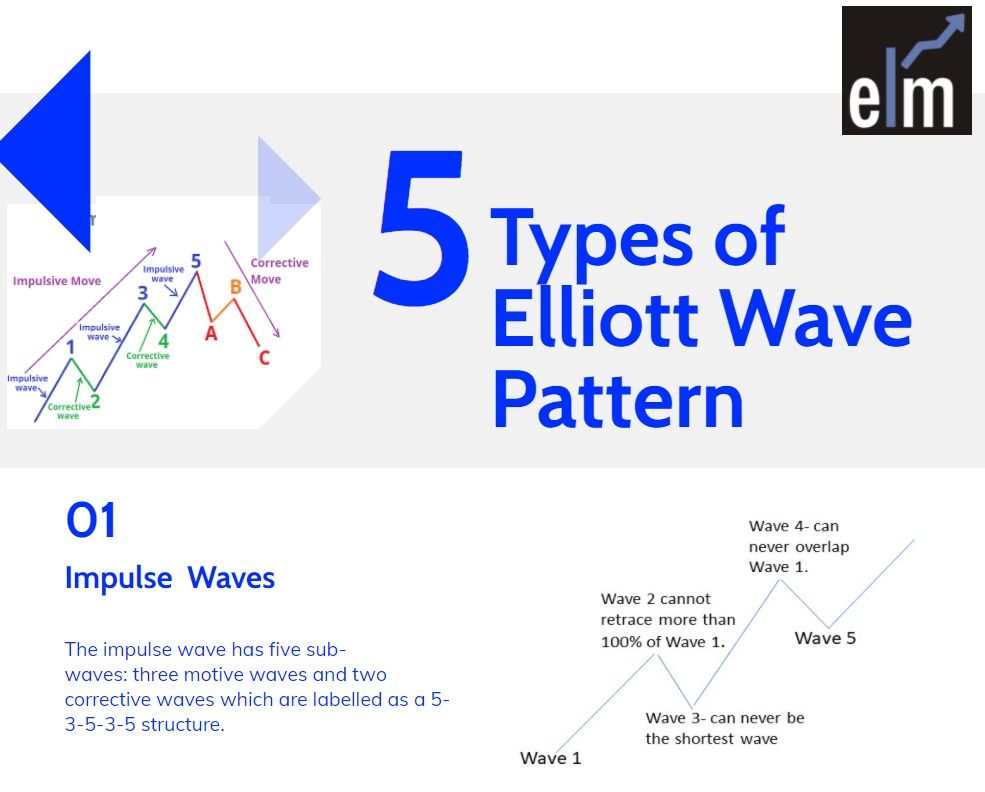
Like all motive waves, the impulse wave has five sub-waves: three motive waves and two corrective waves which are labelled as a 5-3-5-3-5 structure.

However, the formation of the wave is based on a set of rules.

If any of these rules are violated, then the impulse wave is not formed and we have to re-label the suspected impulse wave.

The three rules for impulse wave formation are:

  • Wave 2 cannot retrace more than 100% of Wave 1.
  • Wave 3 can never be the shortest of waves 1, 3, and 5.
  • Wave 4 can never overlap Wave 1.

The main goal of a motive wave is to move the market and impulse waves are the best at accomplishing this.

Read more about Elliott Wave from our ELM School Module

2. Diagonal:

Another type of motive wave is the diagonal wave which, like all motive waves, consists of five sub-waves and moves in the direction of the trend.

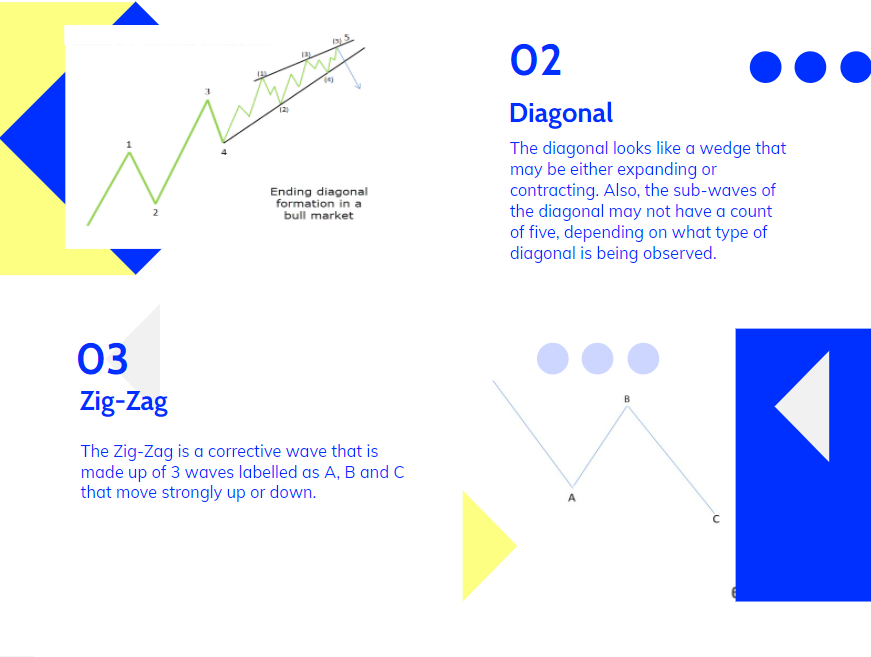
The diagonal looks like a wedge that may be either expanding or contracting. Also, the sub-waves of the diagonal may not have a count of five, depending on what type of diagonal is being observed.

Like other motive waves, each sub-wave of the diagonal wave does not fully retrace the previous sub-wave. Also, sub-wave 3 of the diagonal is not the shortest wave.

Diagonals can be further divided into the ending and leading diagonals.

The ending diagonal usually occurs in Wave 5 of an impulse wave or the last wave of corrective waves whereas the leading diagonal is found in either the Wave 1 of an impulse wave or the Wave A position of a zigzag correction.

3. Zig-Zag:

The Zig-Zag is a corrective wave that is made up of 3 waves labelled as A, B and C that move strongly up or down.

The A and C waves are motive waves whereas the B wave is corrective (often with 3 sub-waves).

Zigzag patterns are sharp declines in a bull rally or advances in a bear rally that substantially correct the price level of the previous Impulse patterns.

Zigzags may also be formed in a combination which is known as the double or triple zigzag, where two or three zigzags are connected by another corrective wave between them.‘

Watch Webinar on TIMING THE MARKET USING NEO WAVE WITH TIME CYCLES

4. Flat:

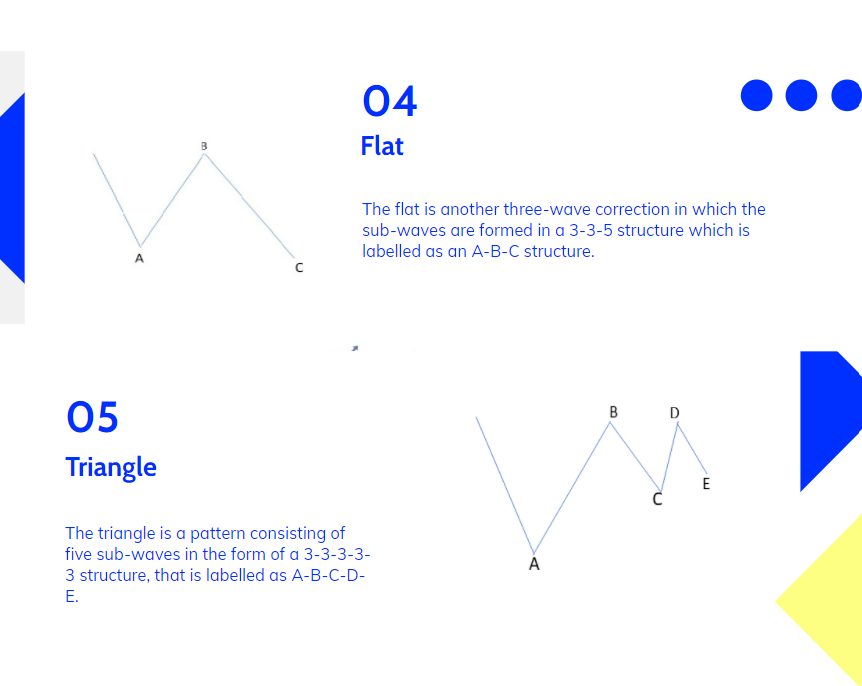
The flat is another three-wave correction in which the sub-waves are formed in a 3-3-5 structure which is labelled as an A-B-C structure.

In the flat structure, both Waves A and B are corrective and Wave C is motive having 5 sub-waves.

This pattern is known as the flat as it moves sideways. Generally, within an impulse wave, the fourth wave has a flat whereas the second wave rarely does.

On the technical charts, most flats usually don’t look clear as there are variations on this structure.

A flat may have wave B terminate beyond the beginning of the A wave and the C wave may terminate beyond the start of the B wave. This type of flat is known as the expanded flat.

The expanded flat is more common in markets as compared to the normal flats as discussed above.

You can also join our course on MASTER TO TRADE ELLIOTT WAVES

5. Triangle:

The triangle is a pattern consisting of five sub-waves in the form of a 3-3-3-3-3 structure, that is labelled as A-B-C-D-E.

This corrective pattern shows a balance of forces and it travels sideways.

The triangle can either be expanding, in which each of the following sub-waves gets bigger or contracting, that is in the form of a wedge.

The triangles can also be categorized as symmetrical, descending or ascending, based on whether they are pointing sideways, up with a flat top or down with a flat bottom.

The sub-waves can be formed in complex combinations. It may theoretically look easy for spotting a triangle, it may take a little practice for identifying them in the market.

You can watch our video on Elliott Wave Theory:

Bottomline:

As we have discussed above Elliott wave theory is open to interpretations in different ways by different traders, so are their patterns. Thus, traders should ensure that when they identify the patterns.

Happy Investing!

For stock related queries visit web.stockedge.com

Tags: advanceElliott Wave PatternElliott wave theorytechnical analysis
ShareTweetSend
Previous Post

5 Most Important Macroeconomic Factors that Affect Indian Stock Market

Next Post

Top 12 Options Strategies Every Trader Should Know

Elearnmarkets

Elearnmarkets

Elearnmarkets (ELM) is a complete financial market portal where the market experts have taken the onus to spread financial education. ELM constantly experiments with new education methodologies and technologies to make financial education effective, affordable and accessible to all. You can connect with us on Twitter @elearnmarkets.

Related Posts

Technical Analysis in Stock Trading 5
Technical Analysis

Technical Analysis in Stock Trading

May 31, 2023
5.8k
The Ultimate guide to Trading Divergences 6
Technical Analysis

The Ultimate guide to Trading Divergences

May 26, 2023
964
Trading Psychology: Guide to Master Your Mind in 5 Steps 7
Technical Analysis

Trading Psychology: Guide to Master Your Mind in 5 Steps

May 24, 2023
3k
Trading Psychology: 7 Keys to Successful Trading 8
Technical Analysis

Trading Psychology: 7 Keys to Successful Trading

May 22, 2023
2.9k

Comments 2

  1. Kalyankumar Kulkarni says:
    1 year ago

    Very nice for beginners

    Reply
    • Sakshi Agarwal says:
      1 year ago

      Hi,

      We really appreciated that you liked our blog!

      Thank you for Reading!

      Keep Reading!

      Reply

Leave a Reply Cancel reply

Your email address will not be published. Required fields are marked *

Follow Us

Facebook-f Twitter Instagram Linkedin-in Youtube Telegram

Register on Elearnmarkets

Continue your financial learning by creating your own account on Elearnmarkets.com

Register Free Account

Download App

Categories

  • Basic Finance
  • Derivatives
  • Financial Planning
  • Fundamental Analysis
  • Technical Analysis
  • Marketshala
  • Miscellaneous

Popular On Elearnmarkets

  • Market Superheroes:
  • Vivek Bajaj
  • Chetan Panchamia
  • Ashish Kyal
  • Premal Parekh
  • Abhijit Paul
  • Jegan
  • Sivakumar Jayachadran
  • Vishal Malkan
  • Jyoti Budhia
  • Vivek Gadodia
  • Vishal Mehta
  • Piyush Chaudhry
  • Santosh Pasi
  • Gomathi Shankar
  • Market Superheroes:
  • Vivek Bajaj
  • Chetan Panchamia
  • Ashish Kyal
  • Premal Parekh
  • Abhijit Paul
  • Jegan
  • Sivakumar Jayachadran
  • Vishal Malkan
  • Jyoti Budhia
  • Vivek Gadodia
  • Vishal Mehta
  • Piyush Chaudhry
  • Santosh Pasi
  • Gomathi Shankar
  • Courses:​
  • Options Trading
  • Dow Theory
  • Momentum Trading
  • Stock Investing
  • Stock Market for Beginners
  • Harmonic Chart Patterns
  • Algo Trading
  • Elliot Wave Theory
  • Advanced Excel
  • Cryptocurrency
  • NSE Certification Course
  • Courses:​
  • Options Trading
  • Dow Theory
  • Momentum Trading
  • Stock Investing
  • Stock Market for Beginners
  • Harmonic Chart Patterns
  • Algo Trading
  • Elliot Wave Theory
  • Advanced Excel
  • Cryptocurrency
  • NSE Certification Course
  • Webinars:
  • Bank Nifty Scalping
  • Intraday Trading Strategies
  • Options Trading Strategies
  • Options selling
  • Price Action
  • Relative Strength
  • Tax Planning
  • Options Buying
  • Growth Stocks
  • Portfolio Management
  • Relative Strength Index
  • Risk Management
  • Renko Charts
  • Crude Oil
  • Traders Psychology
  • Moving Average
  • Multibagger Stocks
  • Free Learning Modules:
  • Intraday Trading
  • Options Scalping
  • Swing Trading
  • Financial Modelling
  • RSI Indicator
  • Bollinger Bands
  • Pricing of Futures
  • Personal Finance
  • Initial Public Offerings (IPO)
  • Value Investing
  • Technical Indicators
  • Candlesticks
  • Chart Patterns
  • Option Greeks
  • ELSS Funds
  • Banking and Insurance
  • Real Estate
  • Gold
  • Book Summaries:
  • Rich Dad Poor Dad
  • Psychology of Money
  • The Intelligent Investor
  • The Richest Man in Babylon
  • Think and Trade Like a Champion
  • Value Investing and Behavioural Finance
  • Trading in the Zone
  • Learn to Earn
  • Book Summaries:
  • Rich Dad Poor Dad
  • Psychology of Money
  • The Intelligent Investor
  • The Richest Man in Babylon
  • Think and Trade Like a Champion
  • Value Investing and Behavioural Finance
  • Trading in the Zone
  • Learn to Earn
  • Tools:
  • CAGR Calculator
  • SIP Calculator
  • eLearnOptions
  • Future Value Calculator
  • Present Value Calculator
  • Atal Pension Yojana
  • Cost of Delay Calculator
  • Become a Crorepati
  • Tools:
  • CAGR Calculator
  • SIP Calculator
  • eLearnOptions
  • Future Value Calculator
  • Present Value Calculator
  • Atal Pension Yojana
  • Cost of Delay Calculator
  • Become a Crorepati

© 2023 Elearnmarkets. All Rights Reserved

  • Visit Elearnmarkets
  • Courses
  • Webinars
  • Financial Guides
  • Get Free Counselling
  • Visit Elearnmarkets
  • Courses
  • Webinars
  • Financial Guides
  • Get Free Counselling

Get Elearnmarkets App

No Result
View All Result
  • Article Categories
    • Basic Finance
    • Derivatives
    • Financial Planning
    • Fundamental Analysis
    • Technical Analysis
    • Marketshala
    • Miscellaneous
  • Language
    • Hindi
    • Bengali
    • English
  • Courses
  • Webinars

© 2020 Elearnmarkets All Rights Reserved