Key Takeaways
- Open Interest (OI) reflects market participation: It indicates the total number of outstanding futures or options contracts that are yet to be settled, helping traders assess liquidity and sentiment.
- OI helps identify support and resistance zones: High Call OI often signals a resistance level, while high Put OI represents a possible support level in the market.
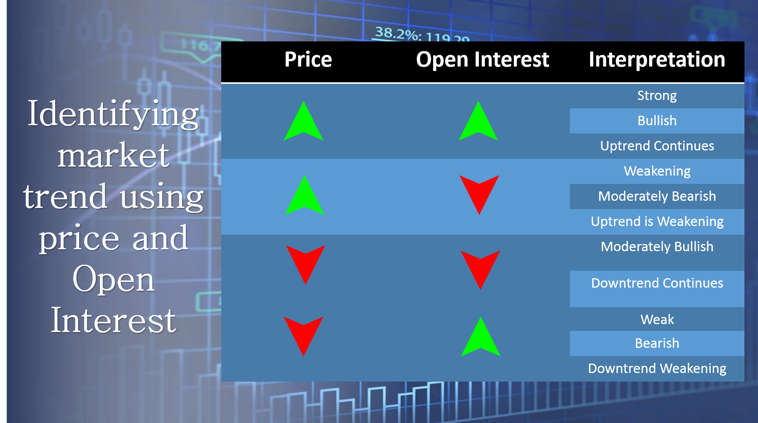
- Price movement with OI change reveals market strength: Rising prices with increasing OI suggest bullish sentiment, while falling prices with increasing OI indicate bearish momentum.
- OI analysis must be combined with technical tools: Traders often pair OI data with indicators like volume, moving averages, and price action for more reliable market predictions.
- Use trusted platforms for accurate OI insights: Tools like StockEdge help track Open Interest trends, identify strong OI build-ups, and make informed trading decisions.
- Key Takeaways
- What is Support and Resistance in the Stock Market?
- What is Open Interest?
- How is OI Calculated?
- How do you use open interest for support and resistance?
- What will happen when the price goes above the 11200 level?
- Combining Open Interest with Other Technical Indicators
- Conclusion
- Frequently Asked Questions (FAQs)
Open Interest defines the total number of open or outstanding contracts presently held by the market participant at a given time.
The total amount of open or unsettled options or futures contracts in a market at any particular time is referred to as open interest. It shows the total number of contracts that have been signed but haven’t been exercised by delivery or offset by closing trades yet.
When paired with price changes and trade volume, open interest can reveal information about market mood, liquidity, and future price fluctuations.
What is Support and Resistance in the Stock Market?
Technical analysis uses the basic ideas of support and resistance to examine and forecast future price movements in the stock market. The underlying premise of these words is that stock prices frequently follow recurring patterns and frequently respond to previous price levels.
Support: A price level where a stock typically stops dropping and may even begin to gain is referred to as support. It denotes a level at which buying interest is strong enough to offset selling pressure. Traders and investors may view a stock’s approach to a support level as a buying opportunity, anticipating a price reversal from that level. Historical lows or regions where the price has repeatedly changed direction are frequently used to identify support levels.
Resistance: Resistance is the reverse of encouragement. It is a price point at which a stock may begin to depreciate and tend to cease advancing. At this level, there is a lot of selling activity that is keeping the price from rising further. Traders may view the price approaching a resistance level as a selling opportunity, anticipating a downward price reversal. Resistance levels are frequently recognized as previous highs or regions that the price has had difficulty rising above.
What is Open Interest?
Suppose there are five market participants A, B, C, D and E.
Now, on 4th Aug, A buys 20 Bank Nifty contracts from B, so the open interest (OI) would be 20. On 5th Aug, C Buys 30 Bank Nifty contracts from D. So the OI become 50. But on 6th Aug, A sells its 20 contracts to D. So the OI will come down to 30. Because these contracts are the old contracts exchanging hands. On the 7th Aug E buys 30 contracts from C. Now here also, the Open Interest will remain the same. the reason is this contract was the old contract.
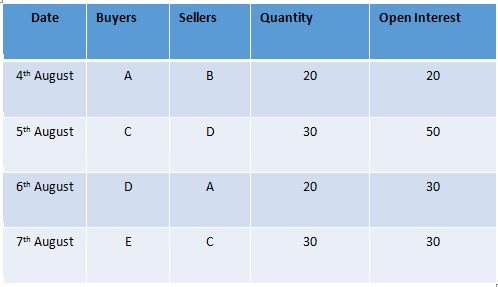
The point we need to remember here is that OI will increase only when a fresh contract is exchanged. Old contracts have no impact on open Interest. So far, we have understood how Open Interest functions.
Please take a look at the image. It portrays the basic interpretation of the market using Price and OI.
How is OI Calculated?
For options, open interest is determined as follows:
Long Call or Put: The open interest rises when a trader purchases (opens) a new call or put option contract.
Short Call or Put: The open interest is also increased when a trader sells (opens) a new call or put option contract.
Closing Positions: The open interest falls as a trader offsets an existing position (by buying back a short position or selling a long position), as the contract is no longer outstanding.
The open interest rises by ten if Trader A purchases ten call options from Trader B, who is the one selling them.
The open interest rises by five if Trader C sells five call options to Trader D, who purchases them.
The open interest falls by ten if Trader B resells the ten call options that Trader A purchased.
How do you use open interest for support and resistance?
We know time plays one of the key factors in options trading. Due to this reason we experience more sellers presence in the market than buyers.
A call options seller stands on the Bearish side, and a Put options seller holds a bullish view of the market. So if, at any particular strike price, a huge Open Interest build is visible, then it is obvious that it definitely signifies something important.
This huge addition in OI for any certain strike price defines the possibility of calculating support and resistance levels. For the call option, if at any certain level, a huge OI is present, it depicts a possible resistance level, and for the put option, an addition in OI signifies a possible support level at that strike price.
As we know, the OI is only applicable to future and Options contracts. Using open interest from the option chain, we can identify potential support and resistance levels.
Suppose in a security price’s call option OI has been built upon a certain level, And the same is true for a put option. So, we can assume that two zones could be the possible Resistance and Support zones for security.
Let’s understand the whole scenario with a real-time example.

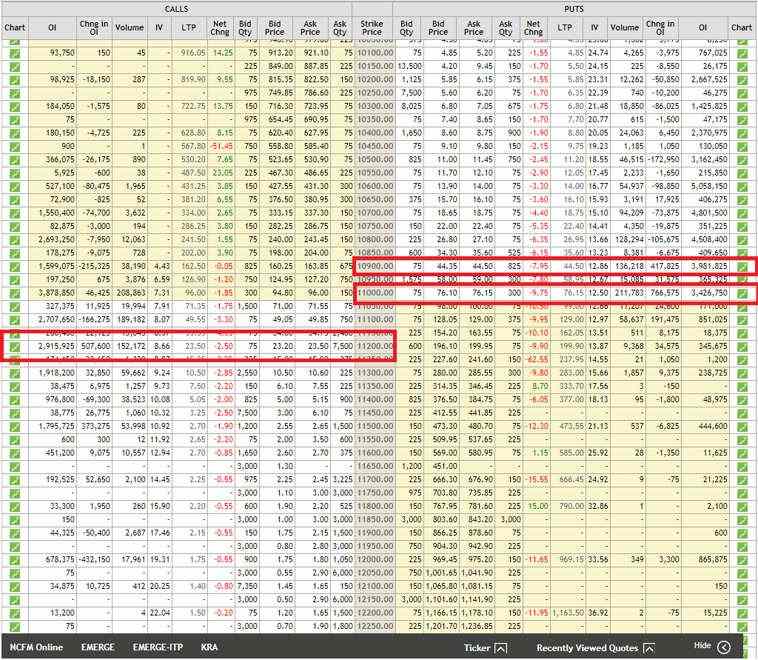
We have taken the Nifty option chain for July month. As we can see in this picture, in the call option (CE) segment, there is a huge addition of OI in the 11200 Strike price. On the other hand, for put options (PE), there is also a significant addition of OI in the 11000 and 10900 strike prices.
We can easily calculate Nifty’s support and resistance levels. Its resistance level is 11200, and for Support, we can take 11000 and 10900 levels.
Now let’s break it more.
What will happen when the price goes above the 11200 level?
The option seller will close their position once the price goes above the 11200 level because they will be facing a loss above that level. This short covering will push the price much higher.
In the case of 11000 and 10900 levels.
When the price goes below 11,000 or 10900, the put seller will start closing their position because they will incur a loss. So, we may experience a correction up to the 10600 level.
Unlock trading insights! Learn how Support and Resistance levels impact your strategy. Discover more here.
Combining Open Interest with Other Technical Indicators
OI helps a trader understand potential support and resistance levels for a stock or index. Some traders also take trades based on Open Interest.
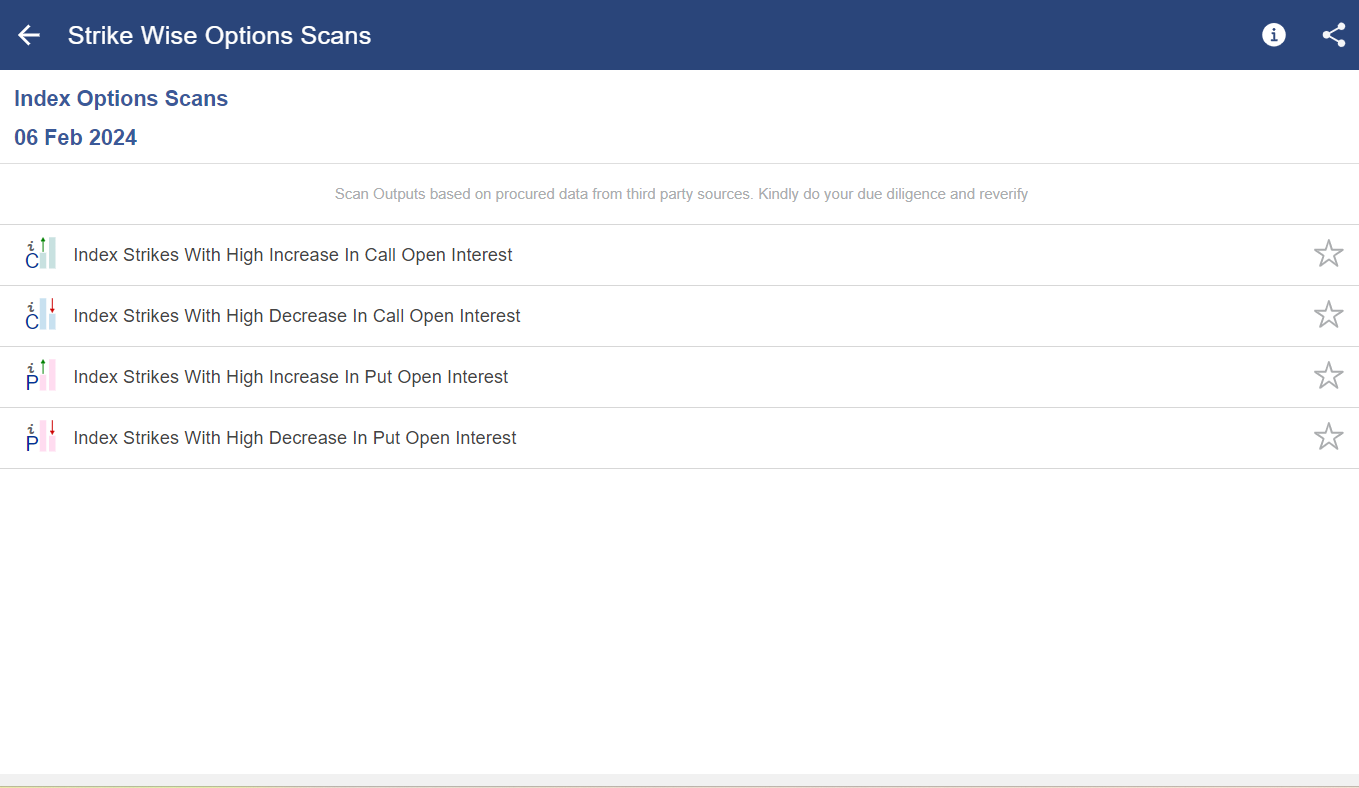
Anyone can check open Interest for any underlying in the equity derivatives tab from nseindia.com. Also, you can check the StockEdge application. StockEdge not only helps you to understand Open Interest for any security, but it also helps you find out whether a High Increase in Open Interest, a High Decrease in Open Interest, Index Strikes with a High Increase in Call Open Interest, Index strike with a High decrease in Put Open Interest, etc. There are multiple scans available like this in the StockEdge application, and there are also other exciting features available related to the Stock market. Please take a trip and see how amazing the application is.
Below is an Image showcasing the Open interest section of StockEdge.
Conclusion
Open Interest is a value that derives a number of fresh contracts exchanging hands or building up. Based on the number, traders make trading decisions. Please remember Open Interest acts as support while you are making any trading decision. Trading only based on Open Interest can come out very risky so please consider other technical and Fundamental factors to mitigate your risk.
Master currency trading techniques by leveraging Open Interest data for Support and Resistance calculation. Enroll in our Currency Trading Course now!
Frequently Asked Questions (FAQs)
1. What is support and resistance in trading?
Technical analysis uses the principles of support and resistance levels to determine price points at which a stock, commodity, or other financial instrument may halt or revert from its present trend. Resistance is the price level at which a concentration of supply is likely to cause an uptrend to pause, while support is the price level at which a concentration of demand is likely to cause a downtrend to pause.
2. How can OI data help in determining support and resistance levels?
OI data might reveal information about the strength of current trends and the mood of the market. When paired with price action research, open interest data can assist traders in determining critical levels of support and resistance. High open interest levels at particular price points may be a sign of high conviction or interest among traders, which could lead to zones of support or resistance.
3. Where to find OI data?
For options and futures contracts, open interest data is accessible through a number of online trading platforms. In addition to price and volume information, these platforms frequently provide sophisticated charting tools and analytics that incorporate open interest.


Thanks a lot. This is great content. I might share some for you guys too. Great work poster!
It is very interesting to read and got knowledge like me who is beginner in trading. Thanks a lot.
Hi,
We really appreciated that you liked our blog.
Keep Reading!!