Within the dynamic realm of financial markets, where complex tools and algorithms dominate the trading desks, Price Action Trading is a tried-and-true method that is both powerful and ageless.
Price action, which captures the collective decisions of many traders, is the portrayal of supply and demand dynamics in the complex movements of the market.
The basic yet deep premise of price action trading is that an asset’s price movement reflects all pertinent market information. It is critical to comprehend the meaning of price action, regardless of experience level, as it can help both new and seasoned traders build a strong foundation and investors improve their skills.
Before we dive into price action trading strategies, let us have a basic understanding of the relevance of price in trading using charts:
Table of Contents
Understanding Price Action
One of the core ideas of technical analysis is price action, which centres on analysing past price movements to forecast future market movements.
For traders and investors looking to understand the behaviour of the market, it is essential to grasp the fundamentals of price action.
Learn Price Action Trading with Price Action Trading Course by Market Expert
The following three elements constitute the fundamentals of price action:
Candlestick Patterns
Candlestick patterns are visual representations of price movements over a specific time period. They provide valuable information about market sentiment and potential trend reversals. Some common candlestick patterns include:
- Doji: Signifies market indecision, with an opening and closing price nearly equal.
- Engulfing Patterns: Indicates a potential reversal, where one candlestick engulfs the previous one.
- Hammer and Hanging Man: These patterns suggest potential trend reversals, with long lower wicks and small bodies.
- Morning Star and Evening Star: Three-candle patterns signalling potential reversals.
Traders use these patterns to identify entry and exit points, as well as to gauge the strength of a trend.
Support and Resistance
On a price chart, support and resistance are important levels that indicate past hurdles that the price has struggled to overcome.
Support: The price point at which an asset has a tendency to level off and possibly even rise. It functions as a safety net to stop further deterioration.
Resistance is the price at which an asset becomes less likely to rise and is therefore subject to a pullback. It functions as a barrier to stop upward mobility.
Traders can make more educated decisions about whether to enter or quit transactions by being aware of these levels. New trends can begin to emerge when these levels are broken or surpassed.
Trendlines
On a price chart, trendlines are lines that are used to show the strength and direction of a trend. They link important peaks in a downtrend or lows in an upward trend. Recognizing trend reversals and possible regions of support or resistance requires an understanding of trendlines.
- Uptrend Line: Indicates an upward trend and connects higher lows.
- Downtrend Line: Indicates a downward trend by joining lower highs.
- A horizontal trendline is a level of support or resistance where prices typically settle into a consolidation pattern.
Trendlines assist traders in staying on the correct side of the market by allowing them to base their decisions on the current market trend.
Reading Price Charts
Because price charts give traders and investors a visual depiction of market movements and patterns, reading them is an essential skill. There are several types of price charts, including line, bar, and candlestick charts. Here’s a summary on how to properly read and understand price charts:
1. Timeframes
- Short-Term (Intraday): For day trading, concentrate on hourly or minute charts.
- Medium-Term (Daily/Weekly): Good for spotting general trends and swing trading.
- Long-Term (Monthly/Yearly): Helpful for macro trend analysis by investors.
2. Types of Charts (Line, Bar, Candlestick)
Line Charts
Overview: A simpler perspective of the general trend is provided by line charts, which connect closing prices over a specified time period.
Application: Helpful in determining broad market direction and long-term patterns.
Bar Charts
Overview: Bar charts use vertical bars to show price data. A bar represents a price’s high, low, open, and close for a given time period.
Application: Price ranges, trends, and possible reversal patterns are all discernible to traders using bar charts.
Candlestick Charts
Overview: With its visually appealing presentation of the open, high, low, and closing prices, candlestick charts provide a more complete view.
Application: Candlestick patterns are frequently employed to analyse price activity and offer insights into market mood, trend reversals, and possible entry or exit positions. Green or white candles on bullish candlesticks indicate an upward trend in price.
What are the Key Principles of Price Action Trading?
The first thing that a price action trader should see is the market structure, i.e. which stage the market is in.
1. Market Structure
The market structure consists of 4 stages:
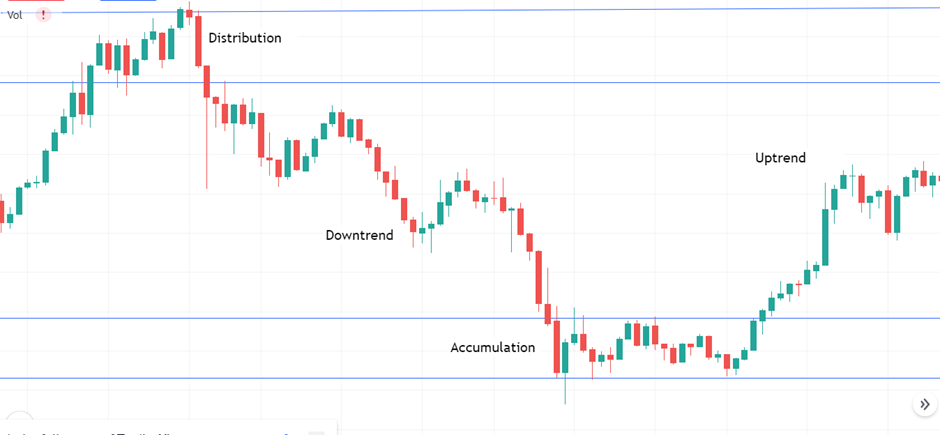
Stage 1- Accumulation
The accumulation stage occurs when the market has bottomed, and the early buyers begin to buy, figuring that the worst is over.
This stage looks like a range market but in a downtrend. When the price moves lower, bullish traders start buying as they consider the prices “too low”, which exerts buying pressure in the market.
Also, bearish traders in there in the market keep on selling in the hope that the downtrend will continue.
When we combine both buying and selling pressure, the market reaches an equilibrium stage and consolidates. If the prices break upside, then we can say that the market has bottomed and the trend has reversed to an uptrend as shown below:
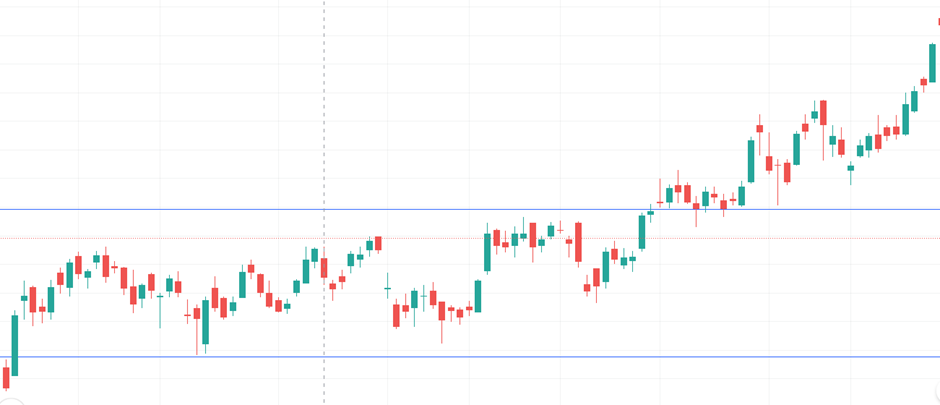
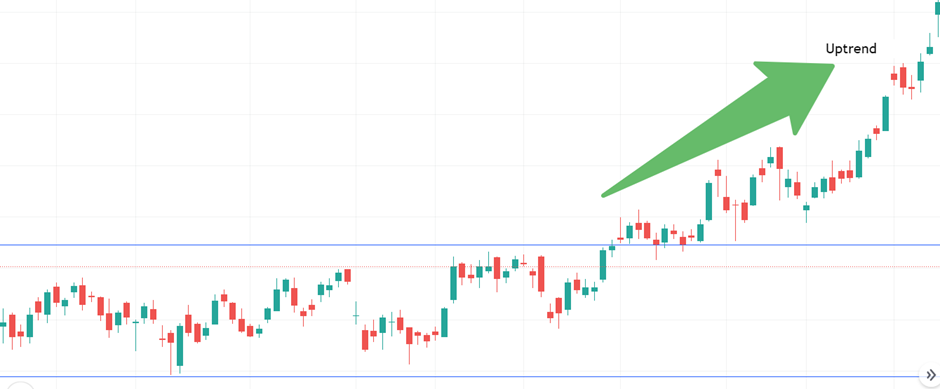
Stage 2- Advancing
The advancing stage occurs when the market has been stable for a while and starts moving higher.
At this stage, most traders start recognizing the uptrend and are looking for buying opportunities.
Stage 3- Distribution
The distribution stage looks like a range market but in an uptrend.
When the price moves higher, bearish traders enter and start taking short positions as the prices are considered to be “too high” which puts selling pressure on the market. But, at the same time, there are still bullish traders who are still buying, hoping that the trend will continue.
When we combine both buying and selling pressure, then the market consolidates. If the price breaks below the lowest level, we enter the last stage, i.e., a downtrend.
Stage 4- Downtrend
When the prices start making lower lows, we can say that the downtrend has begun, which is the last stage.
So before placing any trading order, one needs to understand in which stage the market is in, as explained above. This will help the price action traders to understand whether to buy, sell, or stay out of the markets.
2. Market Psychology
Price action is heavily influenced by market psychology, and successful trading requires an awareness of the behavioural characteristics of both buyers and sellers. The psychological aspects that affect market participants and price movements are examined in this section.
Understanding Buyer and Seller Behaviour
- Market Participants: Traders fall into one of two general categories: buyers or sellers. Each has different goals and approaches.
- Purchasers: Attempt to profit from increasing prices; frequently driven by encouraging news, solid fundamentals, or technical indicators.
- Sellers: Seek to profit when prices decline due to unfavourable news, poor fundamentals, or technical indicators pointing to a reversal.
- Knowing how different order types—such as market and limit orders—reflect the intentions of traders is important.
Emotional Influences on Price Action
The two main emotions influencing market behaviour are fear and greed. Fear causes selling panics, while greed fuels buying frenzy.
The tendency of traders to follow the herd, which causes inflated price swings, is known as the “herd mentality.”
Overconfidence: Having too much confidence can cause one to act impulsively and disregard risk management guidelines.
Loss aversion is a psychological bias that affects decision-making and occurs when people would rather avoid losses than obtain comparable gains.
Impact of News and Events: News and events from outside sources, including business earnings, political developments, or economic reports, can cause emotional reactions in investors and affect their decisions to buy or sell.
Market mood Indicators: Put/call ratios, and the Fear and Greed Index are two examples of tools that can be used to gauge the general market mood.
What are the Common Price Action Patterns?
Here are some common price action patterns
1. Reversal Patterns
In technical analysis, reversal patterns are important indicators because they indicate possible shifts in the dominant trend.
Traders can gain important insights into market dynamics by identifying these patterns, which will aid them in choosing the best times to enter and exit the market. Two notable reversal patterns are as follows:
Head and Shoulders
Overview: A reversal pattern known as the Head and Shoulders pattern usually denotes a change in trend from an upward to a downward one.
Components
- Left Shoulder: The highest point on an upward-trending price chart.
- Head: Following the left shoulder, a higher peak developed, indicating that the uptrend may be waning.
- Right Shoulder: An additional peak that is comparable in height to the left shoulder and lower than the head.
- The neckline is the amount of support that is created by joining the head, right shoulder, and left shoulder lows.
- Signal: A possible trend reversal is indicated by the right shoulder’s completion, and it is confirmed by a break below the neckline.
- Target: After the pattern is completed, the distance between the head and the neckline is frequently utilized to predict the possible downward move.
Double Tops and Bottoms
Formation: Price hits a low, rises, falls again, and then breaks above the high that came before (neckline).
Signal: The pattern is validated, and a possible turnaround from a downtrend to an uptrend is suggested by the break above the neckline.
Target: The probable price move following pattern confirmation is commonly estimated by measuring the distance between the double top and neckline (or double bottom and neckline).
Triple Bottoms and Tops: A variation in which there are three price troughs or peaks as opposed to two.
2. Continuation Patterns
Technical analysis formations known as continuation patterns indicate that a trend may temporarily consolidate before the price reverts to its prior path.
These patterns are used by traders to spot possible openings to enter trades that follow the direction of the current trend. Two typical continuation patterns are as follows:
Flags and Pennants
Overview: Before the dominant trend returns, flags and pennants, which are short-term continuation patterns, signify a brief period of consolidation.

Formation: A consolidation with a rectangular shape and a slope that deviates from the general trend.
Signal: A possible continuation of the previous trend is indicated when the price breaks out of the flag pattern and moves in that direction.
Pennants
Formation: Following a significant price move, a little, symmetrical triangle forms.
Signal: The breakout from a pennant in the direction of the previous trend implies a possible continuation, much as flags.
Target: To estimate the possible price move following the breakout, traders frequently utilize the height of the flagpole or the first price movement.
Triangles
Overview: Triangles are continuation patterns that show a period of consolidation before the price resumes its prior trend. They are distinguished by converging trendlines.
Symmetrical Triangles
Formation: A symmetrical triangle is formed by the trendlines converging.
Signal: A breakout from the triangle in any direction points to the possibility that the current trend will continue.
Ascending Triangles
The formation consists of a rising lower trendline and a flat top trendline.
Signal: An uptrend may continue if there is a breakout above the flat trendline.
Descending Triangles
The formation consists of a falling top trendline and a flat lower trendline.
Signal: A break below the flat trendline points to a possible downturn extension.
Target: Following a breakout, traders frequently estimate the height of the triangle to predict the direction of future prices.
Price Action Trading Strategies
Let us discuss some price trading strategies
1. Trend Following Strategies
Traders employ trend-following tactics as a means of spotting and profiting from current market patterns. Instead than trying to forecast market reversals, these techniques try to capitalize on the momentum of current movements. Here are two well-liked methods for following trends:
Moving Averages– The Death Cross and the Golden Cross
A possible uptrend is indicated by a “golden cross,” which is formed when a short-term moving average crosses above a long-term moving average.
A death cross, which suggests a possible decline, is formed when a short-term moving average crosses below a long-term moving average.
Signal Confirmation: To verify the direction of a trend, traders frequently look at crossovers and the price’s relationship to the moving average.
Trendline Breakouts
First, let us discuss what build-up is. A build-up is a tight consolidation area where we notice that the size of the candles gets smaller.
So, a breakout with build-up helps the traders identify high-probability breakouts.
The main reason behind this is the bulls and bears at war near the resistance area. Therefore, the bulls will try to push the prices higher to break out from the resistance area.
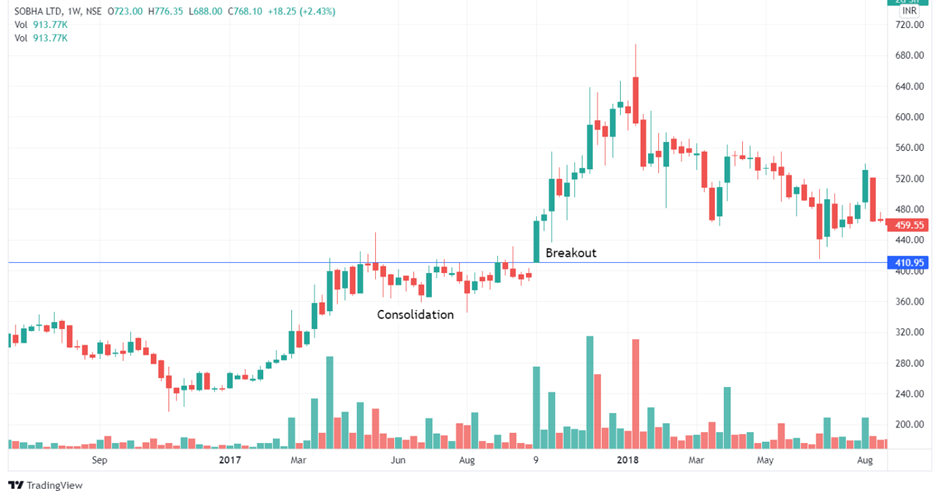
Whereas the bears will try to make prices fall from the resistance area. Thus, the prices enter a consolidated zone.
One can trade with this price action pattern when the prices break out after a tight consolidation zone near the resistance or support area.
2. Counter-Trend Strategies
To make money from price movements that stray from the prevailing trend is the aim of countertrend trading systems. While trend-following methods ride the trend, counter-trend tactics, such as Mean Reversion and Fibonacci Retracements, focus on identifying instances when the price is likely to reverse.
Mean Reversion
The theory of mean reversion holds that asset prices eventually return to their historical mean or average. Put another way, there is a propensity for an asset’s price to return to its average if it deviates considerably from it.
Strategy
Finding Extremes: Traders search for circumstances in which the price has deviated significantly from its historical average, suggesting a chance for a mean reversion.
Purchasing Oversold, Selling Overbought: In the event that an asset is trading below its historical average and is, therefore, deemed oversold, a trader may choose to purchase it with the expectation that the price will eventually return to the mean. On the other hand, a trader may think about selling if the asset is overbought (trading above its historical average).
Fibonacci Retracements
Fibonacci ratios (38.2%, 50%, 61.8%, etc.) are used to determine probable levels of support or resistance where the price may retrace before moving forward in the initial direction. This is the basis for Fibonacci retracements.
Strategy
Finding Retracement Levels: Traders can pinpoint probable locations for a price retracement by using Fibonacci retracement levels.
Purchasing at Support, Selling at Resistance: If the market is in a downward trend and begins to turn around, a trader may choose to sell close to a Fibonacci resistance level, anticipating that the market will turn back downhill. On the other hand, if the price is in an uptrend and retraces lower, a trader may think about purchasing close to a Fibonacci support level in anticipation of the rally continuing.
3. Range-Bound Strategies
Trading methods known as “range-bound” techniques work well when the price of a financial instrument, like a stock or currency pair, is moving within a predetermined range or is clearly constrained by levels of support and resistance. Bollinger Bands and support and resistance trading are two well-liked range-bound techniques.
Support and Resistance Trading
Technical analysts use the notions of support and resistance to assist them in identifying levels at which a price is likely to stop and reverse course. A financial instrument has a historical tendency to stop dropping at support levels and to cease rising at resistance levels.
Strategy
Buy at Support: When the price gets close to a support level, traders search for opportunities to make a purchase. It is anticipated that the price would rise after rising off the support.
Sell at Resistance: On the other hand, traders may think about selling when the market hits a resistance level in anticipation of a decline in price.
Bollinger Bands
Bollinger Bands are a type of technical analysis tool where the two outside bands represent standard deviations away from the N-period moving average (SMA) and the middle band represents an N-period SMA.
Strategy
Purchase at Lower Band: Investors who anticipate a possible rebound towards the middle or higher band may choose to purchase when the price approaches or dips below the lower Bollinger Band.
Sell at Upper Band: On the other hand, traders who expect a retracement into the middle or lower band may choose to sell when the price approaches or surpasses the upper Bollinger Band.
Risk Management in Price Action Trading
Effective risk management is essential to profitable trading, and price action trading is no exception. The following is a summary of important risk management ideas related to price action trading:
1. Setting Stop-Loss Orders
An order to purchase or sell a stock or currency pair at a specific price is known as a stop-loss order, and it is placed with a broker. It is a tool for risk management that helps to reduce possible losses.
Finding Important Levels: When making trading decisions, price action traders frequently rely on finding important support and resistance levels, trendlines, or chart patterns.
Stop-Loss Placement: To allow for small swings and to quit the trade if the price moves against the predicted direction, stop-loss orders are usually set slightly beyond these important levels or patterns.
2. Position Sizing
Determining the appropriate amount of capital to invest in a specific trade is known as position sizing. It helps regulate the amount of exposure to the market, making it an essential component of risk management.
Volatility Consideration: When choosing the right position size, price action traders take the market’s volatility into account.
Average True Range, or ATR, is an indicator that some traders use to measure market volatility and modify the size of their positions accordingly.
3. Risk-Reward Ratio
The potential profit versus probable loss in a trade is measured by the risk-reward ratio. Based on the possible rewards in relation to the risk, it assists traders in determining if a transaction is worthwhile.
Setting profit goals is based on identifying important levels or regions that price action traders believe the price will eventually hit.
Aiming for a positive risk-reward ratio, like 2:1 or 3:1, which indicates that the possible profit is two or three times the potential loss, is how traders typically set their ratios.
Developing a Price Action Trading Plan
Creating a well-thought-out price action trading strategy is essential to financial market success. Here is a summary of important elements to take into account when formulating a trading strategy based on price action:
Creating a Trading Routine
A trading routine is a series of actions and procedures that traders constantly carry out in order to get ready for and carry out their deals. It facilitates the development of an organized trading strategy.
Setting Realistic Goals
Creating a trading plan requires first defining clear, attainable goals. Setting goals gives you a clear path forward and success standards.
Aim Setting Components:
- Financial Objectives: Establish clear financial goals, including profit targets for the next day, week, or month.
- Performance Objectives: Establish objectives for trade accuracy, overall trading performance, and risk-reward ratios.
- Learning Objectives: Set objectives for continued education and the improvement of your trading strategy and price action analysis skills.
Keeping a Trading Journal
A trading journal is a tool used by traders to keep track of their observations, feelings, and deals. It is an invaluable tool for growth and education.
Ready to master advanced technical analysis? Dive into our course after exploring ‘A Guide to Price Action Trading Strategies
Conclusion
In summary, Price Action Trading Strategies present a convincing and adaptable method for interacting with the financial markets. Traders using this strategy can uncover important information about market dynamics, pinpoint possible entry and exit points, and make well-informed judgments by depending just on raw price data and chart patterns.
Frequently Asked Questions (FAQs)
Is price action trading profitable?
Like every trading method or instrument, its effectiveness depends on how it is used. Numerous prosperous traders and investors have demonstrated that price action trading can be rewarding.
Which indicator is best for price action?
Any price action trader’s toolbox should include the Supply and Demand Indicator. It helps traders make well-informed judgments in the dynamic world of financial markets by offering objective, lucid signals based on supply and demand concepts.
How do you master price action trading?
It can take some time to become proficient in price-action trading despite being a very popular trading strategy. Open your chart, search for recognizable patterns, note significant levels of support and resistance, and use higher highs and lower lows to determine whether the market is trending or not.


