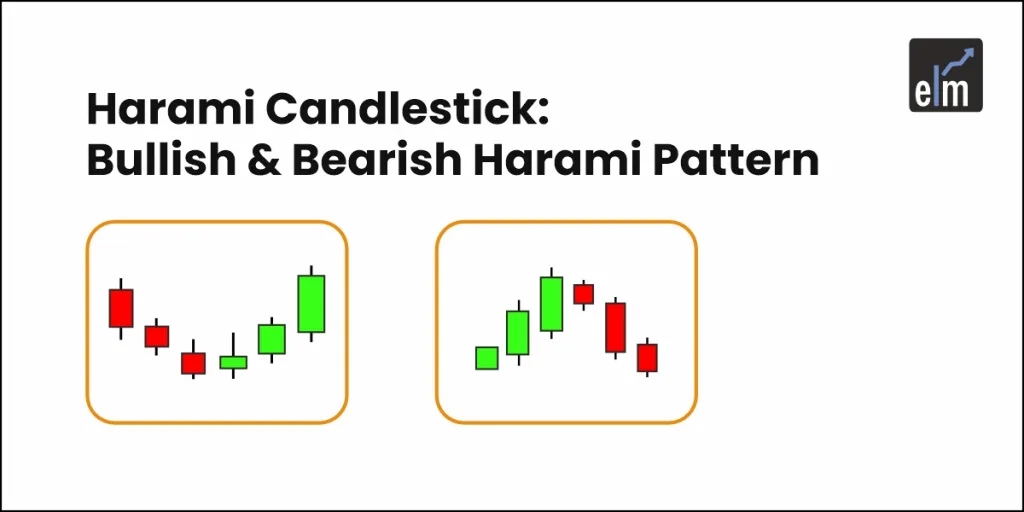
9 Types of Volume Indicators a Trader Should Know
May 22, 2025
Top 9 Must Read Fundamental Analysis Books
May 27, 2025
Forex vs Stocks: Which Market Should You Trade First
May 13, 2025
How to Use Collar Option Strategy?
May 2, 2025
Learn how to interpret Marubozu patterns and integrate them into your trading strategy for enhanced decision-making. Elevate your trading knowledge with insights into this single-candlestick pattern that speaks volumes about market sentiment.
"Discover the power of bullish engulfing candlestick patterns in technical analysis. Learn how this bullish reversal pattern, characterized by a smaller red candle followed by a larger green candle, signals potential upward market momentum. Enhance your trading skills with insights...
Unlock market insights with the piercing candlestick pattern – a powerful technical analysis tool in trading. Learn how this bullish reversal pattern signals potential trend changes, helping you make informed decisions and maximize your trading success. Explore the significance of...
Chart patterns play a crucial role when analyzing the charts for trading. In technical analysis, the transitions in the trends are signaled by these charts patterns. By learning about these chart patterns, you will be able to learn how to...
Bearish Reversal Candlestick Patterns indicate that the ongoing uptrend is going to end and it may reverse to the downtrend.
Bullish Reversal Candlestick Patterns indicate that the ongoing downtrend is going to end and it may reverse to an uptrend.
The trend is your friend”- quoted by Martin Zweig holds absolutely true when it comes to swing trading. Swing trading is all about making bigger profits by following the trend. Read our blog to know the 5 Most Used Swing...
Relative Strength Index (RSI) is a momentum oscillator, developed by J. Welles Wilder, which measures the speed and velocity of price movement of trading instruments (stocks, commodity futures, bonds, forex, etc.) over a specified period of time. The objective of...
One of the most widely utilized momentum oscillators in the field of technical stock analysis is the Relative Strength Index (abbreviated RSI). Welles Wilder first presented it in June 1978, and his book New Concepts in Technical Trading System goes...
In today's blog let us discuss how to trade with Elliot Wave Theory which was developed by Ralph Nelson Elliott.
Elliott Wave Pattern- Do you know that these patterns can help you in understanding market behaviour? In this blog, we will discuss the 5 main types of Elliott Wave Pattern which will help the traders in predicting the market behaviour.
So many price action patterns in technical analysis, but which ones work in stock trading? Do you also wonder that? So, in today's blog, let us discuss the Top 5 Price Action Patterns that work in Stock Trading:
Elearnmarkets (Kredent InfoEdge Pvt. Ltd.) is a SEBI-registered Research Analyst (RA) entity (SEBI Registration No.: INH300007493). The information provided in this article is for educational and informational purposes only and should not be considered as an offer to buy or sell any securities or investment products.
The stocks, securities, and investment instruments mentioned herein are not recommendations under SEBI (Research Analysts) Regulations, 2014. Readers are advised to conduct their own due diligence and seek independent financial advice before making any investment decisions.
Investments in securities markets are subject to market risks. Please read all related documents carefully before investing. Investing in Equity Shares,
Derivatives, Mutual Funds, or other instruments carry inherent risks, including potential loss of capital. Elearnmarkets (Kredent InfoEdge Pvt. Ltd.) does not provide any guarantee or assurance of returns on any investments. Past performance is not indicative of future performance.