Elearnmarkets - Financial Market Learning
  • Categories
    • Basic Finance
    • Derivatives
      • Futures
      • Options
    • Financial Planning
    • Fundamental Analysis
    • Technical Analysis
    • Marketshala
    • Miscellaneous
  • Language
    • English
    • Hindi
    • Bengali
No Result
View All Result
  • Courses
  • Webinars
  • Stories
Elearnmarkets - Learn Stock Market, trading, investing for Free
No Result
View All Result
Home Technical Analysis
Trading with Elliott Wave 1

Trading with Elliott Wave

Vivek Bajaj by Vivek Bajaj
November 28, 2023
in Technical Analysis, Charts, Patterns & Indicators
Reading Time: 6 mins read
0
11.5k
VIEWS
Share on FacebookShare on XShare on WhatsApp

Technical analysis’ Elliott Wave theory is used to explain price changes in the stock market. Ralph Nelson Elliott created the hypothesis after observing and identifying recurrent, fractal wave patterns. Consumer behaviour and stock price movements both exhibit waves.

The theory holds as these are recurring patterns, the movements of the stock prices can be easily predicted. Investors can get an insight into ongoing trend dynamics when observing these waves which also helps in deeply analysing the price movements.

So, in today’s blog let us discuss Trading with Elliott Waves:

Table Of Contents
  1. What is the Elliott Wave?
  2. How does Elliot Wave work?
  3. Decoding Elliott Wave Impulsive Pattern
  4. Decoding Elliott Wave Corrective Pattern
  5. Elliott Wave with Fibonacci
  6. Bottomline 
  7. Frequently Asked Questions
    • Does Elliott Wave really work?
    • What is the Elliot wave theory?
    • Which is the longest wave in the Elliott Wave?

What is the Elliott Wave?

The Elliott wave principle is a form of technical analysis that helps traders in analysing the financial market cycle.

With the help of this Elliott wave theory, traders can forecast market trends by identifying extremes in prices and investor psychology.

Trading with Elliott Wave 2

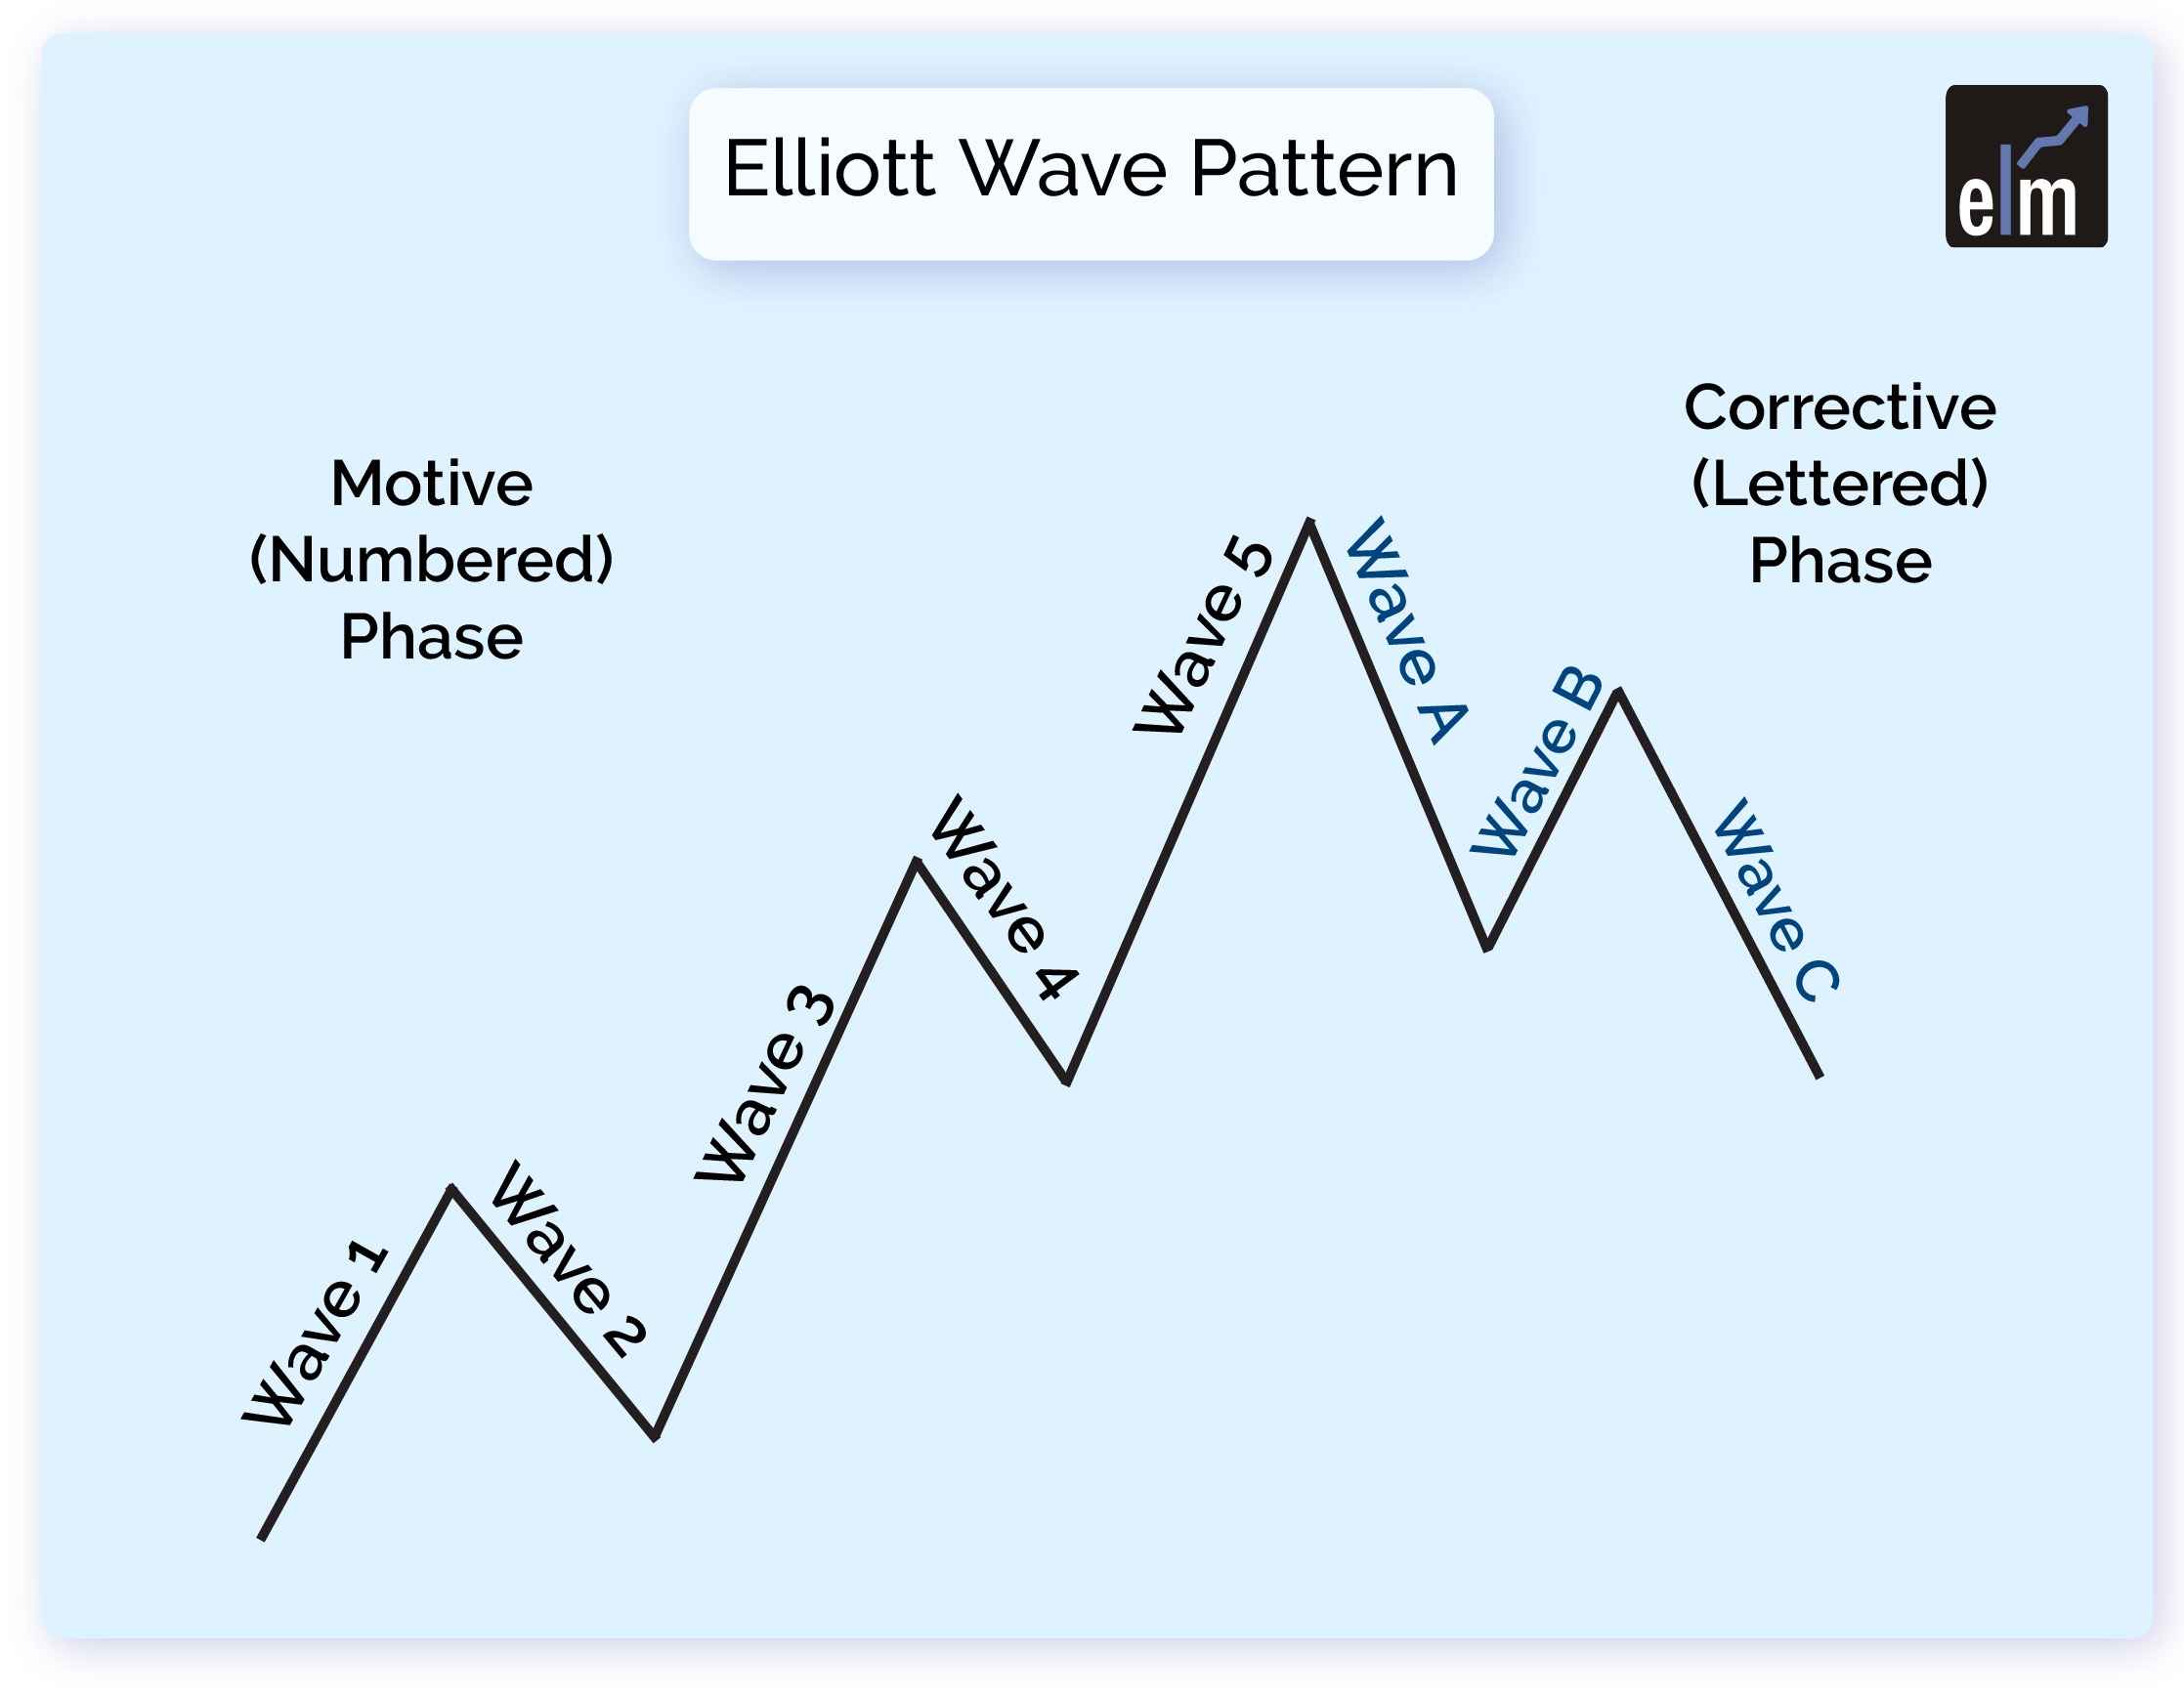
Elliott Wave Theory suggests that movements of the market follow a sequence of crowd psychology cycles. The Elliott Wave Patterns are formed according to the ongoing market sentiment, which alternates between bullish and bearish cycles.

How does Elliot Wave work?

The Elliott wave theory is a type of technical analysis that aids traders in understanding the cycles of the financial markets.

By spotting extremes in price and investor psychology, traders can predict market patterns using the Elliott wave theory.

According to Elliott Wave Theory, market movements are said to be influenced by a series of cycles in crowd psychology. The current market attitude, which alternates between bullish and bearish cycles, determines how the Elliott Wave Pattern is generated.

The concept of wave analysis as a whole does not equal to a typical blueprint formation where you just follow the instructions, unlike most other price formations. Wave analysis provides insights into trend dynamics and aids in a deeper understanding of price movements.

RelatedPosts

5 Powerful Bearish Candlestick Patterns 4

5 Powerful Bearish Candlestick Patterns

November 30, 2023
97.9k
5 Powerful Bullish Candlestick Patterns 5

5 Powerful Bullish Candlestick Patterns

November 30, 2023
135.2k
All 35 Candlestick Chart Patterns in the Stock Market-Explained 6

All 35 Candlestick Chart Patterns in the Stock Market-Explained

November 27, 2023
2.1M

Decoding Elliott Wave Impulsive Pattern

Five subwaves make up an impulse wave, which moves overall in the same direction as the trend of the largest degree.

The most prevalent and straightforward to identify motive wave in a market is this pattern. It is made up of five sub-waves, five motive waves, three of which are likewise motive waves, and two corrective waves. This is classified as a 5-3-5-3-5 structure, as was previously illustrated.

What is Elliott wave pattern and how to decode Elliott Wave Impulsive Pattern

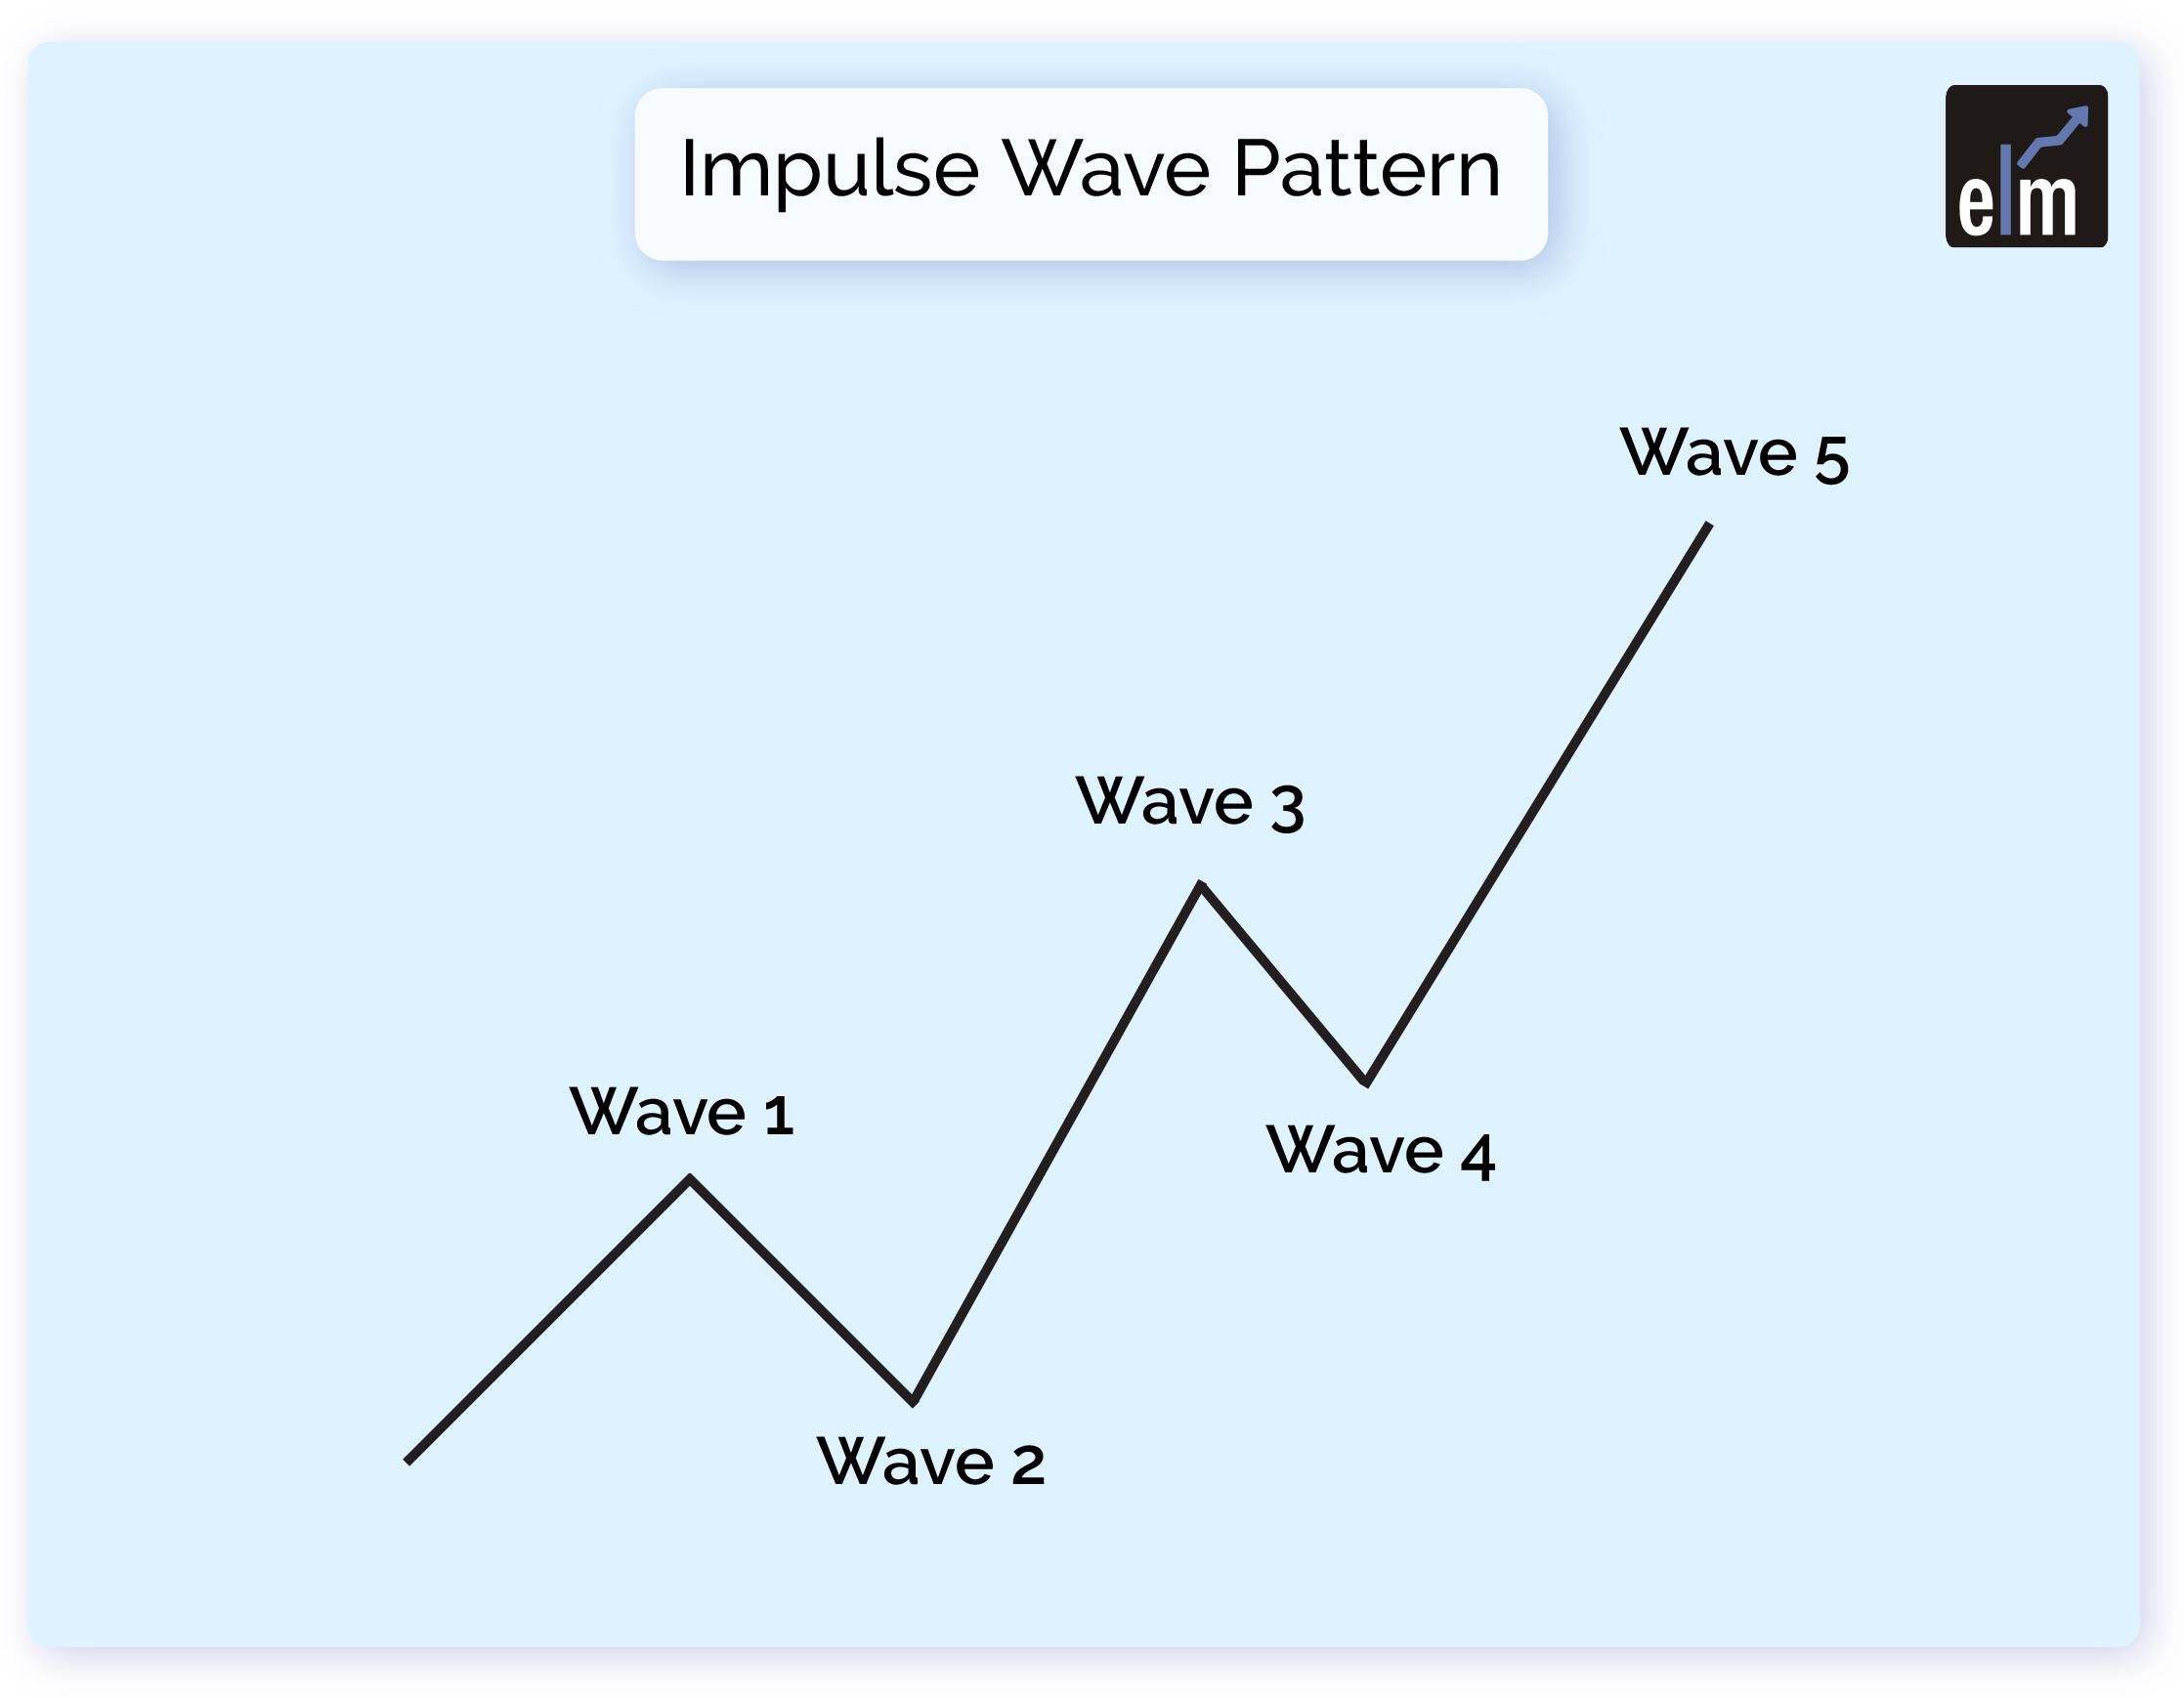
Its creation is governed by three unbreakable rules:

  • Wave two cannot retrace the preceding wave more than 100%.
  • Of waves one, three, and five, the third wave can never be the shortest.
  • Wave four cannot ever advance past the third wave.

The structure is not an acceptable structure if one of these rules is broken.

Decoding Elliott Wave Corrective Pattern

Corrective waves, also known as diagonal waves, are composed of three sub-waves or a combination of three sub-waves that result in a net movement that is perpendicular to the trend of the next-largest degree. 

Its objective, like with all motive waves, is to move the market in the trend’s direction.

Trading with Elliott Wave 3

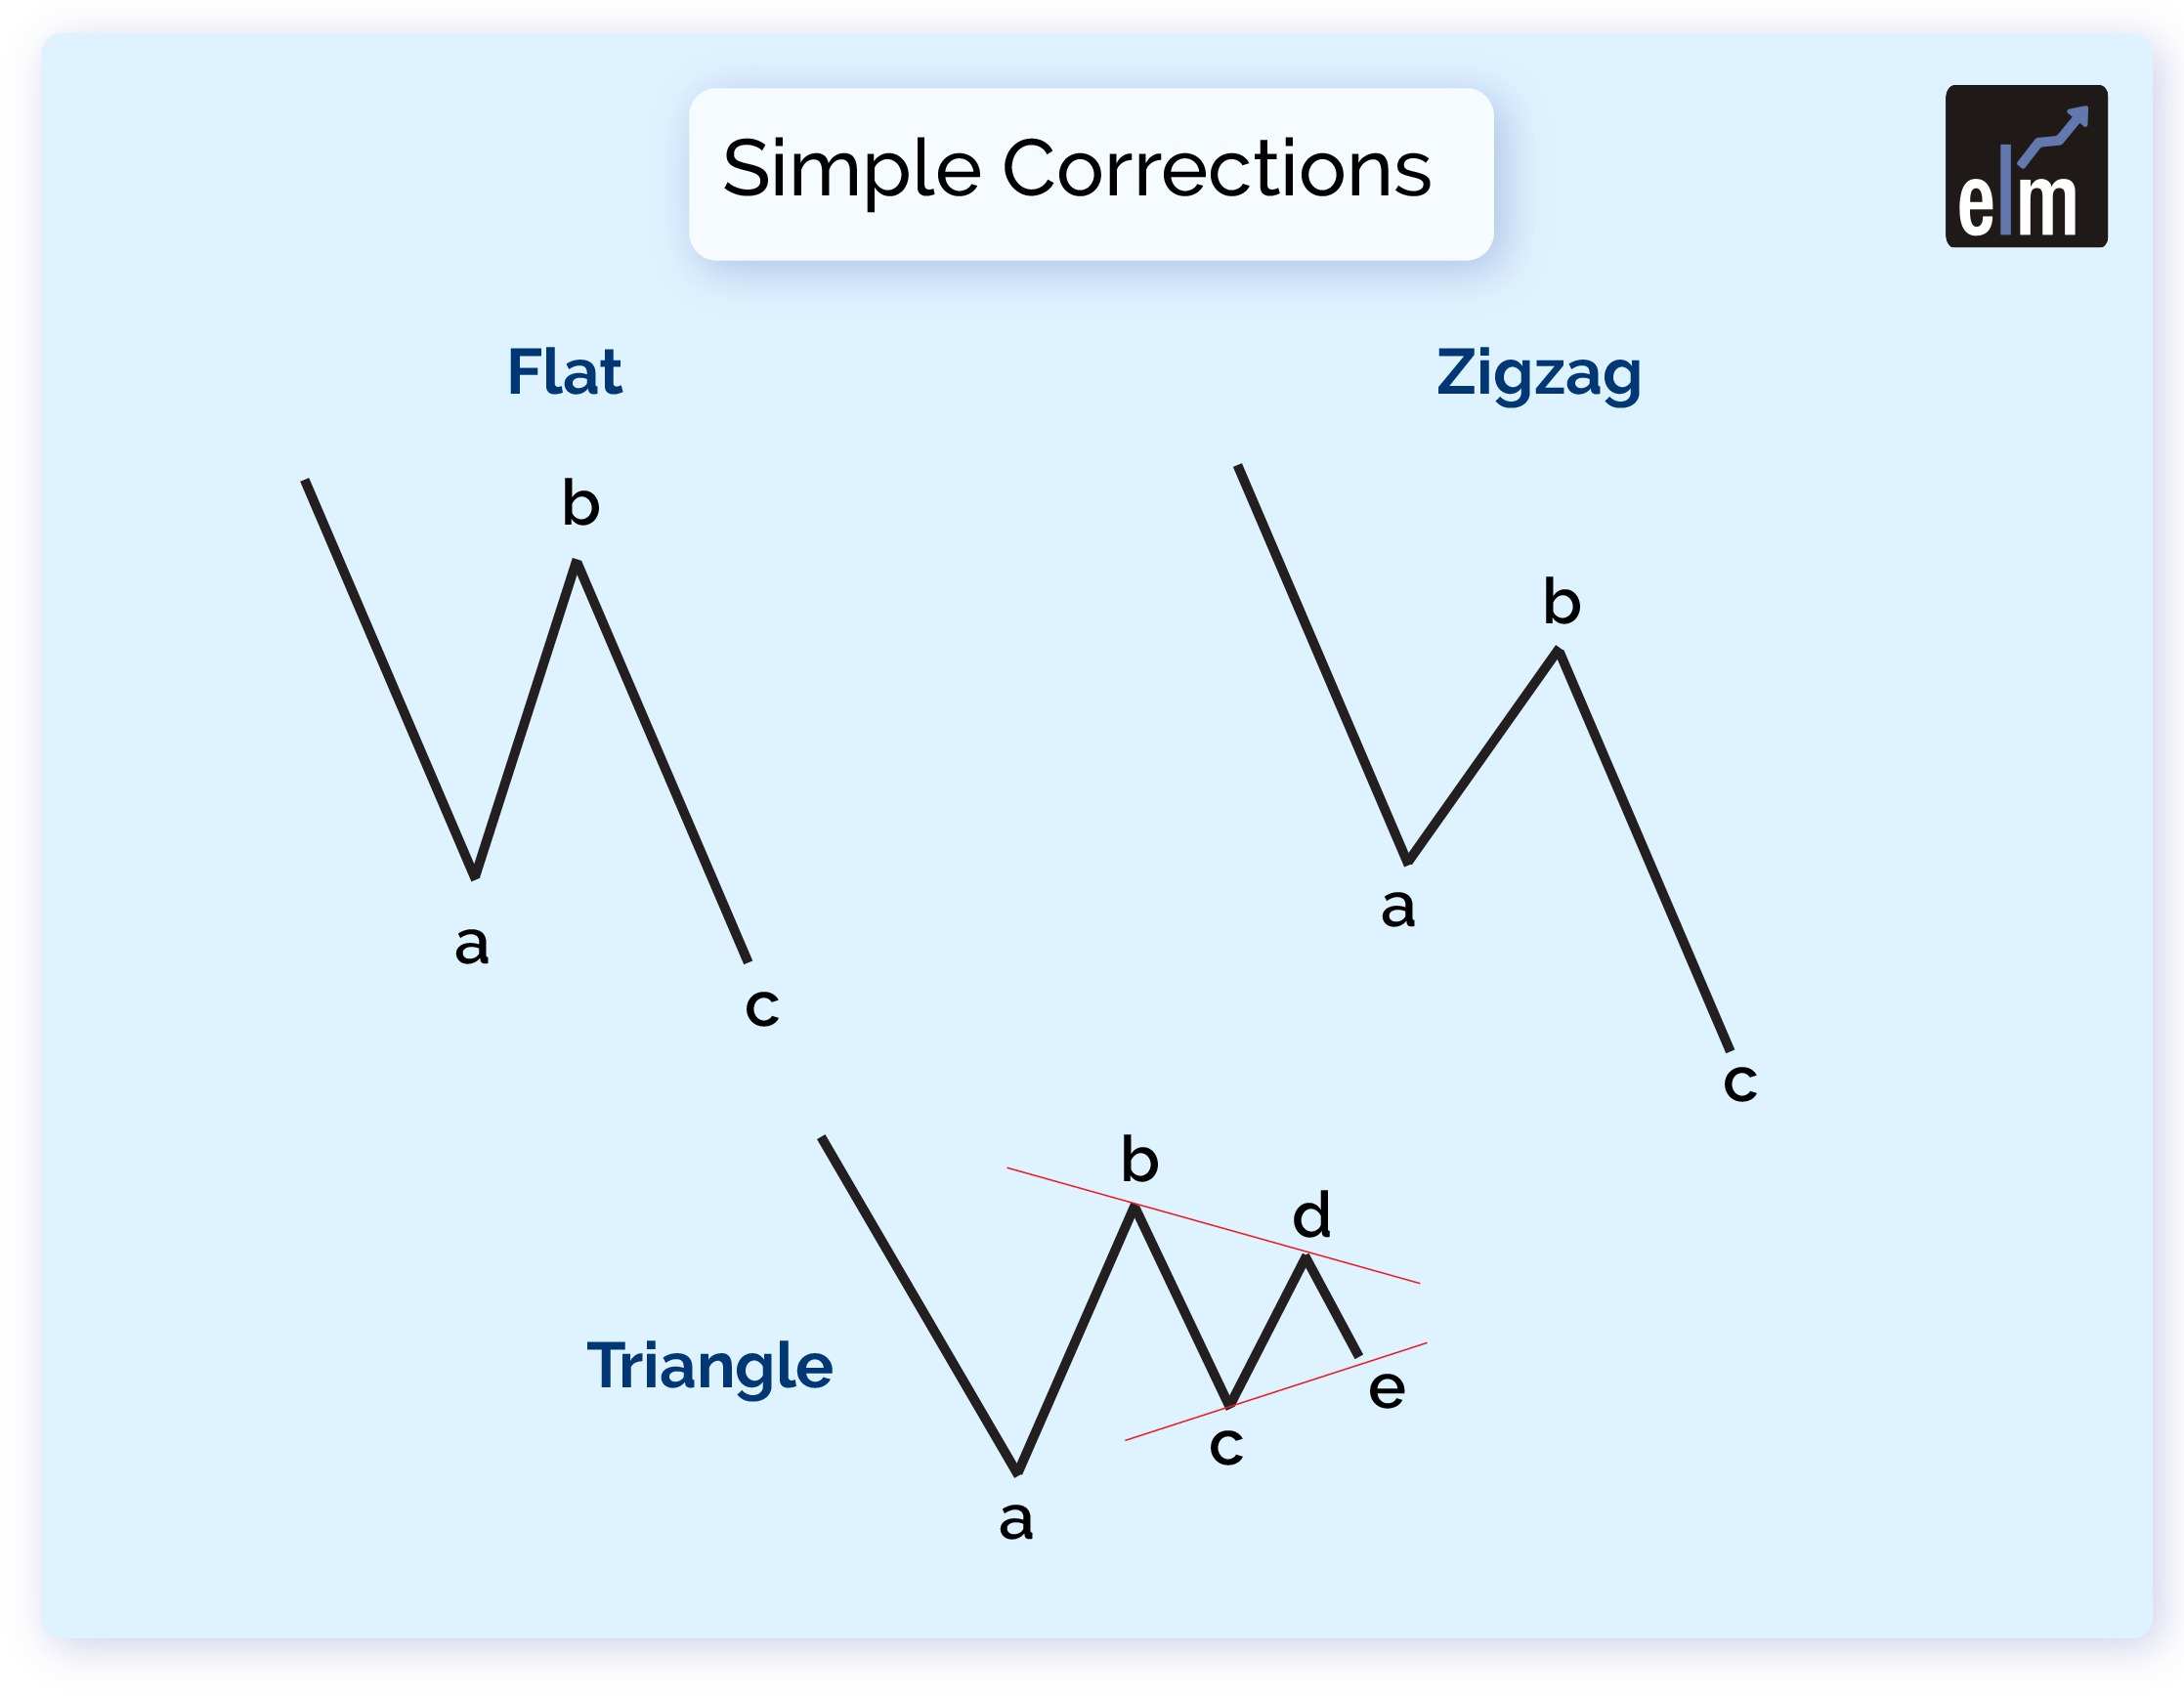
There are five sub-waves in the corrective wave. The diagonal is different because it might seem like a wedge that is either extending or contracting. 

Depending on the sort of diagonal being observed, the sub-waves of the diagonal may not have a count of five. Every sub-wave of the diagonal, like the motive wave, never exactly repeats the previous sub-wave, and wave number three of the diagonal may not be the shortest wave.

Elliott Wave with Fibonacci

Corrective wave application emphasises the potential for cross-studying Fibonacci retracements. Fibonacci levels were not directly used by Elliott, although traders have done so to make the conventional theory more complex.

Which Fibonacci retracement levels might be applied at different stages in the trend are highlighted by the previously stated principles. The 23.6 percent -50 percent levels would be of special interest to a trader searching for a fourth wave given rule three, who would also be looking for it to be reasonably shallow. 

elliott wave

Additionally, we can look for the correct A, B, and C move to represent a retracement of 50% to 61.8% of the overall 1-5 impulse move.

Bottomline 

For many people all across the world, Elliott Wave theory continues to provide markets a sense of structure. The capacity to constantly adjust the theory whenever a rule is breached can make it difficult to employ the theory as a trading tool. 

But it also significantly improves trend recognition’s level of clarity. Elliott’s original principles can be made as complex as a trader wants, but it is unquestionably an approach that many traders choose to prioritise in their market tactics.

Frequently Asked Questions

Does Elliott Wave really work?

The Elliott wave principle as it is currently applied is not a sound theory; rather, it is a powerful narrative skillfully conveyed by Robert Prechter. The story is particularly convincing because EWP seems to have the extraordinary ability to fit any historical market segment, right down to the smallest changes.

What is the Elliot wave theory?

A type of technical analysis known as Elliott Wave Theory searches for recurring long-term price patterns connected to enduring shifts in investor psychology and sentiment. According to the idea, there are impulse waves that initiate patterns and correction waves that run counter to the main trend.

Which is the longest wave in the Elliott Wave?

Typically, Elliott Wave (3) is the longest and strongest wave. Elliott Wave (3) is often a trend’s greatest and strongest wave.

Tags: basicElliott wave theoryenglishtechnical analysis
ShareTweetSend
Get Kotak Offer Get Kotak Offer Get Kotak Offer
Previous Post

5 Types of Elliott Wave Pattern to Understand the Market Behaviour

Next Post

All About Muhurat Trading 2023

Vivek Bajaj

Vivek Bajaj

Mr. Vivek Bajaj has over 18 years of trading experience in equities, options, currencies, and commodity markets. He is the co-founder of Stockedge and Elearnmarkets and is passionate about data, analytics, and technology. He serves on various exchange committees and has played a significant role in the evolution of India's derivative market. He has been a speaker at various colleges and higher institutions, including IIT and IIMs.

Related Posts

5 Powerful Bearish Candlestick Patterns 7
Technical Analysis

5 Powerful Bearish Candlestick Patterns

November 30, 2023
97.9k
5 Powerful Bullish Candlestick Patterns 8
Technical Analysis

5 Powerful Bullish Candlestick Patterns

November 30, 2023
135.2k
All 35 Candlestick Chart Patterns in the Stock Market-Explained 9
Charts, Patterns & Indicators

All 35 Candlestick Chart Patterns in the Stock Market-Explained

November 27, 2023
2.1M
Super Successful Techno Funda Stock Market Strategy 10
Fundamental Analysis

Super Successful Techno Funda Stock Market Strategy

November 28, 2023
1.4k

Leave a Reply Cancel reply

Your email address will not be published. Required fields are marked *

Elearnmarkets Logo

Follow Us

Facebook-f Twitter Instagram Linkedin-in Youtube Telegram

Register on Elearnmarkets

Continue your financial learning by creating your own account on Elearnmarkets.com

Register Free Account

Download App

Playstore logo
Download on app store

Categories

  • Basic Finance
  • Derivatives
  • Financial Planning
  • Fundamental Analysis
  • Technical Analysis
  • Marketshala
  • Miscellaneous

Popular On Elearnmarkets

  • Market Superheroes:
  • Vivek Bajaj
  • Chetan Panchamia
  • Ashish Kyal
  • Premal Parekh
  • Abhijit Paul
  • Jegan
  • Sivakumar Jayachadran
  • Vishal Malkan
  • Jyoti Budhia
  • Vivek Gadodia
  • Vishal Mehta
  • Piyush Chaudhry
  • Santosh Pasi
  • Gomathi Shankar
  • Market Superheroes:
  • Vivek Bajaj
  • Chetan Panchamia
  • Ashish Kyal
  • Premal Parekh
  • Abhijit Paul
  • Jegan
  • Sivakumar Jayachadran
  • Vishal Malkan
  • Jyoti Budhia
  • Vivek Gadodia
  • Vishal Mehta
  • Piyush Chaudhry
  • Santosh Pasi
  • Gomathi Shankar
  • Courses:​
  • Options Trading
  • Dow Theory
  • Momentum Trading
  • Stock Investing
  • Stock Market for Beginners
  • Harmonic Chart Patterns
  • Algo Trading
  • Elliot Wave Theory
  • Advanced Excel
  • Cryptocurrency
  • NSE Certification Course
  • Courses:​
  • Options Trading
  • Dow Theory
  • Momentum Trading
  • Stock Investing
  • Stock Market for Beginners
  • Harmonic Chart Patterns
  • Algo Trading
  • Elliot Wave Theory
  • Advanced Excel
  • Cryptocurrency
  • NSE Certification Course
  • Webinars:
  • Bank Nifty Scalping
  • Intraday Trading Strategies
  • Options Trading Strategies
  • Options selling
  • Price Action
  • Relative Strength
  • Tax Planning
  • Options Buying
  • Growth Stocks
  • Portfolio Management
  • Relative Strength Index
  • Risk Management
  • Renko Charts
  • Crude Oil
  • Traders Psychology
  • Moving Average
  • Multibagger Stocks
  • Free Learning Modules:
  • Intraday Trading
  • Options Scalping
  • Swing Trading
  • Financial Modelling
  • RSI Indicator
  • Bollinger Bands
  • Pricing of Futures
  • Personal Finance
  • Initial Public Offerings (IPO)
  • Value Investing
  • Technical Indicators
  • Candlesticks
  • Chart Patterns
  • Option Greeks
  • ELSS Funds
  • Banking and Insurance
  • Real Estate
  • Gold
  • Book Summaries:
  • Rich Dad Poor Dad
  • Psychology of Money
  • The Intelligent Investor
  • The Richest Man in Babylon
  • Think and Trade Like a Champion
  • Value Investing and Behavioural Finance
  • Trading in the Zone
  • Learn to Earn
  • Book Summaries:
  • Rich Dad Poor Dad
  • Psychology of Money
  • The Intelligent Investor
  • The Richest Man in Babylon
  • Think and Trade Like a Champion
  • Value Investing and Behavioural Finance
  • Trading in the Zone
  • Learn to Earn
  • Tools:
  • CAGR Calculator
  • SIP Calculator
  • eLearnOptions
  • Future Value Calculator
  • Present Value Calculator
  • Atal Pension Yojana
  • Cost of Delay Calculator
  • Become a Crorepati
  • Tools:
  • CAGR Calculator
  • SIP Calculator
  • eLearnOptions
  • Future Value Calculator
  • Present Value Calculator
  • Atal Pension Yojana
  • Cost of Delay Calculator
  • Become a Crorepati

© 2023 Elearnmarkets. All Rights Reserved

  • Visit Elearnmarkets
  • Courses
  • Webinars
  • Financial Guides
  • Get Free Counselling
  • Visit Elearnmarkets
  • Courses
  • Webinars
  • Financial Guides
  • Get Free Counselling

Get Elearnmarkets App

No Result
View All Result
  • Article Categories
    • Basic Finance
    • Derivatives
    • Financial Planning
    • Fundamental Analysis
    • Technical Analysis
    • Marketshala
    • Miscellaneous
  • Language
    • Hindi
    • Bengali
    • English
  • Courses
  • Webinars
  • Stories

© 2020 Elearnmarkets All Rights Reserved

A Handbook of Technical Analysis
To start your trading journey as a seasoned technical analyst
Download Now
Guidebook On Chart Patterns
Take Your Trading To The Next Level With Strategies Shared In This Ebook
Download Now