Nifty (Close approx. 10081.5)
The Reserve bank of India (RBI) today cut the repo rate by 25 bps to 6%, while the reverse repo rate was cut by 25 bps to 5.75%.
In today’s session, Nifty was down by 33.15 points and the probable resistance as per yesterday’s report was at 10,141. Today the market made an opening high of approx. 10138 and corrected steadily during the day. Moreover, the support as per yesterday’s report was mentioned at 10,058 and market after making a low of 10,054.2, recovered to close at 10081.5.
Hourly Technical:
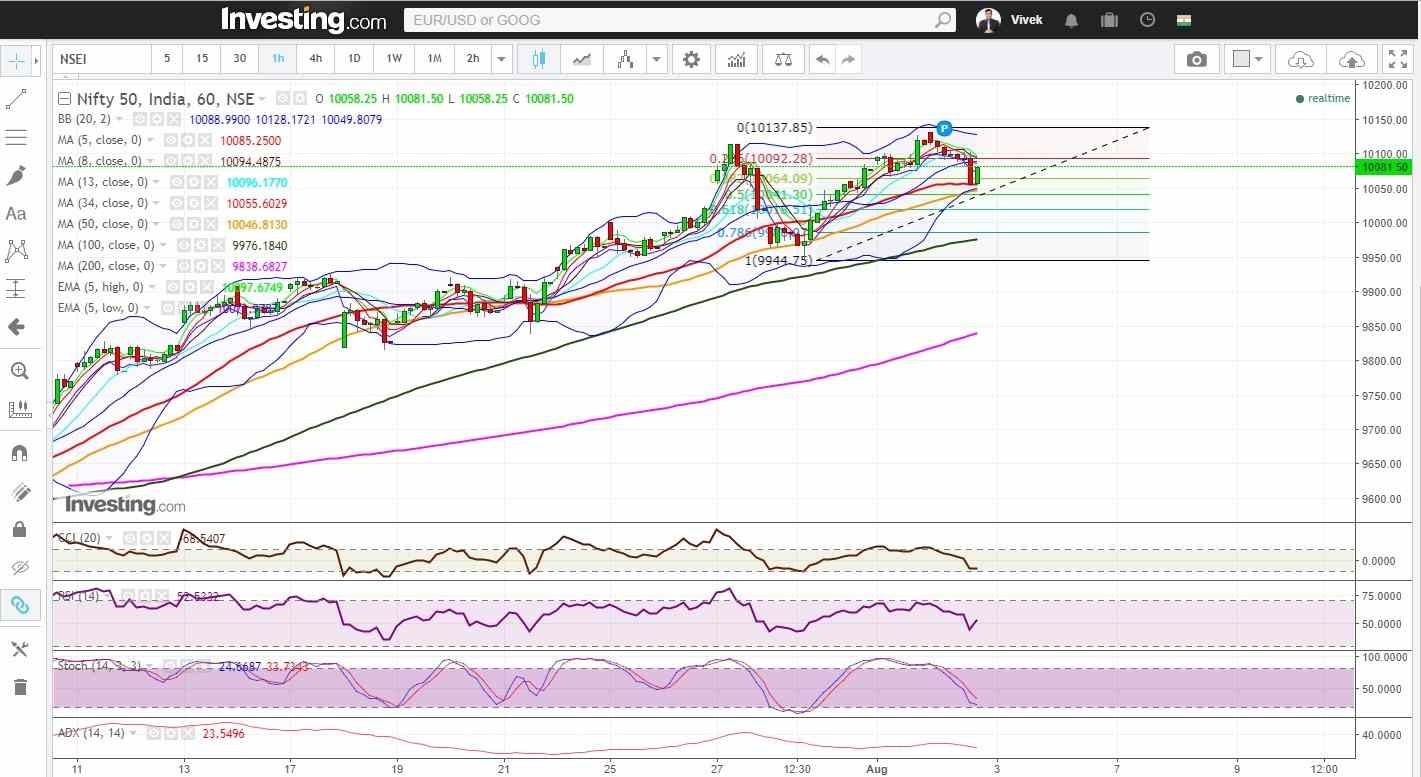
Nifty in the hourly time frame opened at the day’s high (at approx 10137.85) and was down almost most part of the day. The market in the last one hour bounced from the support at 34 DMA (presently at approx 10055.6).
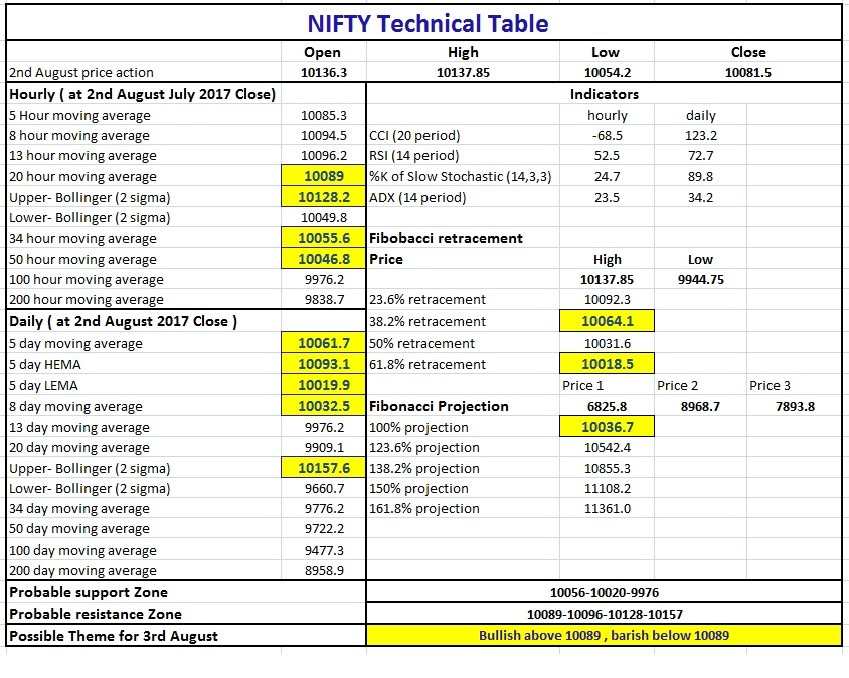
In the near term, Nifty may find support at 34 hourly moving average (presently at approx10055.6) and 50 hourly moving average (presently at approx 10046.8). The probable resistance in the hourly chart could be seen at the mid Bollinger line or 20 hour MA (presently at approx10089),13 hour MA (presently at approx. 10096.2) and upper Bollinger line(presently at approx. 10128.2) .
The expected downward price level based on Fibonacci retracement of the upmove from the previous bottom (approx. 9945 to 10138) comes at 10018.5 (61.8%).
The hourly CCI and Stochastic are present just above their lower reference line while ADX shows little weakness. Overall Nifty looks neutral in the hourly chart.

Figure: Nifty hourly chart
Daily Technical:
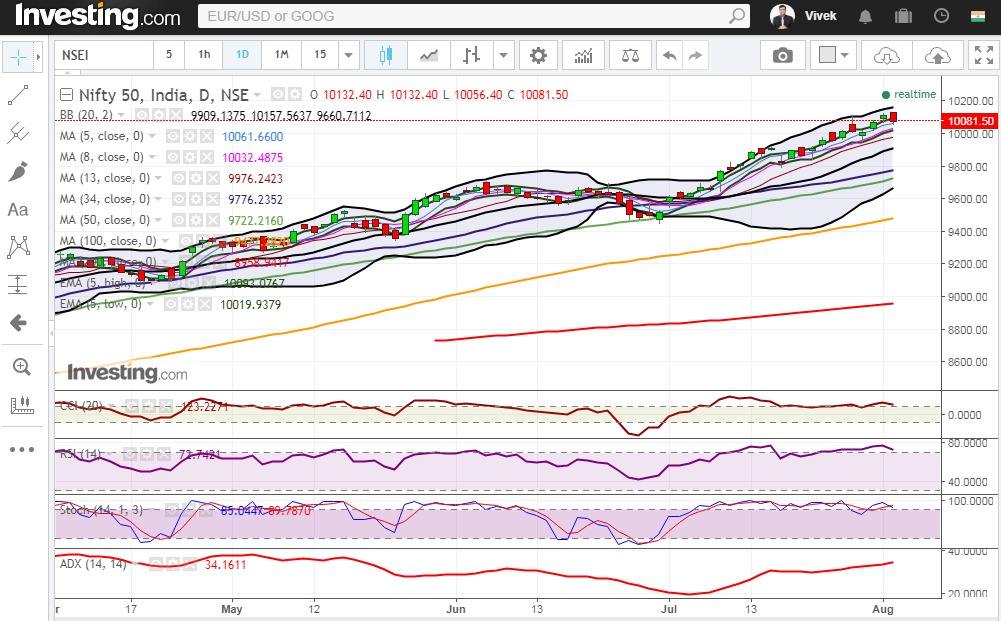
Nifty in the daily time frame remains neutral to bullish. The closing of today’s candle below the 5 High EMA (presently at approx10093.1) is a sign of loss of momentum in immediate future. The probable support in the daily chart remains at 8 DMA (presently at approx 10032.5), 5 Low EMA (presently at approx 10019.9) and 13 DMA (presently at approx9976.2). However, the probable resistance could be seen at upper Bollinger line (presently at approx10157.6).
Daily CCI, RSI and slow stochastic still remains in the overbought zone and the positive setup in the DMI indicate towards continuous bullish momentum in the daily time frame.

Figure: Nifty Daily chart

Figure: Nifty Tech table


