Nifty (Close approx. 10,114.6)
Nifty was in a narrow range in today’s trading session but the bulls took over in last 30 minutes and managed to hit a fresh lifetime high.
The market surged by 37.5 (up by 0.37%) points and the probable resistance as per yesterday’s report was at 10,100 and 10,128. The market faced a strong resistance at 10,100 during the day where it saw little correction. However, the rally in the last one hour could not breach the next resistance point of 10,128 (which was also the life time high) and bounced back from the highs.
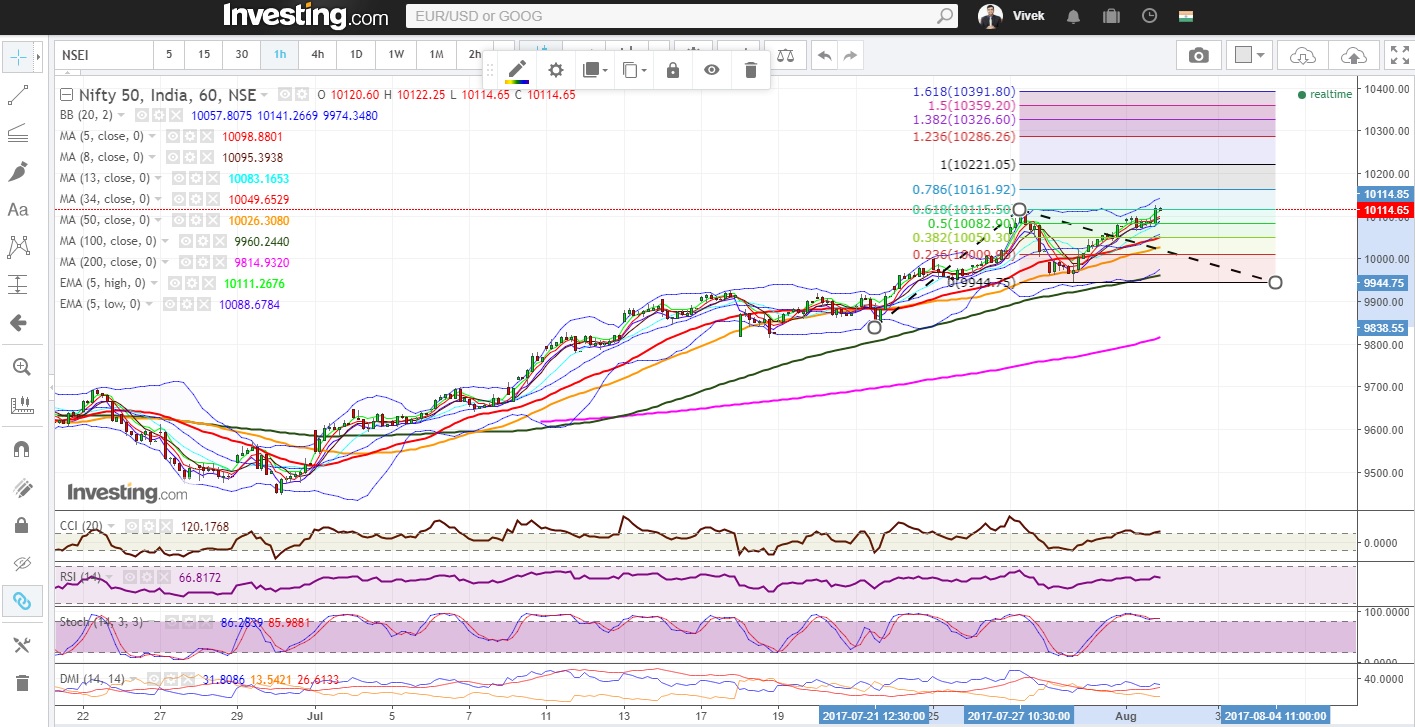
Hourly Technical:
In the hourly chart, Nifty opened above the 5 hourly EMA high and after trading in a tight range during the day, it managed to close above the 5 hourly high EMA which is very positive. In the near term, Nifty may find support at 8 hour moving average (presently at approx. 10095.4) and 20 hour Moving average (presently at approx. 10057.8). The probable resistance in the hourly chart could be seen at upper Bollinger line (presently at approx.10141.3).
The expected upward price levels based on Fibonacci projection from the previous bottom comes at 10,115,5 (61.8%), 10161.9 (78.6%) and 10221 (100%) respectively.
The hourly CCI and stochastic are still in the overbought zone and the setup in hourly DMI suggests strength. Overall Nifty looks bullish in the hourly chart.
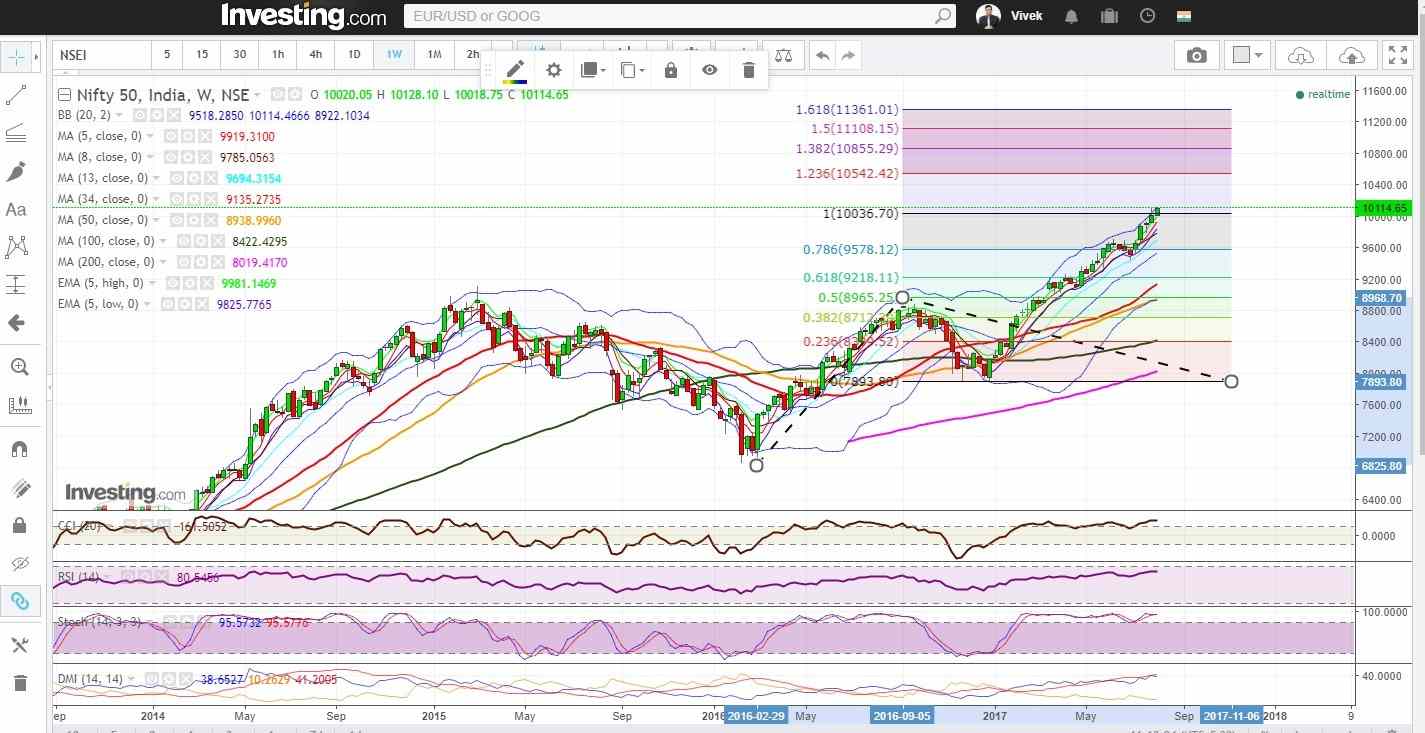
Figure: Hourly Chart
Daily Technical:
Nifty continue to remain bullish in the daily time frame. Today’s candle closed above the 5 day high EMA (presently at approx. 10073.2) suggests that market remains bullish in the daily time frame. The probable support in the daily chart could be seen at 5 day high EMA (presently at approx. 10073.2) while the probable hurdle or the resistance remains at 100% Fibonacci projection (at approx. 10221)
Daily CCI, RSI and slow stochastic remains in the overbought zone and the positive setup in the DMI indicate towards continuous bullish momentum in the daily time frame.
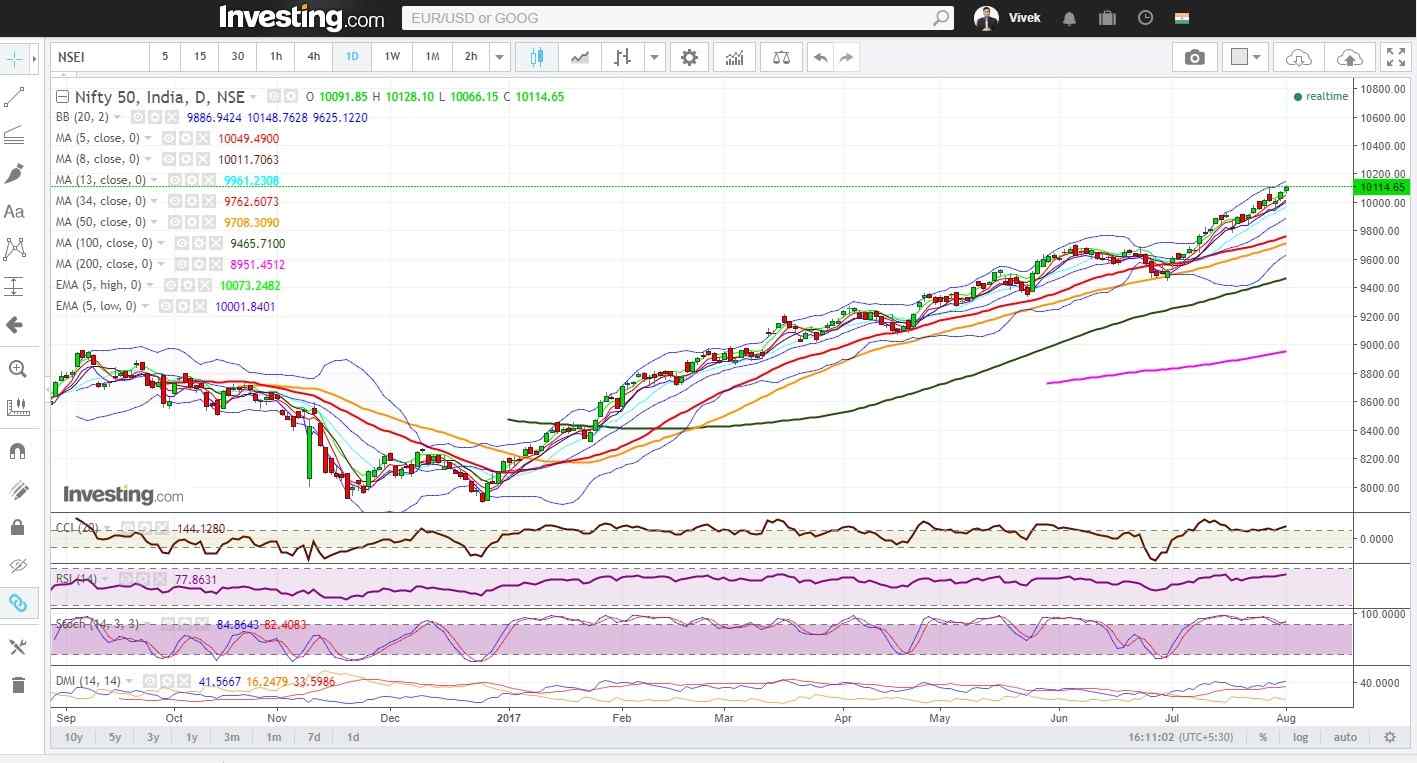
Figure: Daily Chart
Nifty Weekly Technical:
In weekly chart, Nifty remains firmly bullish. Weekly CCI, RSI, slow stochastic, ADX are bullish. As market has started closing above 10036 (approx. 100% projection of the move from approx.6826 to approx. 8969, from Dec 2016 low of approx. 7893) It has opened up Nifty for higher projection targets (10542, 10855, 11108, 11361 etc.) as shown in the following weekly chart.
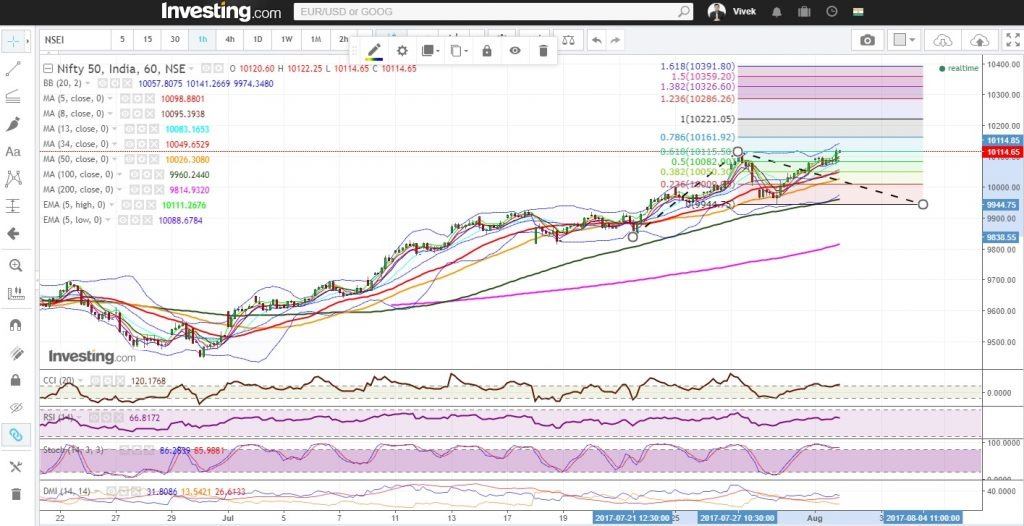
Figure: Weekly Chart
Figure: Technical Chart


