Elearnmarkets - Financial Market Learning
  • Categories
    • Basic Finance
    • Derivatives
    • Financial Planning
    • Fundamental Analysis
    • Technical Analysis
    • Marketshala
    • Miscellaneous
  • Language
    • English
    • Hindi
    • Bengali
No Result
View All Result
  • Courses
  • Webinars
  • Learn On Elearnmarkets
Elearnmarkets - Learn Stock Market, trading, investing for Free
No Result
View All Result
Home Miscellaneous
Nifty Hourly 5th Aug

Weekly Nifty And Bank Nifty Technical Analysis: Nifty & Bank Nifty At Crucial Juncture

Elearnmarkets by Elearnmarkets
November 18, 2020
in Miscellaneous, Market Analysis, Market Wrap
Reading Time: 4 mins read
0
273
VIEWS
Share on FacebookShare on TwitterShare on WhatsApp

Nifty (weekly close approx. 10066.4):

Nifty moved up during first two days of the week and after Wednesday’s RBI policy it started seeing correction due to some profit booking.

On Friday, in the second half, Nifty turned bullish and moved approx. 80 points from the day’s low.

Hourly Technical:

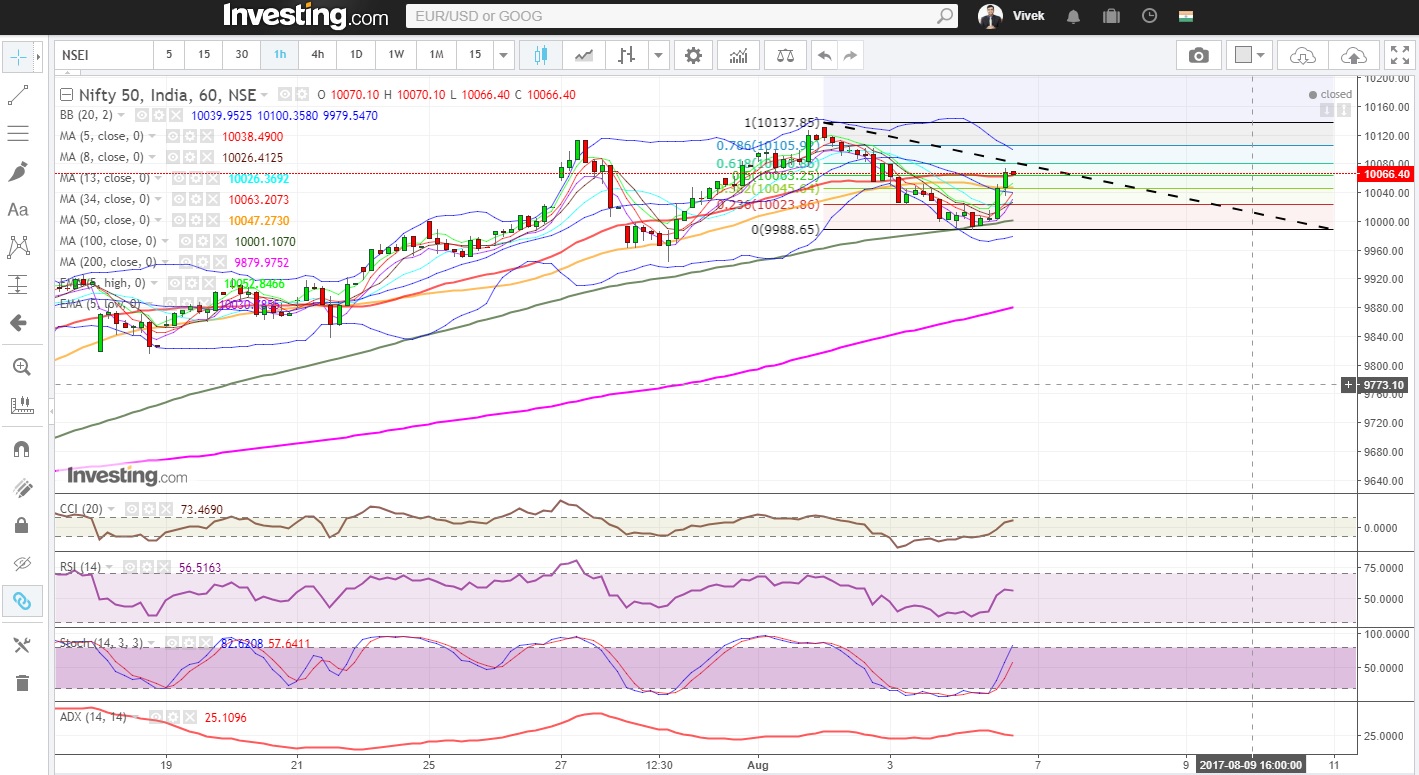
Nifty is at an important juncture in the hourly chart.

If it keeps on staying above 20 hour moving average (presently at approx. 10048) and 34 moving average (presently at approx. 10061.4), it should resume up move.

Join TMP Join TMP Join TMP

Another important level on the upside can be 10081 (61.8% retracement of the last down move, as shown in the hourly chart below).

On the other hand, if Nifty goes below20-hour moving average and 34 hour moving average, it may aim for 100 hour moving average (presently at approx.9984.5) and 200-hour moving average (presently at approx. 9834.3).

The hourly CCI and RSI are in the neutral zone, while hourly slow stochastic is just at the borderline of normal zone, hourly ADX is trending down.

Nifty Hourly Chart

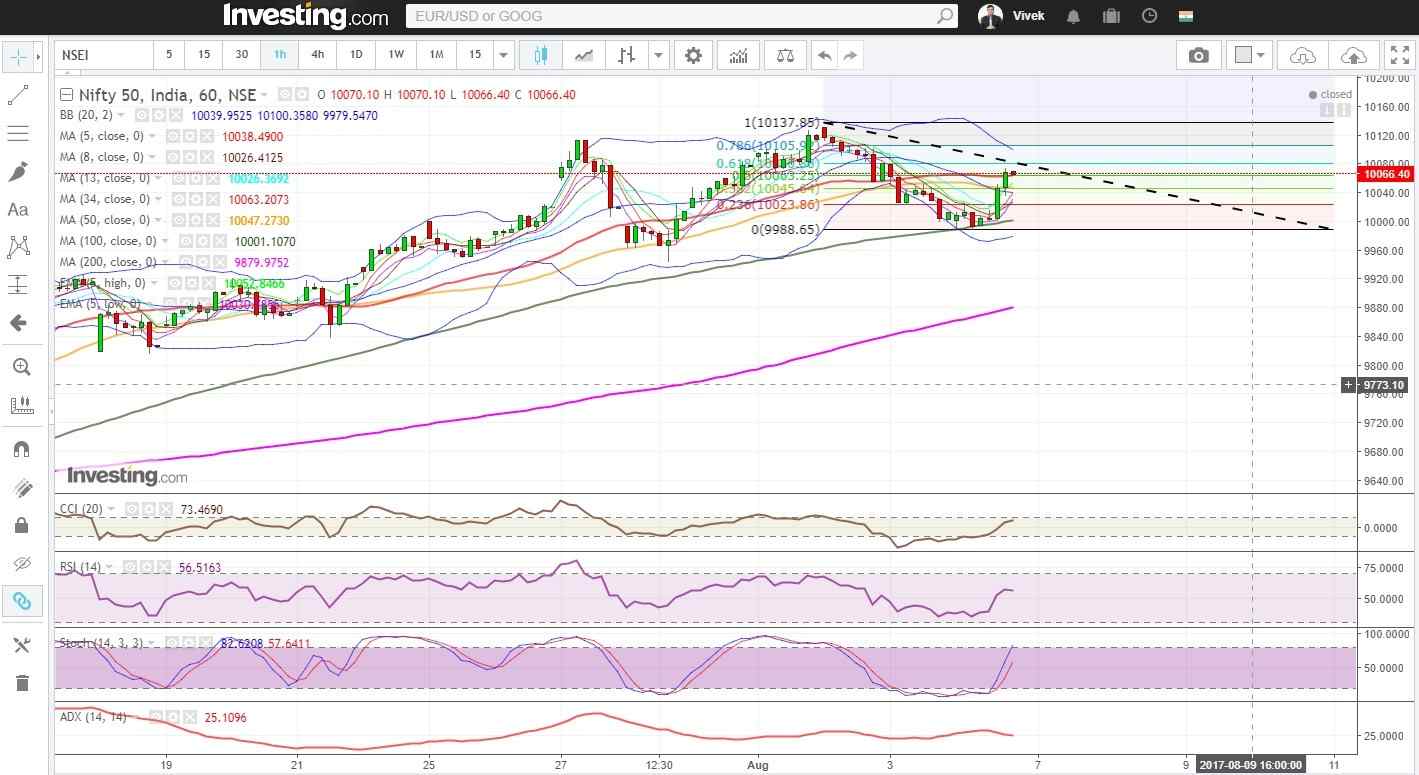
Figure: Nifty Hourly Chart
Daily Technical:

In daily chart, Nifty may find support at 13 DMA (presently at approx. 10002) and 20 DMA (presently at approx. 9946).

On the other hand, if Nifty starts trading above 5 DMA (presently at approx. 10070.7) and 5 day high EMA (presently at approx.10085.3), there is a good chance that Nifty may resume its uptrend.

Daily CCI, RSI and slow stochastic have just entered into the normal zone from the overbought zone and daily ADX is broadly neutral.

Become a Technical Analysis Expert by enrolling in NSE Academy Certified Technical Analysis course on Elearnmarkets.

Nifty Daily Chart

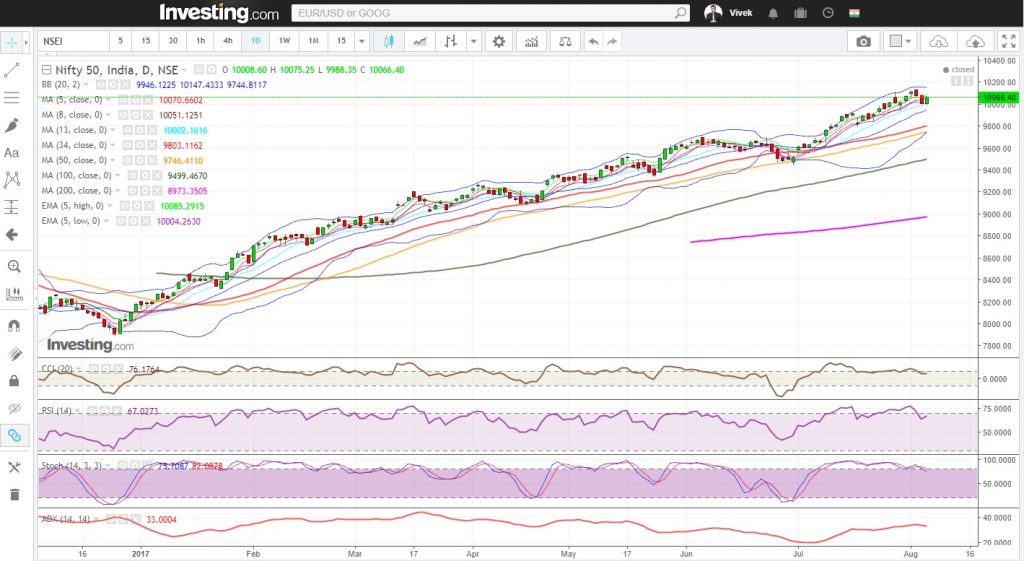
Figure: Nifty Daily Chart
Weekly Technical:

In the weekly chart, Nifty remains firmly bullish. Weekly CCI, RSI, slow stochastic, ADX are bullish. Weekly close above 10036 (100% projection of the move from approx.6826 to approx. 8969, from Dec 2016 low of approx. 7893) has opened up Nifty for higher Fibonacci projection targets (approx. 10542, 10855, 11108, 11361 etc.) as shown in the following weekly chart.

Nifty Weekly Chart

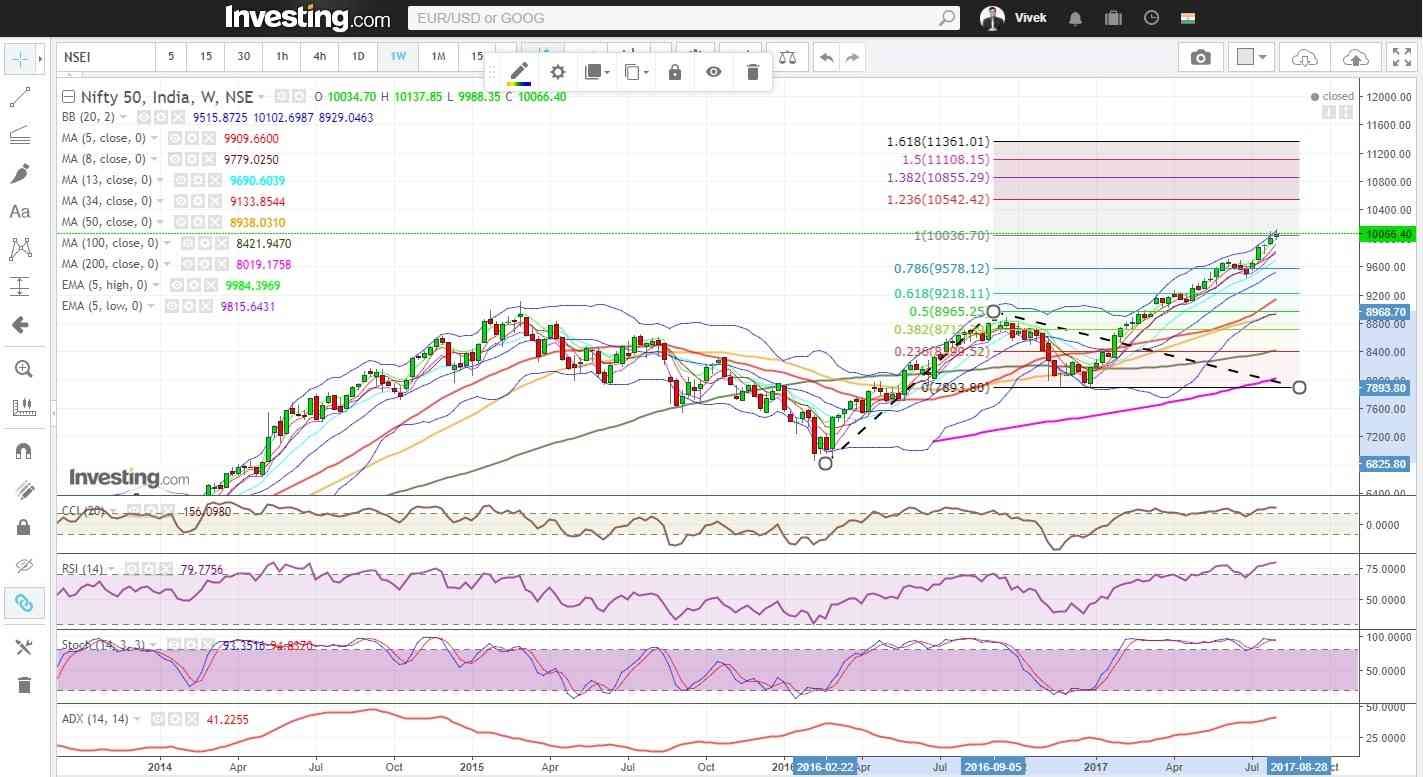
Figure: Nifty Weekly Chart

Nifty Tech Table

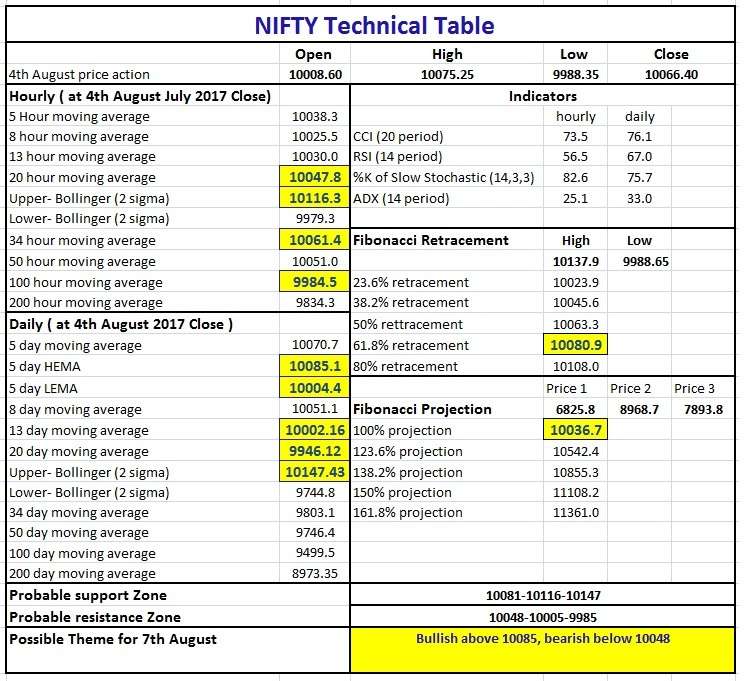
Figure: Nifty Tech Tabl

Bank Nifty (weekly close approx. 24827.45):

Bank Nifty had a good bullish day on Monday. But ,the momentum shifted from the day of RBI policy. Even though there was a rate cut, Bank Nifty saw profit booking and the price broke the upward-sloping supportive trend line, and towards the week’s end closed just at the trend line.

Hourly Technical:

In the hourly chart, the Bank Nifty is just situated at 20 hour moving average.

After the break-down below the trend line, it is vulnerable for more weakness if it stays below the trend line and 20 hour moving average (presently approx 24812).

On the downside, 100 hour moving average (presently at 24676) and 200 hour moving average (presently at approx. 24156) may act as important support.

On the up-side, the Bank Nifty may find resistance at 50 hour moving average (presently at approx. 24911) and 34 hours moving average (presently at approx. 24926) and 24959 (61.8% retracement of the last down move). Above these levels, Bank Nifty is likely to change the bearish tone.

The hourly CCI, RSI and slow stochastic are in the normal zone and the ADX is trending down.

Overall, Bank Nifty remains Neutral to Bearish in the hourly time frame.

Bank Nifty Hourly Chart

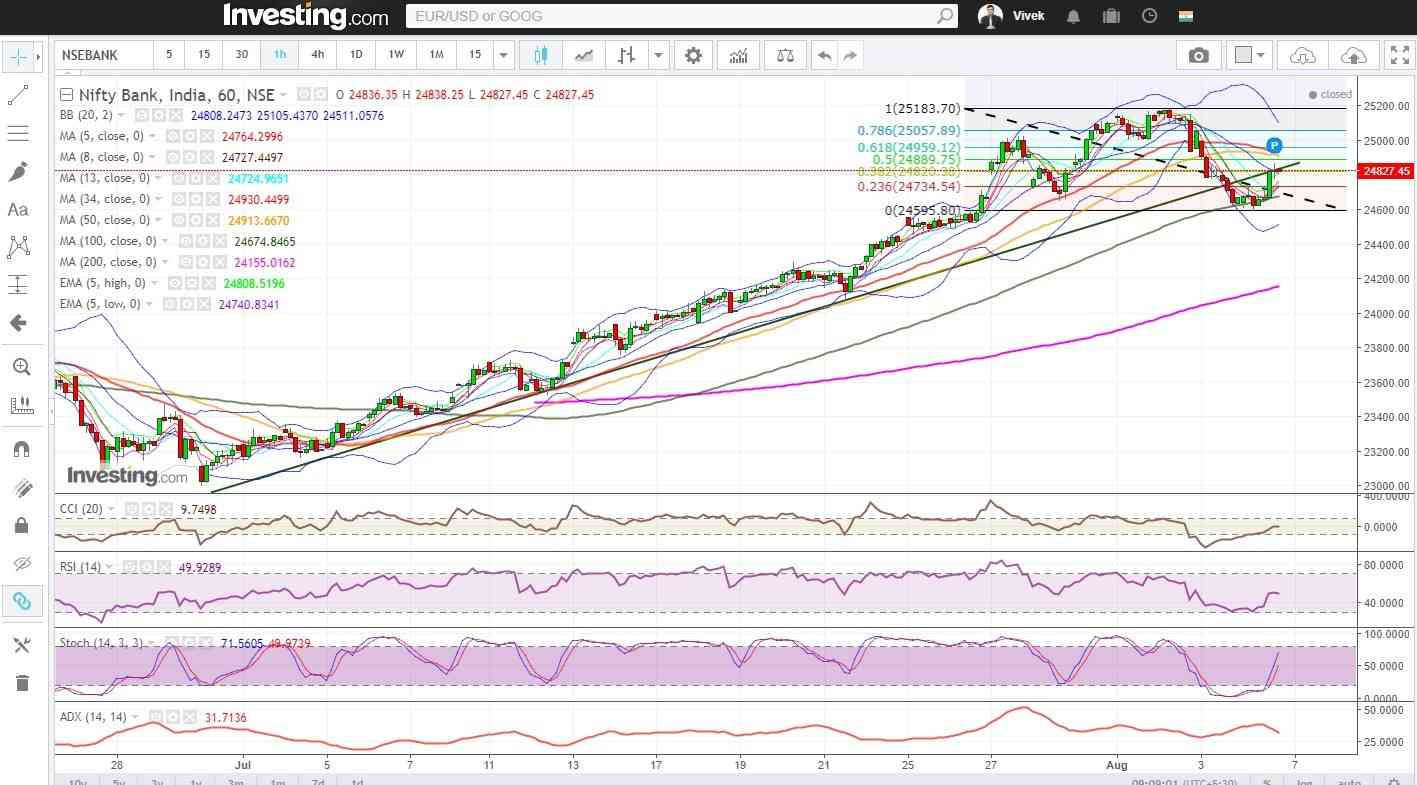
Figure: Bank Nifty Hourly Chart

Daily technical:

Bank Nifty remains bullish to neutral in daily timeframe. It has taken support close to 13 DMA.

On the downside, 13 DMA (presently approx. 24673) and 20 DMA (presently approx. 24378) are immediate probable supports.

On the upside, 5 day high EMA (presently at approx. 24983) may act as an important barrier.

Once Bank Nifty start closing above 5 day high EMA, it may aim for newer highs.

Daily CCI, RSI and slow stochastic have move from overbought zone to normal zone and ADX is just on the verge of turning down. Overall, the scenario is bullish to neutral.

Bank Nifty daily chart

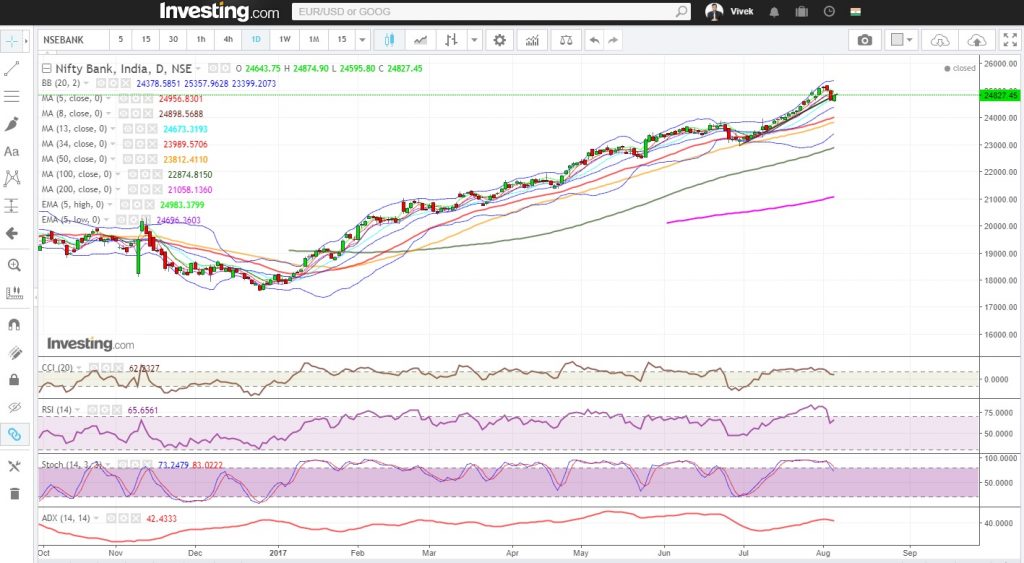
Figure: Bank Nifty daily chart
Weekly Technical:

In weekly chart, Bank Nifty remains broadly bullish. Weekly CCI, RSI, slow stochastic, ADX are bullish. Weekly close above 24776 (approx. 100% projection of the move from approx. 13407 to approx. 20576, from Dec 2016 low of approx. 17607) has opened up Bank Nifty for higher Fibonacci projection targets (approx. 26467, 27513, 28360, 29206 etc.) as shown in the following weekly chart.

However, the last candle can be classified as a Doji, which implies the possibility of a pause or a reversal. Hence we have to look for price action ahead.

Bank Nifty Weekly Chart
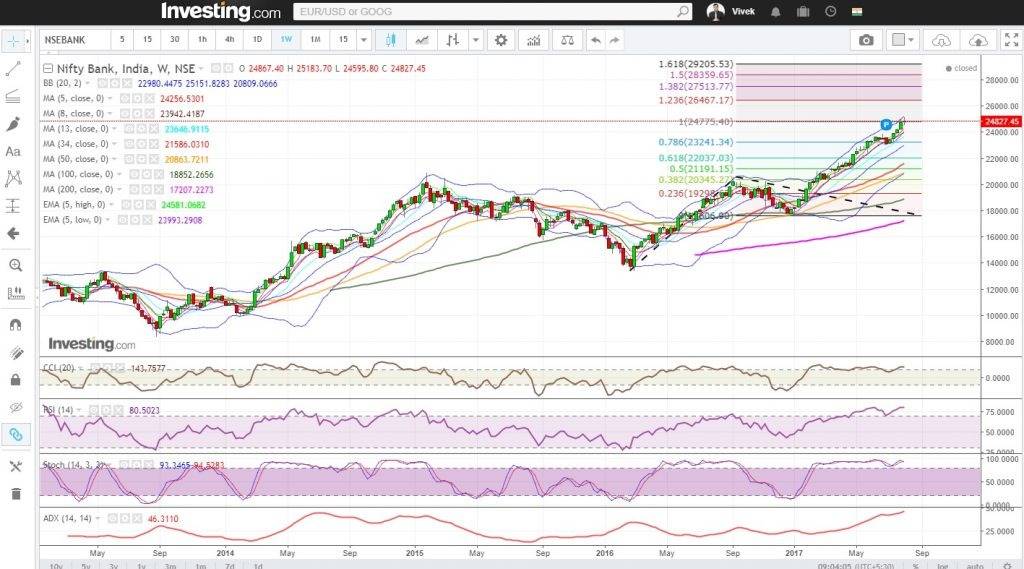
Figure: Bank Nifty Weekly Chart

Bank Nifty Tech Table

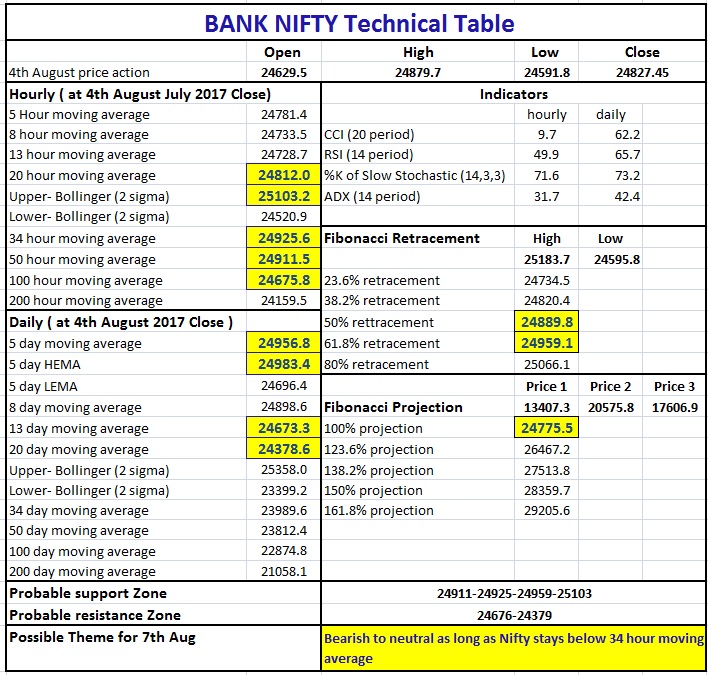
Figure: Bank Nifty Tech Table

Watch the video  below to learn how to interpret the Bank Nifty and Nifty Technical table:

Bottomline:

You can read other Bank  Nifty reports here.

Happy Reading!!

Tags: english
ShareTweetSend
Previous Post

Nifty Witnesses Minor Profit Booking Post RBI Rate Cut

Next Post

How to generate trading signals using Money Flow index and 20 SMA?

Elearnmarkets

Elearnmarkets

Elearnmarkets (ELM) is a complete financial market portal where the market experts have taken the onus to spread financial education. ELM constantly experiments with new education methodologies and technologies to make financial education effective, affordable and accessible to all. You can connect with us on Twitter @elearnmarkets.

Related Posts

Binary Options Trading
Miscellaneous

Tips for Successful Binary Options Trading

September 29, 2022
3.1k
5 Simple Ways to Get Into Forex Trading for Beginners 1
Miscellaneous

5 Simple Ways to Get Into Forex Trading for Beginners

September 21, 2022
11.3k
Top 11 Factors to consider for taking a Personal Loan 2
Miscellaneous

Top 11 Factors to consider for taking a Personal Loan

August 29, 2022
1.4k
Term Plan with or Without Maturity Benefits - What's the Difference? 3
Miscellaneous

Term Plan with or Without Maturity Benefits – What’s the Difference?

September 12, 2022
314

Leave a Reply Cancel reply

Your email address will not be published. Required fields are marked *

Follow Us

Facebook-f Twitter Instagram Linkedin-in Youtube Telegram

Register on Elearnmarkets

Continue your financial learning by creating your own account on Elearnmarkets.com

Register Free Account

Download App

Categories

  • Basic Finance
  • Derivatives
  • Financial Planning
  • Fundamental Analysis
  • Technical Analysis
  • Marketshala
  • Miscellaneous

Popular On Elearnmarkets

  • Market Superheroes:
  • Vivek Bajaj
  • Chetan Panchamia
  • Ashish Kyal
  • Premal Parekh
  • Abhijit Paul
  • Jegan
  • Sivakumar Jayachadran
  • Vishal Malkan
  • Jyoti Budhia
  • Vivek Gadodia
  • Vishal Mehta
  • Piyush Chaudhry
  • Santosh Pasi
  • Gomathi Shankar
  • Market Superheroes:
  • Vivek Bajaj
  • Chetan Panchamia
  • Ashish Kyal
  • Premal Parekh
  • Abhijit Paul
  • Jegan
  • Sivakumar Jayachadran
  • Vishal Malkan
  • Jyoti Budhia
  • Vivek Gadodia
  • Vishal Mehta
  • Piyush Chaudhry
  • Santosh Pasi
  • Gomathi Shankar
  • Courses:​
  • Options Trading
  • Dow Theory
  • Momentum Trading
  • Stock Investing
  • Stock Market for Beginners
  • Harmonic Chart Patterns
  • Algo Trading
  • Elliot Wave Theory
  • Advanced Excel
  • Cryptocurrency
  • NSE Certification Course
  • Courses:​
  • Options Trading
  • Dow Theory
  • Momentum Trading
  • Stock Investing
  • Stock Market for Beginners
  • Harmonic Chart Patterns
  • Algo Trading
  • Elliot Wave Theory
  • Advanced Excel
  • Cryptocurrency
  • NSE Certification Course
  • Webinars:
  • Bank Nifty Scalping
  • Intraday Trading Strategies
  • Options Trading Strategies
  • Options selling
  • Price Action
  • Relative Strength
  • Tax Planning
  • Options Buying
  • Growth Stocks
  • Portfolio Management
  • Relative Strength Index
  • Risk Management
  • Renko Charts
  • Crude Oil
  • Traders Psychology
  • Moving Average
  • Multibagger Stocks
  • Free Learning Modules:
  • Intraday Trading
  • Options Scalping
  • Swing Trading
  • Financial Modelling
  • RSI Indicator
  • Bollinger Bands
  • Pricing of Futures
  • Personal Finance
  • Initial Public Offerings (IPO)
  • Value Investing
  • Technical Indicators
  • Candlesticks
  • Chart Patterns
  • Option Greeks
  • ELSS Funds
  • Banking and Insurance
  • Real Estate
  • Gold
  • Book Summaries:
  • Rich Dad Poor Dad
  • Psychology of Money
  • The Intelligent Investor
  • The Richest Man in Babylon
  • Think and Trade Like a Champion
  • Value Investing and Behavioural Finance
  • Trading in the Zone
  • Learn to Earn
  • Book Summaries:
  • Rich Dad Poor Dad
  • Psychology of Money
  • The Intelligent Investor
  • The Richest Man in Babylon
  • Think and Trade Like a Champion
  • Value Investing and Behavioural Finance
  • Trading in the Zone
  • Learn to Earn
  • Tools:
  • CAGR Calculator
  • SIP Calculator
  • eLearnOptions
  • Future Value Calculator
  • Present Value Calculator
  • Atal Pension Yojana
  • Cost of Delay Calculator
  • Become a Crorepati
  • Tools:
  • CAGR Calculator
  • SIP Calculator
  • eLearnOptions
  • Future Value Calculator
  • Present Value Calculator
  • Atal Pension Yojana
  • Cost of Delay Calculator
  • Become a Crorepati

© 2023 Elearnmarkets. All Rights Reserved

  • Visit Elearnmarkets
  • Courses
  • Webinars
  • Financial Guides
  • Get Free Counselling
  • Visit Elearnmarkets
  • Courses
  • Webinars
  • Financial Guides
  • Get Free Counselling

Get Elearnmarkets App

No Result
View All Result
  • Article Categories
    • Basic Finance
    • Derivatives
    • Financial Planning
    • Fundamental Analysis
    • Technical Analysis
    • Marketshala
    • Miscellaneous
  • Language
    • Hindi
    • Bengali
    • English
  • Courses
  • Webinars

© 2020 Elearnmarkets All Rights Reserved

Suggested Learning

Technical Analysis Made Easy

Certification in Online Technical Analysis

Online NSE Academy Certified Capital Market Professional (E-NCCMP)