Elearnmarkets - Financial Market Learning
  • Categories
    • Basic Finance
    • Derivatives
      • Futures
      • Options
    • Financial Planning
    • Fundamental Analysis
    • Technical Analysis
    • Marketshala
    • Miscellaneous
  • Language
    • English
    • Hindi
    • Bengali
No Result
View All Result
  • Courses
  • Webinars
  • Stories
Elearnmarkets - Learn Stock Market, trading, investing for Free
No Result
View All Result
Home Technical Analysis Market Analysis Charts
BANK OF BARODA

BANK OF BARODA

Bank of Baroda: Worst result in bank sector, stock up 19%

Elearnmarkets by Elearnmarkets
July 22, 2023
in Charts, Market Analysis
Reading Time: 3 mins read
0
465
VIEWS
Share on FacebookShare on XShare on WhatsApp

Bank of Baroda announced its 3rd quarter results on the 13th of Feb, for FY 15-16. The results were the worst one posted by any bank so far. However, when the trades opened today, Bank of Baroda was seen trading 19% higher from the previous close!

This reaction was the result of the Bank of Baroda’s Management’s comments on the quarterly result in which they stated that (link) :

  • The worst was behind, the bad loans have been recognized
  • There will not be any dilution of interest in the company by way of capital infusion from the government
  • Customer mapping to increase business and reduce capital inclusion
  • Non –monetised assets – means there are assets with the bank which have not been included in the balance sheet, which provide the bank’s business with benefits, which will be monetized in the future and help improve the bank’s books.
  • Foreign currency gains which are expected to flow in any time soon.
  • There are thus, potential mark to market gains which the bank can take in which will act as an accretion to capital.
  • Expecting a 20% growth in the capital next year as the bank is committed to improving in its inefficiencies.
  • The bank hopes to release 50 bps of capital following the clean up of its balance sheet and unnecessary lines of credit given to customers who won’t be needing it.
  • BoB has other banks outside India, and on capital adequacy ratio they expect to pick up another 50bps of capital on a consolidated basis.

The board’s comments came resounding around just one thing: EFFICIENCY.

However, let’s take a thought on this.

What the management has spelled does sound like a new beginning for the bank, however, to build a new something which is already standing, it takes the process of creative destruction.

And destruction as well know, is painful.

So the reaction to the board’s comments is phenomenal, but what next?

Will the traders who have jumped in on the sound of music standby when the board drops the beat?

RelatedPosts

Weekly Chart

Huge Sell-Off Makes the Market Close in a Negative Note on the Expiry Week

August 22, 2023
191
Hourly Chart

Nifty Ends in Green. Rupee Appreciates and Falling Crude Price Helped the Market to Recover Approx. 140 Point

August 31, 2023
133
Hourly Chart

Sell Off Continues. Nifty Ends The Week With Three Consecutive Red Candles

September 4, 2023
147

If you are a market participant and facing difficulty with charts and patterns, you can check for NSE Academy Certified Technical Analysis course on Elearnmarkets.

Now, if we look at the Technical perspective, and analyze the chart, we can find evidence that the reaction is technically justified.

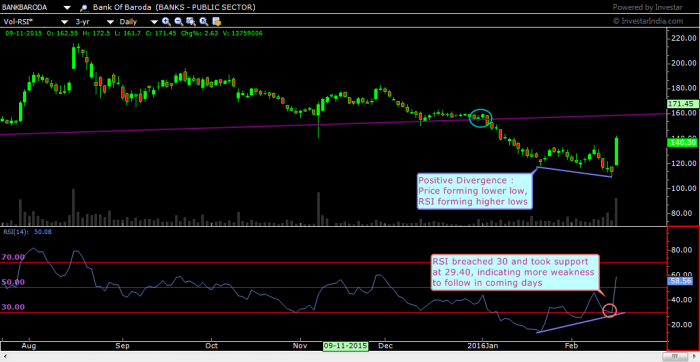
On the daily chart of Bank of Baroda, there was an evident Positive divergence between price and the momentum indicator RSI which suggested that though the price was trending lower, the momentum in the stock was catching up.

This lead to the price to shoot up today when the word of the board came in with a positive note.

However, the concern comes from the fact that the last day the RSI had breached the level of 30, had this reversal come from a level of say 31-35, more credibility would have been awarded to today’s move.

BANK OF BARODA : POSITIVE DIVERGENCE
CHART #1: BANK OF BARODA – POSITIVE DIVERGENCE

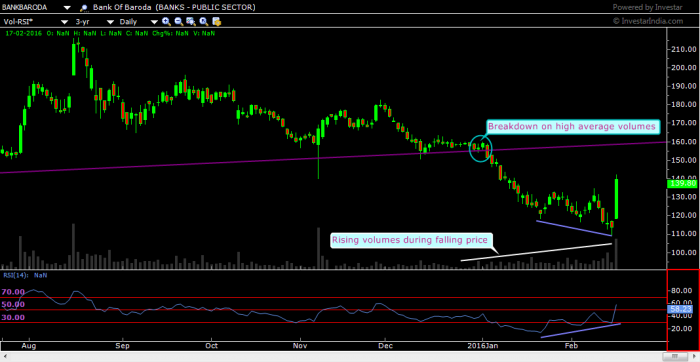
Another concern here is the volume which has been consistently high during the falling witnessed in price.

As we know, high volume during a trend adds to its weightage and importance.

CHART #2: BANK OF BARODA- Rising Volumes on falling prices indicate downtrend is strong

Lastly, let’s take a look at the weekly charts.

There are two levels defined on the chart, one is the resistance for the current up-move at 137 (for reasons marked 1,2,3) and the other is the support in the zone of 85-100 (for reasons marked A, B,C).

CHART #3: BANK OF BARODA (weekly line chart) showing resistance and support zones

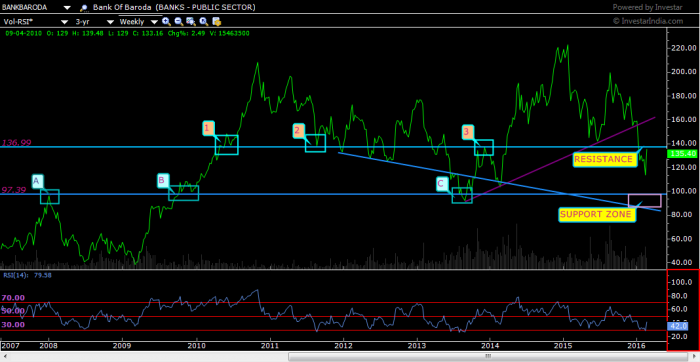
The stock is very close to the August 2013 lows of 85-86.

The technical support combined with flushing of the balance sheet makes Bank of Baroda an important stock in the banking sector and among the Nifty 50s.


Tags: englishresistancestock marketsupporttechnical analysis
ShareTweetSend
Get Kotak Offer Get Kotak Offer Get Kotak Offer
Previous Post

WEEKLY MARKET WRAP 12TH FEB. ’16: Markets rebound following sell-off.

Next Post

KYC – Know more about your client

Elearnmarkets

Elearnmarkets

Elearnmarkets (ELM) is a complete financial market portal where the market experts have taken the onus to spread financial education. ELM constantly experiments with new education methodologies and technologies to make financial education effective, affordable and accessible to all. You can connect with us on Twitter @elearnmarkets.

Related Posts

Weekly Chart
Market Analysis

Huge Sell-Off Makes the Market Close in a Negative Note on the Expiry Week

August 22, 2023
191
Hourly Chart
Market Analysis

Nifty Ends in Green. Rupee Appreciates and Falling Crude Price Helped the Market to Recover Approx. 140 Point

August 31, 2023
133
Hourly Chart
Market Analysis

Sell Off Continues. Nifty Ends The Week With Three Consecutive Red Candles

September 4, 2023
147
Nifty Hourly Chart
Market Analysis

Nifty Witnessed A Flash Crash But Managed To Close Above 11100 Level

August 17, 2023
349

Leave a Reply Cancel reply

Your email address will not be published. Required fields are marked *

Elearnmarkets Logo

Follow Us

Facebook-f Twitter Instagram Linkedin-in Youtube Telegram

Register on Elearnmarkets

Continue your financial learning by creating your own account on Elearnmarkets.com

Register Free Account

Download App

Playstore logo
Download on app store

Categories

  • Basic Finance
  • Derivatives
  • Financial Planning
  • Fundamental Analysis
  • Technical Analysis
  • Marketshala
  • Miscellaneous

Popular On Elearnmarkets

  • Market Superheroes:
  • Vivek Bajaj
  • Chetan Panchamia
  • Ashish Kyal
  • Premal Parekh
  • Abhijit Paul
  • Jegan
  • Sivakumar Jayachadran
  • Vishal Malkan
  • Jyoti Budhia
  • Vivek Gadodia
  • Vishal Mehta
  • Piyush Chaudhry
  • Santosh Pasi
  • Gomathi Shankar
  • Market Superheroes:
  • Vivek Bajaj
  • Chetan Panchamia
  • Ashish Kyal
  • Premal Parekh
  • Abhijit Paul
  • Jegan
  • Sivakumar Jayachadran
  • Vishal Malkan
  • Jyoti Budhia
  • Vivek Gadodia
  • Vishal Mehta
  • Piyush Chaudhry
  • Santosh Pasi
  • Gomathi Shankar
  • Courses:​
  • Options Trading
  • Dow Theory
  • Momentum Trading
  • Stock Investing
  • Stock Market for Beginners
  • Harmonic Chart Patterns
  • Algo Trading
  • Elliot Wave Theory
  • Advanced Excel
  • Cryptocurrency
  • NSE Certification Course
  • Courses:​
  • Options Trading
  • Dow Theory
  • Momentum Trading
  • Stock Investing
  • Stock Market for Beginners
  • Harmonic Chart Patterns
  • Algo Trading
  • Elliot Wave Theory
  • Advanced Excel
  • Cryptocurrency
  • NSE Certification Course
  • Webinars:
  • Bank Nifty Scalping
  • Intraday Trading Strategies
  • Options Trading Strategies
  • Options selling
  • Price Action
  • Relative Strength
  • Tax Planning
  • Options Buying
  • Growth Stocks
  • Portfolio Management
  • Relative Strength Index
  • Risk Management
  • Renko Charts
  • Crude Oil
  • Traders Psychology
  • Moving Average
  • Multibagger Stocks
  • Free Learning Modules:
  • Intraday Trading
  • Options Scalping
  • Swing Trading
  • Financial Modelling
  • RSI Indicator
  • Bollinger Bands
  • Pricing of Futures
  • Personal Finance
  • Initial Public Offerings (IPO)
  • Value Investing
  • Technical Indicators
  • Candlesticks
  • Chart Patterns
  • Option Greeks
  • ELSS Funds
  • Banking and Insurance
  • Real Estate
  • Gold
  • Book Summaries:
  • Rich Dad Poor Dad
  • Psychology of Money
  • The Intelligent Investor
  • The Richest Man in Babylon
  • Think and Trade Like a Champion
  • Value Investing and Behavioural Finance
  • Trading in the Zone
  • Learn to Earn
  • Book Summaries:
  • Rich Dad Poor Dad
  • Psychology of Money
  • The Intelligent Investor
  • The Richest Man in Babylon
  • Think and Trade Like a Champion
  • Value Investing and Behavioural Finance
  • Trading in the Zone
  • Learn to Earn
  • Tools:
  • CAGR Calculator
  • SIP Calculator
  • eLearnOptions
  • Future Value Calculator
  • Present Value Calculator
  • Atal Pension Yojana
  • Cost of Delay Calculator
  • Become a Crorepati
  • Tools:
  • CAGR Calculator
  • SIP Calculator
  • eLearnOptions
  • Future Value Calculator
  • Present Value Calculator
  • Atal Pension Yojana
  • Cost of Delay Calculator
  • Become a Crorepati

© 2023 Elearnmarkets. All Rights Reserved

  • Visit Elearnmarkets
  • Courses
  • Webinars
  • Financial Guides
  • Get Free Counselling
  • Visit Elearnmarkets
  • Courses
  • Webinars
  • Financial Guides
  • Get Free Counselling

Get Elearnmarkets App

No Result
View All Result
  • Article Categories
    • Basic Finance
    • Derivatives
    • Financial Planning
    • Fundamental Analysis
    • Technical Analysis
    • Marketshala
    • Miscellaneous
  • Language
    • Hindi
    • Bengali
    • English
  • Courses
  • Webinars
  • Stories

© 2020 Elearnmarkets All Rights Reserved

Guidebook On Chart Patterns
Take Your Trading To The Next Level With Strategies Shared In This Ebook
Download Now