The direction of the price movement at the given point of time is called a trend. At any given point of time, a price either has to rise or fall or remains standstill. Read this blog to get a complete overview on trend and theory of retracement
| Table of Contents |
|---|
| What is Uptrend? |
| What is Downtrend? |
| What is Choppy trend? |
| What is Reversal signal |
| Countertrend or correction |
| Theory of retracement |
| Bottomline |
Hence trends are of three types-
1. Uptrend
2. Downtrend
3. Flat trend or choppy trend
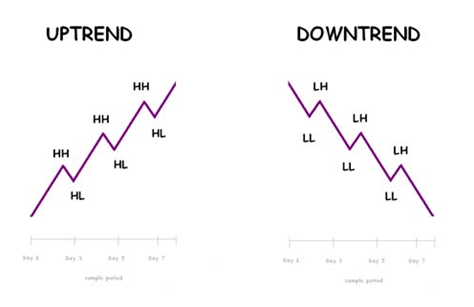
What is Uptrend?
During an uptrend, price line makes a constant formation of higher tops and bottom. As long as this higher tops and bottom can be identified in the chart, we are bound to say that the trend is up.
During this uptrend, demand is much greater than the supply. All the bottoms are higher which signifies that there is a constant demand in the market which is eventually coming at a higher price.
In a single word, there is a constant buyer at a comparatively higher rate and demand is thereby so strong that it pushes the price upward to a new horizon.
What is Downtrend?
During a downtrend, price creates lower tops and lower bottoms.
All the subsequent tops would be lower than the previous one and as well as the bottom too.
In a downtrend, supply is much more than demand.
A lower top indicates that the sellers are interested to sell constantly at a lower price.
Hence, supply is so strong that it pushes the price to a new lower dimension.
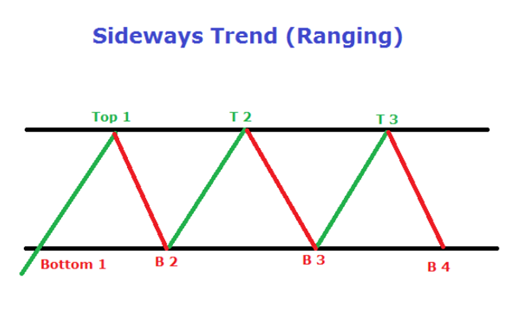
What is Choppy trend?
A choppy trend or a flat trend is also popularly known as a sideways movement.
During this choppy trend, price does not make any clear-cut top or bottom, rather it moves in a horizontal fashion.
Learn basics of technical analysis with Technical Trading Made Easy Course by Market Experts
During this phase demand and supply both are equal and price keeps on moving within a range bound zone.
Does Technical Analysis fascinate you?
Then enroll in NSE Academy Certified Technical Analysis course on Elearnmarkets to become an expert in Technical Analysis.
What is Reversal signal
During an uptrend as per the definition, the price is expected to maintain a higher bottom.
But for any reason whatsoever might be in nature, if price violates the last higher bottom which it is not supposed to, then it shows that the uptrend has started getting into trouble.
Violation of the last higher bottom means that the buyers are not available anymore at higher rates.
After that, once price starts forming lower tops and bottoms, it confirms that uptrend has fully converted to downtrend.
In a downtrend, price continuously makes a lower bottom and lower tops.
After a series of lower tops and bottoms, when we find that price is refusing to make further lower bottoms rather it is making higher bottoms, it shows that demand once again started coming at a comparatively higher price and this is the first signal of a downtrend to an uptrend.
During an uptrend, all the fall in the price is an opportunity to buy at a comparatively lower price.
During a downtrend, the entire rise in the price is an opportunity to sell at a comparatively higher rate.
But during a choppy trend, we should not take any decision rather we should wait for a trend to emerge.
We must have noticed that during an uptrend price in between comes down or falls to rise again further. In a downtrend, price rise in between to fall again further.
So when a trend is choppy we are not supposed to do anything rather wait for a directional breakout either side.
It has been noticed that prices do not rise or fall in a straight line fashion.
During an uptrend, price falls and thereby gathers more energy again to rise further.
During a downtrend, price does not fall in a straight line fashion rather it goes up in between to fall again further. So there is always an opposite movement in a trend.
Countertrend or correction
During an uptrend, price periodically falls and during a downtrend price periodically rises.
This opposite movement is called counter-trend.
So we can say that it is the trend and the counter-trend which together makes a complete trend.

Had there been no counter-trend, the market would not have existed at all because the linear movement is not possible in price.
The other name which is popularly known as for counter-trend is correction.
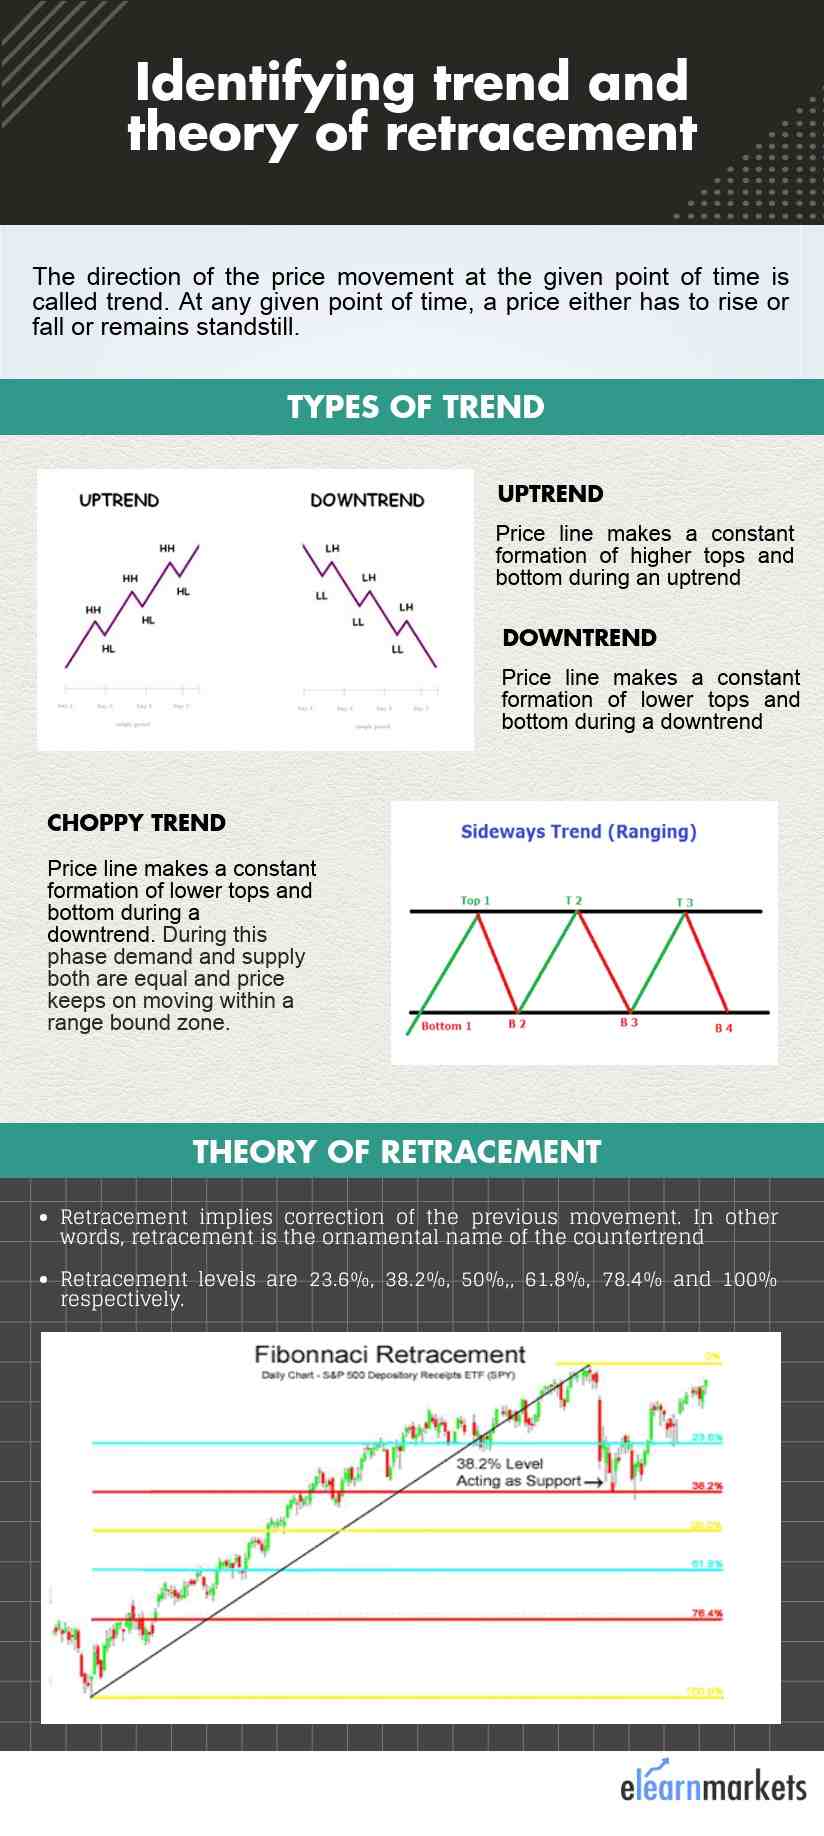
Theory of retracement
Theory of retracement implies correction of the previous movement. In other words, theory of retracement is the ornamental name of the countertrend. According to the theory, 33% or the 1/3rd happens to be a strong support and a strong resistance level in a downtrend.
Normally this 33% is very difficult to break through. But for any reason, if ever this 33% is broken, the price will get back to 50% retracement level. This is popularly known as halfway retracement levels.
This 50% retracement level is very strong and it is not that easy for the price to break this level. It has been said that if the existing trend is seriously up or down, no theory of retracement will extend beyond 50%.
If we find that price could not honor this 50% retracement level, then the existing trend becomes questionable.
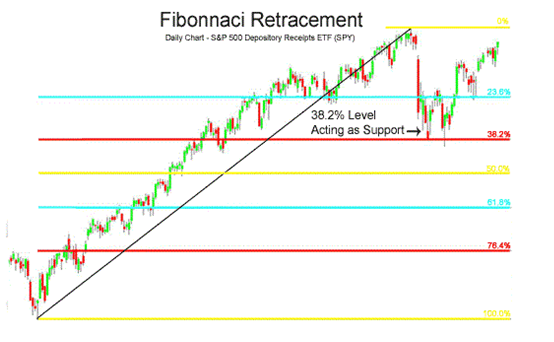
Although it has been suggested by the textbook that below 50%; 66% might provide support but practical observation has taught us that if 50% is broken, price does not honor any other level in the true sense, rather it comes down to the point or bottom from where it started rising which is 100% retracement.
Technically this is known as a double bottom.
Bottomline
Trend plays a key role in the stock market and a wise trader respects trend.
Though it may appear extremely simple it works wonderfully in stock market.
Someone has rightly said that trend is your friend.
Keep learning!!


Hello. excellent job. I did not anticipate this. This is a remarkable story. Thanks!