Scalping is a short-term trading technique that aims to profit from minute changes in stock prices during the day. We use scalping trading indicators to identify the entry and exit levels for scalping trading.
High-frequency traders, or scalpers, are those who make many transactions in a matter of minutes or even seconds.
Their goal is to profit from volatility, liquidity imbalances, and transient market inefficiencies. Scalping aims to build up a string of minor victories that can eventually result in a substantial profit with the help of the best indicator for scalping.
Top 5 Scalping Trading Indicators
1. Central Pivot Range (CPR)
The Central Pivot Range (CPR) is one of the important scalping trading indicators as it helps in identifying key intraday support and resistance levels for the day.
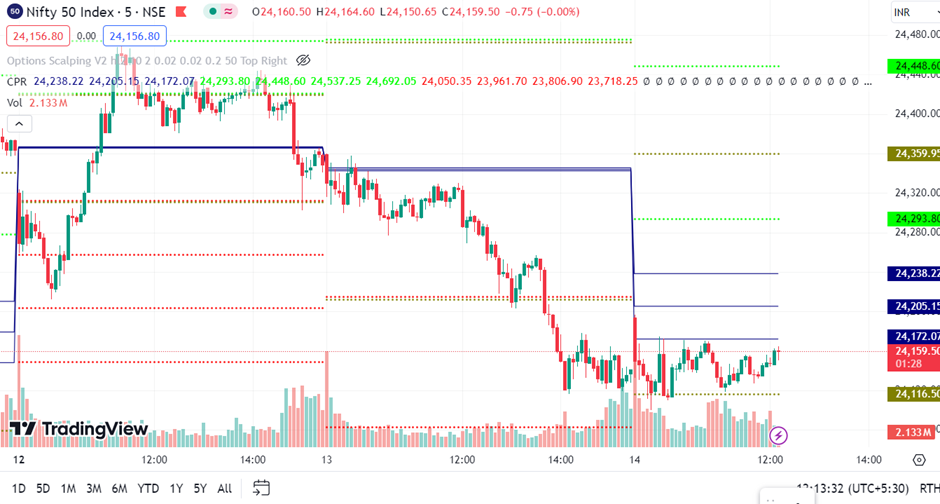
- Strategy: The market is probably going to be range-bound if the price opens within the CPR.
- Options Scalpers: As the price moves between the TC and BC, they can search for rapid transactions.
- Entry Point: Buy when the price breaks out of the BC and sell when it moves back toward the TC.
- Exit Point: Aim for modest gains and pull out of the market before the price reaches the other side of the CPR.
2. VWAP (Volume-Weighted Average Price)
One of the best indicators for scalping is VWAP that helps the scalper give a balanced view of price action. It combines the price data with the volume data.
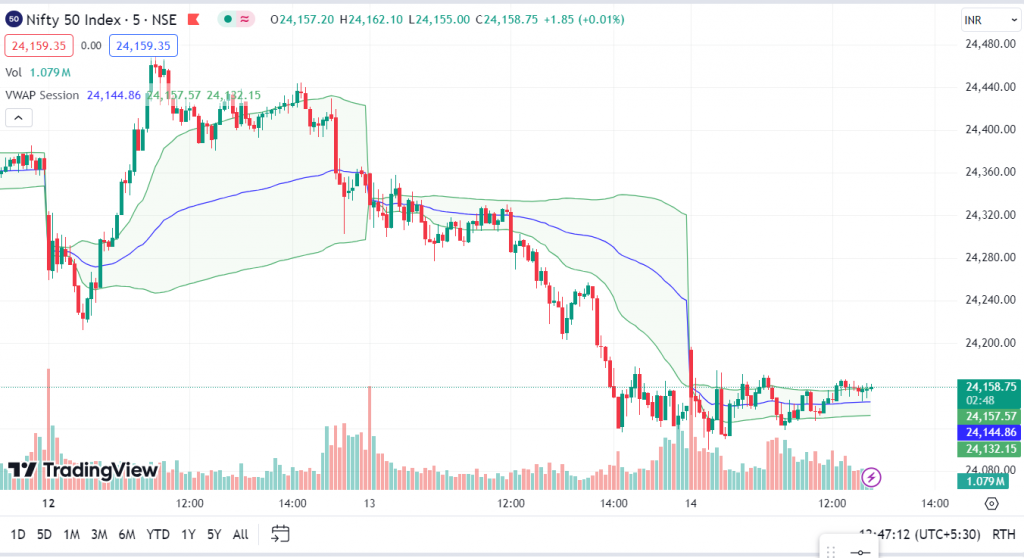
Strong volume breaking through VWAP can indicate a significant move in that direction. By employing VWAP as a trailing stop, scalpers might enter a trade in the direction of the breakout.
Confirmation: To lessen the possibility of fake breakouts, confirm the breakout using additional indicators such as volume spikes or momentum oscillators (e.g., RSI, MACD).
3. Parabolic SAR
The Parabolic SAR (Stop and Reverse) is another popular scalping trading indicator due to its simplicity in identifying potential entry and exit levels for scalpers.
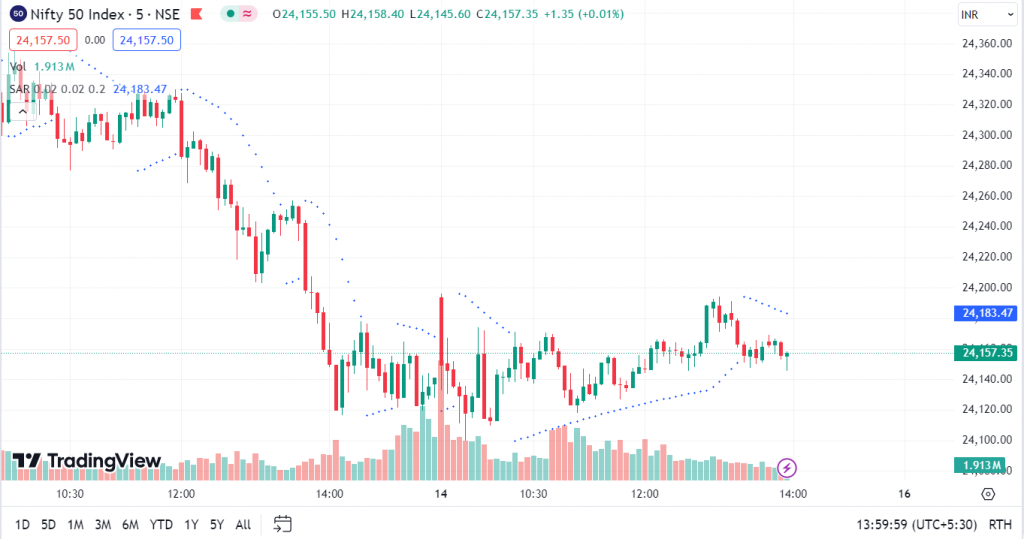
Entry
- Bullish Signal: When the Parabolic SAR dots move from above to below the price bars, it is a bullish signal to enter a long position. This suggests a possible change in trend from bearish to bullish.
- Bearish Signal: When the dots move from below to above the price bars, it may be an indication that the market is about to turn from bullish to bearish. At this point, you should enter a short position.
Exit
- Turning SAR Dots Around: When the SAR dots start to reverse, exit the trade. For instance, when the dots shift from below to above the price bars when you are in a long trade, it’s time to exit.
- Trailing Stop Loss: To trail your stop loss, use the Parabolic SAR dots. This permits trade while safeguarding profits.
4. Relative Strength Index (RSI)
The popular momentum oscillator Relative Strength Index (RSI), helps spot overbought and oversold situations, making it especially helpful as one of the best scalping trading indicators.

If you want to scalp, you can shorten the RSI duration (for example, to 7 or 9 periods) to increase the indicator’s sensitivity to sudden fluctuations in price. This makes it possible for speedier signals that better match the quick speed of scalping.
Short Time Frames: To detect swift movements, scalpers frequently utilize RSI on 1 or 5 minute charts. A brief trading opportunity may be suggested by a sharp increase or decrease in the RSI.
5. MACD (Moving Average Convergence Divergence)
The Moving Average Convergence Divergence (MACD) is one of the widely used scalping trading indicators because it can identify shifts in momentum and possible moments of entry or exit.
- Strategy: To spot possible buy or sell opportunities, look for crosses between the MACD line and the Signal line.
- Bullish Signal: A buy signal is generated when the MACD line crosses above the signal line.
- Bearish Signal: Indicates that you should sell when the MACD line crosses below the signal line.
- Entry Point: With the goal of making a fast profit, enter the trade as soon as the crossover happens.
- Exit Point: If you see that the MACD line begins to flatten or cross again, you should think about leaving.
Conclusion
There is no single best indicator for scalping that works in every market condition. Successful scalping depends on combining multiple indicators to confirm trend direction, momentum, entry, and exit points. Keep in mind that there isn’t a one-size-fits-all approach to options scalping trading. There is no one scalping trading indicator that can ensure success.
Read More: All 35 Candlestick Chart Patterns in the Stock Market-Explained
For market updates, visit StockEdge.
Frequently Asked Questions (FAQs)
1. Which option is best for scalping?
While many scalper traders focus on forex and equities products, futures and options are also excellent venues to apply this potent tactic.
2. Which indicator is best for option trading?
Moving averages, Bollinger bands, the Relative Strength Index (RSI), and Moving Average Convergence Divergence (MACD) are examples of frequently used indicators. These indicators provide a comprehensive picture of the market and work in tandem with fundamental analysis.
3. How profitable is scalping options?
Most scalpers aim for success rates that are higher than fifty percent. The chances of a scalper making a profit are significantly higher than in conventional trades because of the tiny profit targets. Lower risk: Ultra-short-term trading horizons are taken into consideration while designing scaling techniques.


