Elearnmarkets - Financial Market Learning
  • Courses
  • Webinars
  • Stories
  • Language
    • English
    • Hindi
    • Bengali
No Result
View All Result
Get Free Course
  • Basic Finance
  • Derivatives
    • Futures
    • Options
  • Financial Planning
  • Fundamental Analysis
  • Technical Analysis
  • Mutual Funds
  • Marketshala
  • Miscellaneous
Elearnmarkets - Learn Stock Market, trading, investing for Free
  • Courses
  • Webinars
  • Stories
  • Language
    • English
    • Hindi
    • Bengali
No Result
View All Result
Get Free Course
Elearnmarkets - Learn Stock Market, trading, investing for Free
No Result
View All Result
Home Fundamental Analysis
Gearing Ratio

What Is the Gearing Ratio? Formula & Calculation

Vineet Patawari by Vineet Patawari
December 3, 2024
in Fundamental Analysis
Reading Time: 8 mins read
0
1.1k
VIEWS
Share on FacebookShare on XShare on WhatsApp

Gearing ratio helps us in assessing how much financial leverage a company has. This important financial metric displays the ratio of a company’s debt to equity capital. The ratio shows how much debt or equity is used to fund a business’s operations. 

Investors and analysts can better comprehend a company’s financial standing and capacity to pay its debts by examining its gearing ratio. Lenders and investors frequently use this ratio to evaluate a company’s creditworthiness and future loan repayment capacity. 

In this regard, a company’s creditworthiness and general financial stability are significantly influenced by its gearing ratio.

Let us discuss about this ratio in detail:

Table of Contents

  • What is the Gearing Ratio?
  • Formula
  • Calculation Example
  • What is a Good Gearing Ratio?
  • What are the uses of the Gearing Ratio?
    • 1. By Lenders
    • 2. By Investors
    • 3. Comparison tool
    • 4. Planning capital structure
  • Frequently Asked Questions (FAQs)
    • How do gearing ratios work?
    • How to reduce gearing ratio?
    • Is a 30% gearing ratio good?
  • Conclusion

What is the Gearing Ratio?

The gearing ratio, or leverage ratio, assesses how much financial leverage a corporation has. By examining the percentage of debt and equity funding, it is used to evaluate the company’s long-term solvency.

Said another way, this ratio expresses the ratio of a company’s debt to equity or funds from shareholders. It shows how much of the company’s activities are financed by external debt and is given as a percentage or ratio.

Formula

One financial statistic used to assess a company’s level of financial leverage is the net gearing ratio. It contrasts the total amount of debt—which includes bank overdrafts and long—and short-term debt—with the total amount of shareholders’ equity. 

The formula is:

Net Gearing Ratio = (Long-Term Debt + Short-Term Debt + Bank Overdrafts) / Shareholders’ Equity

Calculation Example

Let us understand this ratio calculation with an example-

Suppose the company ABC has the following financials-

Total Debt: Rs. 500,000

Shareholders’ Equity: Rs. 1,000,000

Thus, the atio= 500000/1000000 = 0.5

Interpretation-

This means for every Re. 1 of equity; the company has Re. 0.50 of debt. A ratio of 50% indicates a moderate level of financial leverage.

What is a Good Gearing Ratio?

A low ratio suggests that the company is employing more equity financing, whilst a high ratio shows that the company is significantly depending on debt financing to fund its operations. 

It is widely accepted that a reasonable degree of gearing is preferable since it indicates a harmony between the utilization of debt and equity funding.

A ratio of more than fifty per cent indicates that the company has a large debt load relative to its equity. 

Given the company’s propensity for loan defaults and bankruptcy, especially during recessions or times of high interest rates, this is frequently regarded as a high-risk situation. 

A high ratio suggests that the company needs to borrow a large amount of money to sustain its operations, which could further strain its cash flow.

What are the uses of the Gearing Ratio?

Here are some of the uses of this ratio-
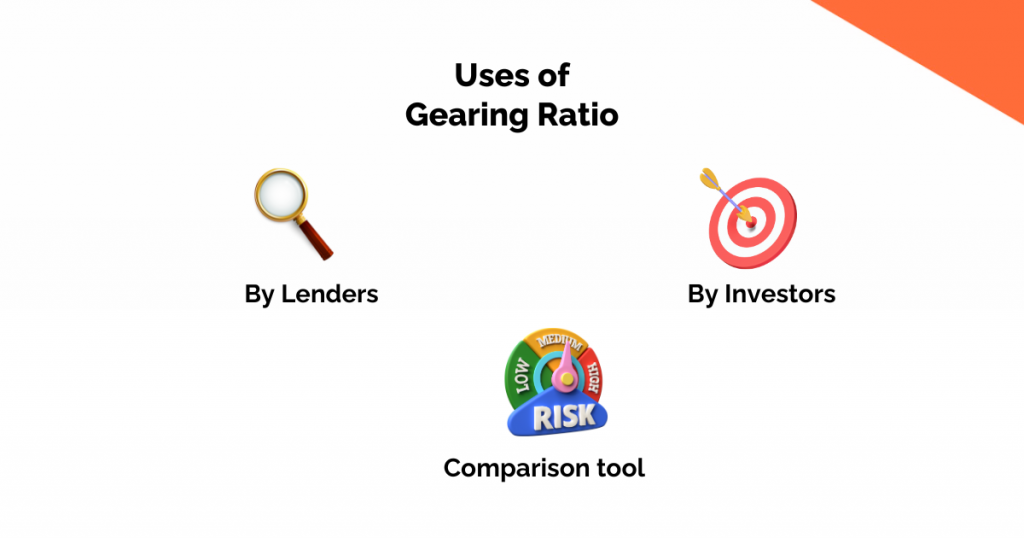
gearing ratio

1. By Lenders

An essential statistic used by creditors and lenders to assess a company’s creditworthiness is the gearing ratio.

As we discussed above, a high ratio could indicate a higher default risk, which could make it harder for a business to get funding or good loan terms. In contrast, a low ratio indicates a lesser default risk, which may attract lenders and creditors to a corporation.

2. By Investors

By giving an indication of a company’s leverage, the ratio aids analysts and investors in evaluating the financial risk associated with it. 

An elevated ratio signifies that the organization possesses a substantial debt load in comparison to its equity, hence augmenting its financial risk and susceptibility to fluctuations in interest rates and macroeconomic circumstances. 

Conversely, a low ratio denotes a less dependent financial structure on debt financing and is more prudent.

3. Comparison tool

When comparing businesses in the same sector or industry, this ratio is helpful. 

Comparing organizations can reveal which ones are more or less indebted in contrast to their peers because identical operations and revenue streams should result in similar gearing ratios

4. Planning capital structure

A crucial tool for businesses to consider when organizing their capital structure. This ratio can be used by a business to evaluate the effects of issuing more shares or taking on more debt. 

A business can create a capital structure that strikes a balance between its demand for funding and its tolerance for financial risk by examining various situations and how they affect th ratio.

For market updates, visit StockEdge

Frequently Asked Questions (FAQs)

How do gearing ratios work?

A financial measure called a gearing ratio contrasts the debt of an organization with the capital, or shareholders’ equity. Net gearing, which is computed by dividing total debt by total shareholders’ equity, is the most prevalent kind of gearing ratio. The ratio, which is given as a percentage, shows how much equity in a business would be required to settle its debt.

How to reduce gearing ratio?

By paying off their debts, businesses can lower their gearing ratio. There are several approaches to accomplish this, such as: selling stock. increasing shareholder equity through the issuance of additional shares to the public, which can be utilized to settle the company’s debt.

Is a 30% gearing ratio good?

25% to 50% is thought to be the ideal ratio. It shows that a business is fiscally prudent and consistently aims to finance its operations in a way that strikes a good balance between debt and shareholder equity.

Conclusion

One important financial indicator for assessing a company’s financial health is the gearing ratio. It offers insightful information on the ratio of equity to debt in a company’s capital structure. Debt financing is one way for a business to raise money for growth and expansion. The amount of debt that a business can take on without endangering it is determined in part by gearing ratios. Tax deductions for debt interest can reduce an organization’s after-tax profits and tax liability.

Tags: basicenglishinvestment basics
ShareTweetSend
Get Kotak Offer Get Kotak Offer Get Kotak Offer
Previous Post

Top 5 Fundamental Analysis Tools

Next Post

Top 5 Scalping Trading Indicators

Vineet Patawari

Vineet Patawari

Vineet is the co-founder of Elearnmarkets. He assumes the role of CEO and his job is to help the team get their job done. Vineet drives the growth strategy and its execution through product innovation, product marketing and brand building. He is dedicated to building high performance teams and enjoys being actively involved in problem solving for business growth. Vineet, an IIM Indore Alumnus is also a Chartered Accountant and his interests include digital marketing, blogging on recreational mathematics, travelling and has a passion for teaching. When not at work, he loves spending time with his two lovely sons Arham & Vihaan and his wife Preeti.

Related Posts

Top 5 Valuation Ratios in the Stock Market 1
Fundamental Analysis

Top 5 Valuation Ratios in the Stock Market

May 5, 2025
817
price to sales ratio
Fundamental Analysis

Price to Sales Ratio: A Key Metric for Understanding Company Value

May 5, 2025
441
Top 5 Fundamental Analysis Tools 2
Fundamental Analysis

Top 5 Fundamental Analysis Tools

January 31, 2025
4.1k
Business Models - Example, Types, Importance & Advantages 3
Fundamental Analysis

Business Models – Example, Types, Importance & Advantages

May 14, 2024
186k

Leave a Reply Cancel reply

Your email address will not be published. Required fields are marked *

Disclaimer

Elearnmarkets (Kredent InfoEdge Pvt. Ltd.) is a SEBI-registered Research Analyst (RA) entity (SEBI Registration No.: INH300007493). The information provided in this article is for educational and informational purposes only and should not be considered as an offer to buy or sell any securities or investment products.

The stocks, securities, and investment instruments mentioned herein are not recommendations under SEBI (Research Analysts) Regulations, 2014. Readers are advised to conduct their own due diligence and seek independent financial advice before making any investment decisions.

Investments in securities markets are subject to market risks. Please read all related documents carefully before investing. Investing in Equity Shares,
Derivatives, Mutual Funds, or other instruments carry inherent risks, including potential loss of capital. Elearnmarkets (Kredent InfoEdge Pvt. Ltd.) does not provide any guarantee or assurance of returns on any investments. Past performance is not indicative of future performance.

Elearnmarkets Logo

Follow Us

Facebook-f X-twitter Instagram Linkedin-in Youtube Telegram

Register on Elearnmarkets

Continue your financial learning by creating your own account on Elearnmarkets.com

Register Free Account

Download App

Playstore logo
Download on app store

Categories

  • Basic Finance
  • Derivatives
  • Financial Planning
  • Fundamental Analysis
  • Technical Analysis
  • Mutual Funds
  • Miscellaneous

Popular On Elearnmarkets

  • Market Superheroes:
  • Vivek Bajaj
  • Chetan Panchamia
  • Ashish Kyal
  • Premal Parekh
  • Abhijit Paul
  • Jegan
  • Sivakumar Jayachadran
  • Jyoti Budhia
  • Vivek Gadodia
  • Vishal Mehta
  • Piyush Chaudhry
  • Santosh Pasi
  • Gomathi Shankar
  • Market Superheroes:
  • Vivek Bajaj
  • Chetan Panchamia
  • Ashish Kyal
  • Premal Parekh
  • Abhijit Paul
  • Jegan
  • Sivakumar Jayachadran
  • Jyoti Budhia
  • Vivek Gadodia
  • Vishal Mehta
  • Piyush Chaudhry
  • Santosh Pasi
  • Gomathi Shankar
  • Courses:​
  • Options Trading
  • Dow Theory
  • Momentum Trading
  • Stock Investing
  • Harmonic Chart Patterns
  • Algo Trading
  • Elliot Wave Theory
  • Advanced Excel
  • Cryptocurrency
  • NSE Certification Course
  • Courses:​
  • Options Trading
  • Dow Theory
  • Momentum Trading
  • Stock Investing
  • Harmonic Chart Patterns
  • Algo Trading
  • Elliot Wave Theory
  • Advanced Excel
  • Cryptocurrency
  • NSE Certification Course
  • Webinars:
  • Bank Nifty Scalping
  • Intraday Trading Strategies
  • Options Trading Strategies
  • Options selling
  • Price Action
  • Relative Strength
  • Tax Planning
  • Options Buying
  • Growth Stocks
  • Portfolio Management
  • Risk Management
  • Renko Charts
  • Crude Oil
  • Traders Psychology
  • Moving Average
  • Multibagger Stocks
  • Free Learning Modules:
  • Intraday Trading
  • Options Scalping
  • Swing Trading
  • Financial Modelling
  • RSI Indicator
  • Bollinger Bands
  • Pricing of Futures
  • Personal Finance
  • Initial Public Offerings (IPO)
  • Value Investing
  • Technical Indicators
  • Candlesticks
  • Chart Patterns
  • Option Greeks
  • ELSS Funds
  • Banking and Insurance
  • Real Estate
  • Gold
  • Book Summaries:
  • Rich Dad Poor Dad
  • Psychology of Money
  • The Intelligent Investor
  • The Richest Man in Babylon
  • Think and Trade Like a Champion
  • Value Investing and Behavioural Finance
  • Trading in the Zone
  • Learn to Earn
  • Book Summaries:
  • Rich Dad Poor Dad
  • Psychology of Money
  • The Intelligent Investor
  • The Richest Man in Babylon
  • Think and Trade Like a Champion
  • Value Investing and Behavioural Finance
  • Trading in the Zone
  • Learn to Earn
  • Tools:
  • CAGR Calculator
  • SIP Calculator
  • eLearnOptions
  • Future Value Calculator
  • Present Value Calculator
  • Atal Pension Yojana
  • Cost of Delay Calculator
  • Become a Crorepati
  • Tools:
  • CAGR Calculator
  • SIP Calculator
  • eLearnOptions
  • Future Value Calculator
  • Present Value Calculator
  • Atal Pension Yojana
  • Cost of Delay Calculator
  • Become a Crorepati

© 2025 Elearnmarkets. All Rights Reserved

  • Visit Elearnmarkets
  • Courses
  • Webinars
  • Financial Guides
  • Get Free Counselling
  • Visit Elearnmarkets
  • Courses
  • Webinars
  • Financial Guides
  • Get Free Counselling

Download Our App

No Result
View All Result
  • Article Categories
    • Basic Finance
    • Derivatives
    • Financial Planning
    • Fundamental Analysis
    • Technical Analysis
    • ETFs & Mutual Funds
    • Marketshala
    • Miscellaneous
  • Language
    • Hindi
    • Bengali
    • English
  • Courses
  • Webinars
  • Stories
Get Free Course

© 2024 Elearnmarkets All Rights Reserved

Trading Day 2025