Elearnmarkets - Financial Market Learning
  • Categories
    • Basic Finance
    • Derivatives
    • Financial Planning
    • Fundamental Analysis
    • Technical Analysis
    • Marketshala
    • Miscellaneous
  • Language
    • English
    • Hindi
    • Bengali
No Result
View All Result
  • Courses
  • Webinars
  • Learn On Elearnmarkets
Elearnmarkets - Learn Stock Market, trading, investing for Free
No Result
View All Result
Home Technical Analysis Charts, Patterns & Indicators
Shooting Star Pattern

The Technicality of Shooting Stars

Elearnmarkets by Elearnmarkets
November 18, 2020
in Charts, Patterns & Indicators, Technical Analysis
Reading Time: 3 mins read
0
713
VIEWS
Share on FacebookShare on TwitterShare on WhatsApp

As we all know, technical analysis is a method of analysis of financial instruments with the use of price data and statistical tools.

It tries to determine the future trend and movement of the price with the help past market data.

Just like fundamental analysts, technical analysts also have different styles of analysis.

Some prefer chart patterns while others prefer technical indicators.

Some people prefer both of them and use them efficiently.

Candlestick charts are also a part of the modern-day technical analysis.

Join TMP Join TMP Join TMP

Learn technical analysis in NSE Academy Certified Technical Analysis course on Elearnmarkets.

9. Shooting Star

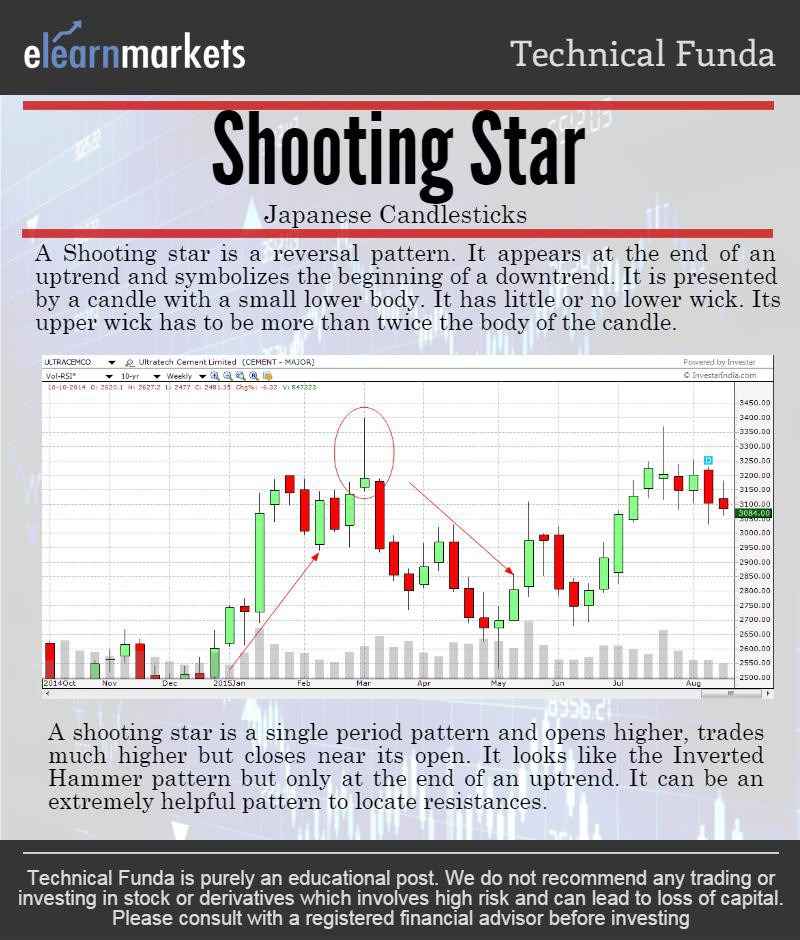
The Shooting star is one such widely followed candlestick pattern.

It is a bearish reversal pattern. It usually forms at the end of an uptrend.

Since it forms after an advance and takes the star position in the pattern before the trend reversal starts, it gets its name as the Shooting star pattern.

The shooting star is a single candlestick pattern.

The candle can represent different time periods, which can be as short as a minute, 5 minutes, an hour or as long as a day, a week or even a month.

The shooting star is made up of a black or white candle (up day or a down day).

It has a small body with a long upper shadow and a very small or negligible lower shadow.

The size of the upper shadow should be at least twice the size of the body of the candle.

The high low range of the candle should be comparatively large compared to the previous 10-20 periods.

By looking into the recent charts, we can identify the Shooting Star pattern in many of the widely recognized stocks of the Indian Stock Markets.

Some of the recent pattern formations can be seen as follows:

ULTRATECH CEMENT LIMITED

shooting star

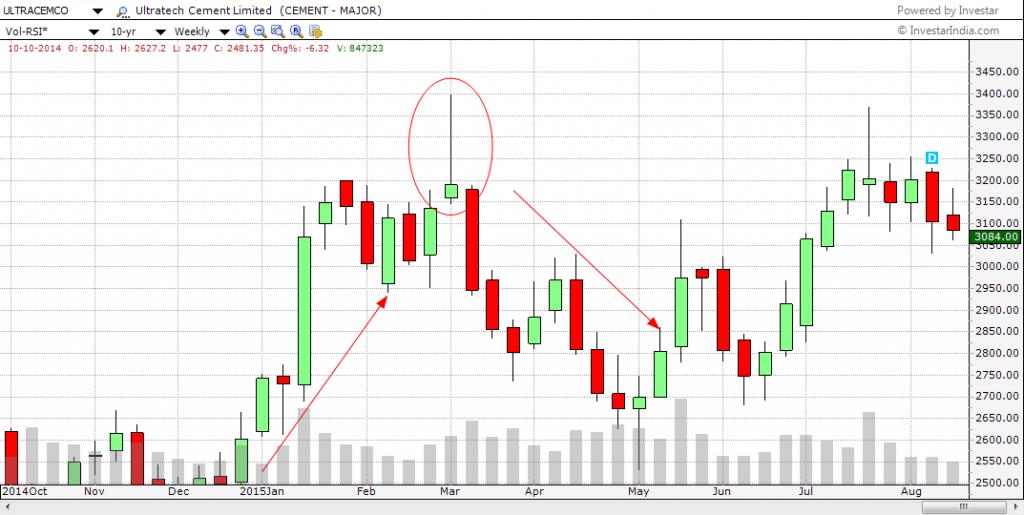
As we can see above in the chart of Ultra Cement Limited (ULTRACEMCO), after a series of up days, the stock has gone up to 3150 levels at the end of Feb 2015 from the levels of 2500 since the end of Dec 2014.

In the first weekly candle in the month of March 2015, the candlestick:

  1. Opens at 3159
  2. Makes a low of 2415, which can be considered negligible.
  3. Makes a high of 3398, which actually forms the upper wick of the candle
  4. And finally closes at 3189 which is the near the open of the candle.

Thus the above price movement made a weekly candlestick which formed the pattern of a shooting star.

Furthermore, a candlestick pattern is confirmed only when the candles of the periods succeeding the shooting star is in tandem with the pattern characteristics.

Here, the candle next to the shooting star is a big bearish candle.

It almost looks like a Marubozu candle with no(or negligible) upper or lower shadow.

The candle opened at 3180 and closed at 2947 confirming that the trend has reversed and is now bearish.

Bharti Airtel

artl

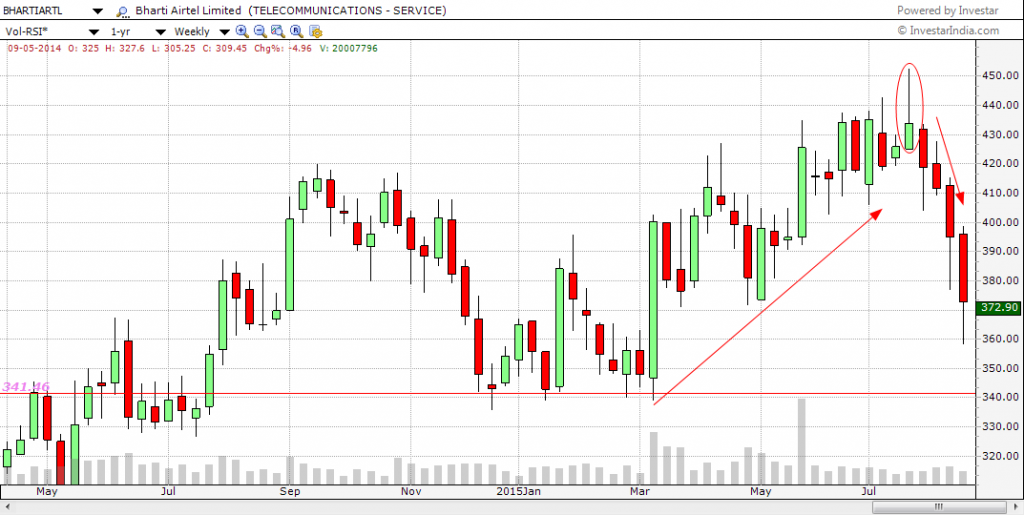
With a consistent uptrend in the weekly charts from 340, It went up as high as 440.

It formed a shooting star pattern in the third week of July 2015.

After that series of four bearish candles has brought down the stock to levels of 360.

Know More: All you need to know about the Japanese Candlestick

Bottomline:

The Shooting star pattern basically indicates selling opportunities.

It can also signal to sell off existing positions.

But the textbook description, the shooting star should gap away from the previous candlestick.

The gap enhances the impact of the shooting star, but also the absence of it doesn’t indicate a loss of the essence of the pattern.


Tags: english
ShareTweetSend
Previous Post

RBI gave a nod to 11 companies, Market still loses more than 1%

Next Post

Global Markets falling, Paper looks promising

Elearnmarkets

Elearnmarkets

Elearnmarkets (ELM) is a complete financial market portal where the market experts have taken the onus to spread financial education. ELM constantly experiments with new education methodologies and technologies to make financial education effective, affordable and accessible to all. You can connect with us on Twitter @elearnmarkets.

Related Posts

Technical Analysis in Stock Trading 1
Technical Analysis

Technical Analysis in Stock Trading

May 31, 2023
6k
The Ultimate guide to Trading Divergences 2
Technical Analysis

The Ultimate guide to Trading Divergences

May 26, 2023
993
Trading Psychology: Guide to Master Your Mind in 5 Steps 3
Technical Analysis

Trading Psychology: Guide to Master Your Mind in 5 Steps

May 24, 2023
3k
Trading Psychology: 7 Keys to Successful Trading 4
Technical Analysis

Trading Psychology: 7 Keys to Successful Trading

May 22, 2023
3k

Leave a Reply Cancel reply

Your email address will not be published. Required fields are marked *

Follow Us

Facebook-f Twitter Instagram Linkedin-in Youtube Telegram

Register on Elearnmarkets

Continue your financial learning by creating your own account on Elearnmarkets.com

Register Free Account

Download App

Categories

  • Basic Finance
  • Derivatives
  • Financial Planning
  • Fundamental Analysis
  • Technical Analysis
  • Marketshala
  • Miscellaneous

Popular On Elearnmarkets

  • Market Superheroes:
  • Vivek Bajaj
  • Chetan Panchamia
  • Ashish Kyal
  • Premal Parekh
  • Abhijit Paul
  • Jegan
  • Sivakumar Jayachadran
  • Vishal Malkan
  • Jyoti Budhia
  • Vivek Gadodia
  • Vishal Mehta
  • Piyush Chaudhry
  • Santosh Pasi
  • Gomathi Shankar
  • Market Superheroes:
  • Vivek Bajaj
  • Chetan Panchamia
  • Ashish Kyal
  • Premal Parekh
  • Abhijit Paul
  • Jegan
  • Sivakumar Jayachadran
  • Vishal Malkan
  • Jyoti Budhia
  • Vivek Gadodia
  • Vishal Mehta
  • Piyush Chaudhry
  • Santosh Pasi
  • Gomathi Shankar
  • Courses:​
  • Options Trading
  • Dow Theory
  • Momentum Trading
  • Stock Investing
  • Stock Market for Beginners
  • Harmonic Chart Patterns
  • Algo Trading
  • Elliot Wave Theory
  • Advanced Excel
  • Cryptocurrency
  • NSE Certification Course
  • Courses:​
  • Options Trading
  • Dow Theory
  • Momentum Trading
  • Stock Investing
  • Stock Market for Beginners
  • Harmonic Chart Patterns
  • Algo Trading
  • Elliot Wave Theory
  • Advanced Excel
  • Cryptocurrency
  • NSE Certification Course
  • Webinars:
  • Bank Nifty Scalping
  • Intraday Trading Strategies
  • Options Trading Strategies
  • Options selling
  • Price Action
  • Relative Strength
  • Tax Planning
  • Options Buying
  • Growth Stocks
  • Portfolio Management
  • Relative Strength Index
  • Risk Management
  • Renko Charts
  • Crude Oil
  • Traders Psychology
  • Moving Average
  • Multibagger Stocks
  • Free Learning Modules:
  • Intraday Trading
  • Options Scalping
  • Swing Trading
  • Financial Modelling
  • RSI Indicator
  • Bollinger Bands
  • Pricing of Futures
  • Personal Finance
  • Initial Public Offerings (IPO)
  • Value Investing
  • Technical Indicators
  • Candlesticks
  • Chart Patterns
  • Option Greeks
  • ELSS Funds
  • Banking and Insurance
  • Real Estate
  • Gold
  • Book Summaries:
  • Rich Dad Poor Dad
  • Psychology of Money
  • The Intelligent Investor
  • The Richest Man in Babylon
  • Think and Trade Like a Champion
  • Value Investing and Behavioural Finance
  • Trading in the Zone
  • Learn to Earn
  • Book Summaries:
  • Rich Dad Poor Dad
  • Psychology of Money
  • The Intelligent Investor
  • The Richest Man in Babylon
  • Think and Trade Like a Champion
  • Value Investing and Behavioural Finance
  • Trading in the Zone
  • Learn to Earn
  • Tools:
  • CAGR Calculator
  • SIP Calculator
  • eLearnOptions
  • Future Value Calculator
  • Present Value Calculator
  • Atal Pension Yojana
  • Cost of Delay Calculator
  • Become a Crorepati
  • Tools:
  • CAGR Calculator
  • SIP Calculator
  • eLearnOptions
  • Future Value Calculator
  • Present Value Calculator
  • Atal Pension Yojana
  • Cost of Delay Calculator
  • Become a Crorepati

© 2023 Elearnmarkets. All Rights Reserved

  • Visit Elearnmarkets
  • Courses
  • Webinars
  • Financial Guides
  • Get Free Counselling
  • Visit Elearnmarkets
  • Courses
  • Webinars
  • Financial Guides
  • Get Free Counselling

Get Elearnmarkets App

No Result
View All Result
  • Article Categories
    • Basic Finance
    • Derivatives
    • Financial Planning
    • Fundamental Analysis
    • Technical Analysis
    • Marketshala
    • Miscellaneous
  • Language
    • Hindi
    • Bengali
    • English
  • Courses
  • Webinars

© 2020 Elearnmarkets All Rights Reserved