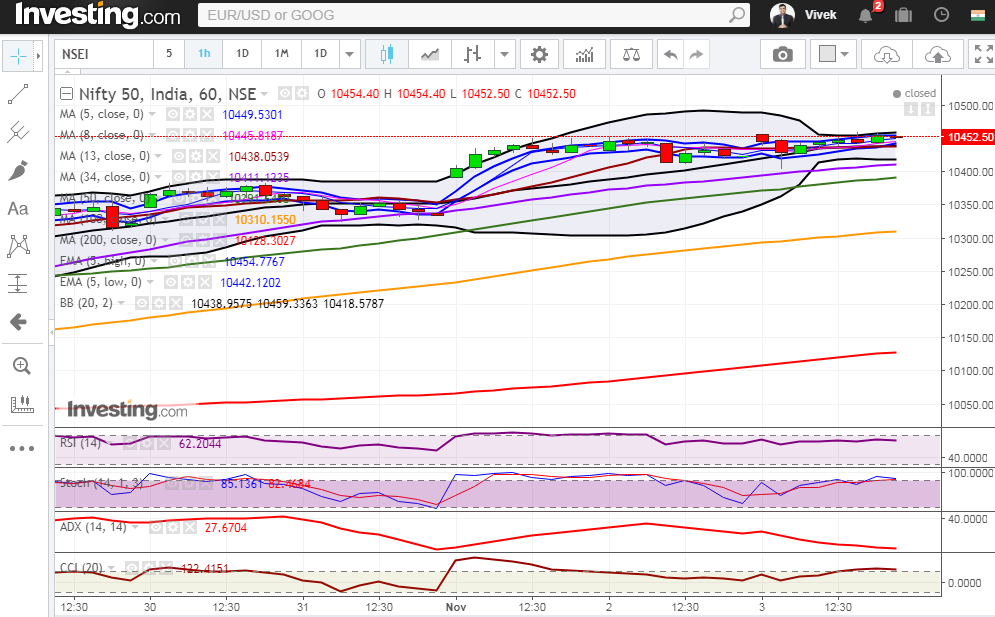
Nifty sees some profit booking at the record high
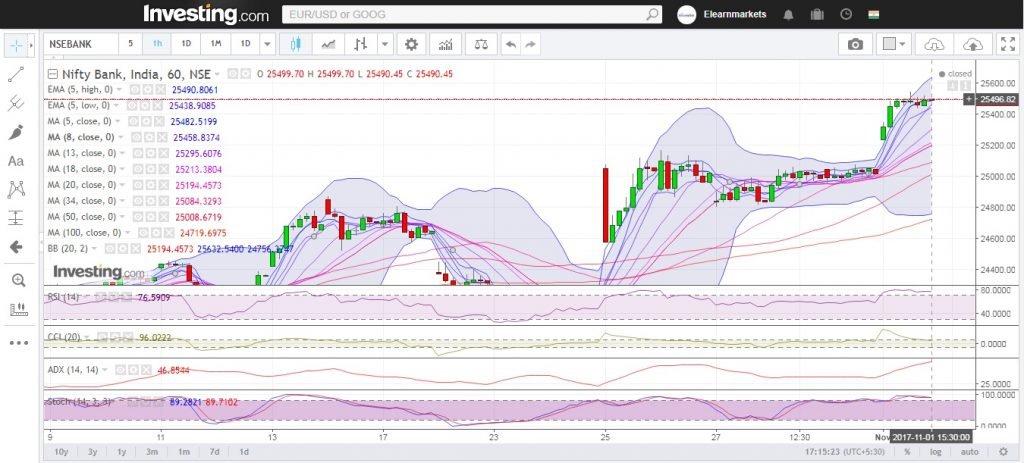
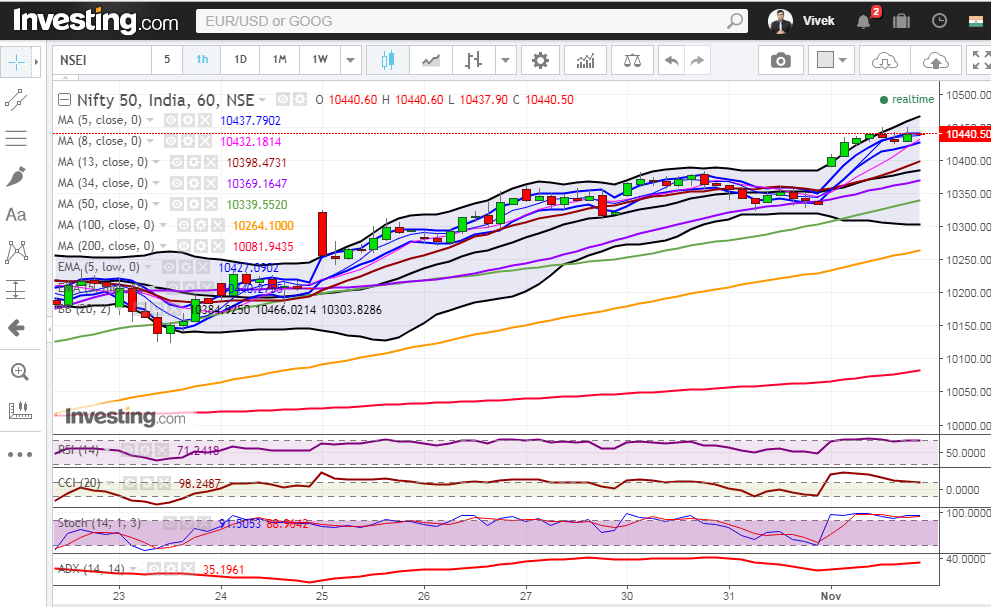
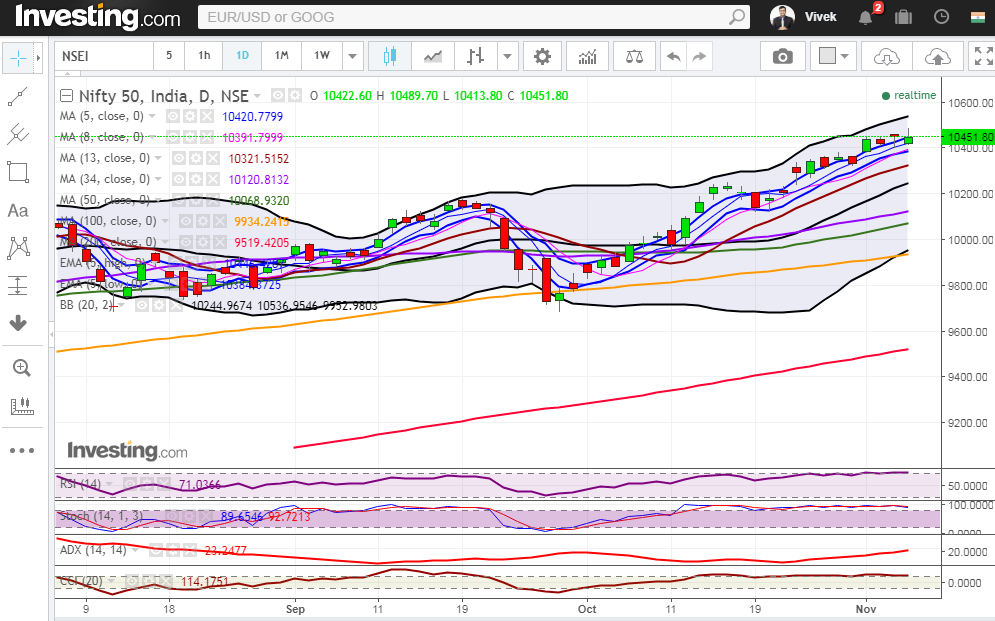
Nifty close: Nifty saw some profit booking in the second half of today’s trading session. There was a heavy selling by FII on Friday’s session at the top so it’s better to be cautious. Hourly Technical: In the hourly chart,...