Elearnmarkets - Financial Market Learning
  • Categories
    • Basic Finance
    • Derivatives
      • Futures
      • Options
    • Financial Planning
    • Fundamental Analysis
    • Technical Analysis
    • Marketshala
    • Miscellaneous
  • Language
    • English
    • Hindi
    • Bengali
No Result
View All Result
  • Courses
  • Webinars
  • Stories
Elearnmarkets - Learn Stock Market, trading, investing for Free
No Result
View All Result
Home Technical Analysis
Force Index 1

Force Index

Elearnmarkets by Elearnmarkets
August 24, 2023
in Technical Analysis, Charts, Patterns & Indicators
Reading Time: 3 mins read
0
511
VIEWS
Share on FacebookShare on XShare on WhatsApp

The Force index measures the strength of the price move based on three important parameters which include volume, direction, and extent.

It was invented by Alexander Elder and this oscillator actually fluctuates around the zero line.

Read More: Triple screen trading system: the Alexander Elder way of trading

When the indicator goes from positive to negative, the uptrend possibly comes to an end and it marks the starting of the downtrend.

Similarly, when the indicator goes from negative to positive, it signals the beginning of an uptrend.

Calculation

It is calculated as the difference between the current and the previous closing price multiplied by current trading volume.

The default period is taken as 13 periods and the 13-period Force Index is computed by taking 13 periods EMA of above calculated Force Index.

Force Index(1) = {Close (current period)  –  Close (prior period)} x Volume
Force Index(13) = 13-period EMA of Force Index(1)

How is it helpful to traders?

The Force Index primarily has three main uses which include identifying corrections within the trend, trend confirmation and locating divergences.

RelatedPosts

5 Tools to Spot Trend Reversals in Stocks 2

5 Tools to Spot Trend Reversals in Stocks

September 28, 2023
6.2k
Beginner's Guide to Trading Penny Stocks 3

Beginner’s Guide to Trading Penny Stocks

September 26, 2023
1.6k
5 Important Volatility Indicators that Traders should know 4

5 Important Volatility Indicators that Traders should know

September 19, 2023
58.4k

Let’s understand each of these uses in detail-

Trend Identification/Confirmation

The indicator basically shows a strong shift in buying and selling momentum.

The traders want to be on the sidelines when the force index clings close to the zero line as it indicates weak momentum.

When the Force index stays above the zero line, it signals an uptrend.

Also Read: How to identify trend and correction using Force Index?

When it goes above the zero line forcefully, it shows strong buying pressure.

You may do NSE Academy Technical Analysis course to enhance your understanding of Technical analysis and various strategies.

Similarly, when it stays below the zero line, it signals a downtrend.

When it goes below the zero line forcefully, it shows strong selling pressure.

Elder force Nifty chart

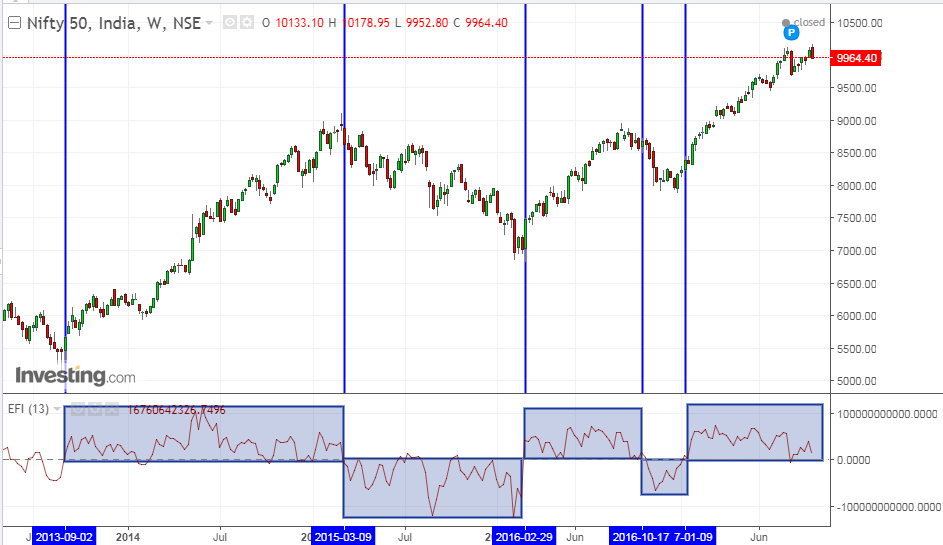
The above is the weekly chart of Nifty 50.

It is clearly evident that whenever the Force index is above the zero line, Nifty has been in a positive territory and has given a good up move.

Similarly, when it is below the zero line, Nifty has given a good correction.

The farther it is away from the zero line, stronger is the trend.

Identifying Corrections

With the help of trend confirmation or identification and short-term Force Index (say 2-period), one can find good entry points during the trending phase.

This is actually a very active strategy but if you want to decrease the number of trading signals, you may increase the time period on the Force Index.

During an uptrend, when the 2-period Force index goes below the zero line and then rallies back above zero, a buy signal is generated.

Similarly, during a downtrend, when the 2-period Force index goes above the zero line and then rallies back below zero, a sell signal is generated.
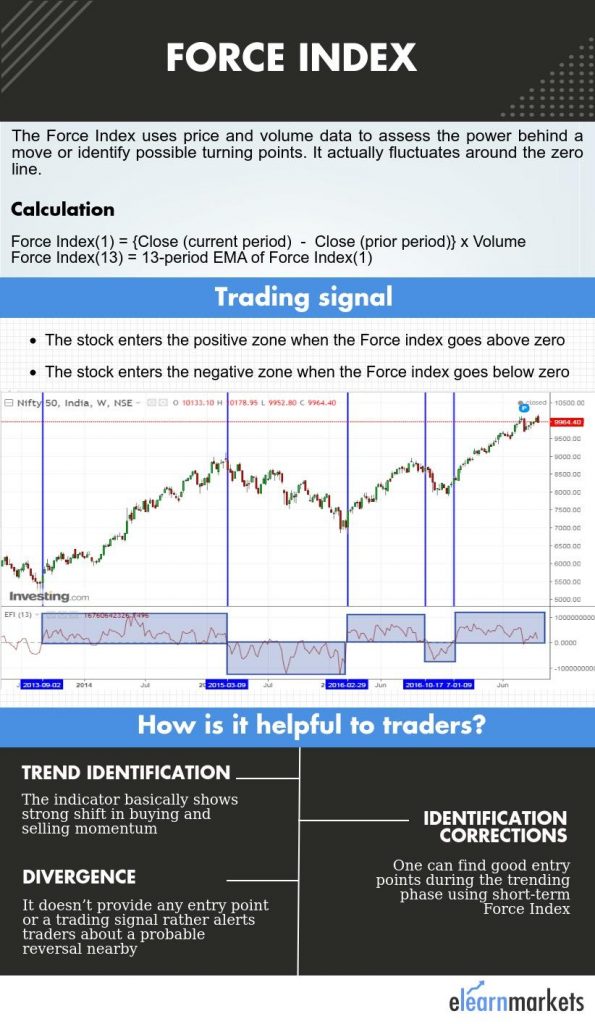
Force index

Divergence

Divergence takes place when both the price and the indicator are not moving in the same direction.

Suppose the price is making higher highs but the indicator is making a lower high and vice versa.

Divergence basically shows weakness in the existing trend and signals either the magnitude of price or the volume is weakening.

It doesn’t provide any entry point or a trading signal rather alerts traders about a probable reversal in the coming period.

However, the reversal could take a long time to happen or it may not come at all.

Bottomline

The Force Index is a versatile indicator which actually combines both price action as well as volume to quantify a valuable metric.

It should be used in conjunction with price patterns and other indicators in order to filter out the divergence and also to trade the divergence in a better way.

Tags: DivergenceenglishForce indexIndicators and oscillatorstechnical analysis
ShareTweetSend
Get Kotak Offer Get Kotak Offer Get Kotak Offer
Previous Post

15 Gann techniques which every trader should know

Next Post

Support and Resistance – Overview, Calculation using chart, Reversal

Elearnmarkets

Elearnmarkets

Elearnmarkets (ELM) is a complete financial market portal where the market experts have taken the onus to spread financial education. ELM constantly experiments with new education methodologies and technologies to make financial education effective, affordable and accessible to all. You can connect with us on Twitter @elearnmarkets.

Related Posts

5 Tools to Spot Trend Reversals in Stocks 5
Technical Analysis

5 Tools to Spot Trend Reversals in Stocks

September 28, 2023
6.2k
Beginner's Guide to Trading Penny Stocks 6
Technical Analysis

Beginner’s Guide to Trading Penny Stocks

September 26, 2023
1.6k
5 Important Volatility Indicators that Traders should know 7
Technical Analysis

5 Important Volatility Indicators that Traders should know

September 19, 2023
58.4k
Top 5 Momentum Indicators that Analyses Trend Strength 8
Technical Analysis

Top 5 Momentum Indicators that Analyses Trend Strength

September 7, 2023
94.3k

Leave a Reply Cancel reply

Your email address will not be published. Required fields are marked *

Elearnmarkets Logo

Follow Us

Facebook-f Twitter Instagram Linkedin-in Youtube Telegram

Register on Elearnmarkets

Continue your financial learning by creating your own account on Elearnmarkets.com

Register Free Account

Download App

Playstore logo
Download on app store

Categories

  • Basic Finance
  • Derivatives
  • Financial Planning
  • Fundamental Analysis
  • Technical Analysis
  • Marketshala
  • Miscellaneous

Popular On Elearnmarkets

  • Market Superheroes:
  • Vivek Bajaj
  • Chetan Panchamia
  • Ashish Kyal
  • Premal Parekh
  • Abhijit Paul
  • Jegan
  • Sivakumar Jayachadran
  • Vishal Malkan
  • Jyoti Budhia
  • Vivek Gadodia
  • Vishal Mehta
  • Piyush Chaudhry
  • Santosh Pasi
  • Gomathi Shankar
  • Market Superheroes:
  • Vivek Bajaj
  • Chetan Panchamia
  • Ashish Kyal
  • Premal Parekh
  • Abhijit Paul
  • Jegan
  • Sivakumar Jayachadran
  • Vishal Malkan
  • Jyoti Budhia
  • Vivek Gadodia
  • Vishal Mehta
  • Piyush Chaudhry
  • Santosh Pasi
  • Gomathi Shankar
  • Courses:​
  • Options Trading
  • Dow Theory
  • Momentum Trading
  • Stock Investing
  • Stock Market for Beginners
  • Harmonic Chart Patterns
  • Algo Trading
  • Elliot Wave Theory
  • Advanced Excel
  • Cryptocurrency
  • NSE Certification Course
  • Courses:​
  • Options Trading
  • Dow Theory
  • Momentum Trading
  • Stock Investing
  • Stock Market for Beginners
  • Harmonic Chart Patterns
  • Algo Trading
  • Elliot Wave Theory
  • Advanced Excel
  • Cryptocurrency
  • NSE Certification Course
  • Webinars:
  • Bank Nifty Scalping
  • Intraday Trading Strategies
  • Options Trading Strategies
  • Options selling
  • Price Action
  • Relative Strength
  • Tax Planning
  • Options Buying
  • Growth Stocks
  • Portfolio Management
  • Relative Strength Index
  • Risk Management
  • Renko Charts
  • Crude Oil
  • Traders Psychology
  • Moving Average
  • Multibagger Stocks
  • Free Learning Modules:
  • Intraday Trading
  • Options Scalping
  • Swing Trading
  • Financial Modelling
  • RSI Indicator
  • Bollinger Bands
  • Pricing of Futures
  • Personal Finance
  • Initial Public Offerings (IPO)
  • Value Investing
  • Technical Indicators
  • Candlesticks
  • Chart Patterns
  • Option Greeks
  • ELSS Funds
  • Banking and Insurance
  • Real Estate
  • Gold
  • Book Summaries:
  • Rich Dad Poor Dad
  • Psychology of Money
  • The Intelligent Investor
  • The Richest Man in Babylon
  • Think and Trade Like a Champion
  • Value Investing and Behavioural Finance
  • Trading in the Zone
  • Learn to Earn
  • Book Summaries:
  • Rich Dad Poor Dad
  • Psychology of Money
  • The Intelligent Investor
  • The Richest Man in Babylon
  • Think and Trade Like a Champion
  • Value Investing and Behavioural Finance
  • Trading in the Zone
  • Learn to Earn
  • Tools:
  • CAGR Calculator
  • SIP Calculator
  • eLearnOptions
  • Future Value Calculator
  • Present Value Calculator
  • Atal Pension Yojana
  • Cost of Delay Calculator
  • Become a Crorepati
  • Tools:
  • CAGR Calculator
  • SIP Calculator
  • eLearnOptions
  • Future Value Calculator
  • Present Value Calculator
  • Atal Pension Yojana
  • Cost of Delay Calculator
  • Become a Crorepati

© 2023 Elearnmarkets. All Rights Reserved

  • Visit Elearnmarkets
  • Courses
  • Webinars
  • Financial Guides
  • Get Free Counselling
  • Visit Elearnmarkets
  • Courses
  • Webinars
  • Financial Guides
  • Get Free Counselling

Get Elearnmarkets App

No Result
View All Result
  • Article Categories
    • Basic Finance
    • Derivatives
    • Financial Planning
    • Fundamental Analysis
    • Technical Analysis
    • Marketshala
    • Miscellaneous
  • Language
    • Hindi
    • Bengali
    • English
  • Courses
  • Webinars
  • Stories

© 2020 Elearnmarkets All Rights Reserved

A Handbook of Technical Analysis
To start your trading journey as a seasoned technical analyst
Download Now
View Details
View Course Details
Guidebook On Chart Patterns
Take Your Trading To The Next Level With Strategies Shared In This Ebook
Download Now