Elearnmarkets - Financial Market Learning
  • Categories
    • Basic Finance
    • Derivatives
    • Financial Planning
    • Fundamental Analysis
    • Technical Analysis
    • Marketshala
    • Miscellaneous
  • Language
    • English
    • Hindi
    • Bengali
No Result
View All Result
  • Courses
  • Webinars
  • Learn On Elearnmarkets
Elearnmarkets - Learn Stock Market, trading, investing for Free
No Result
View All Result
Home Technical Analysis
How to identify long term trades using Coppock curve? 1

How to identify long term trades using Coppock curve?

Elearnmarkets by Elearnmarkets
November 18, 2020
in Technical Analysis, Charts, Patterns & Indicators
Reading Time: 4 mins read
1
2.5k
VIEWS
Share on FacebookShare on TwitterShare on WhatsApp

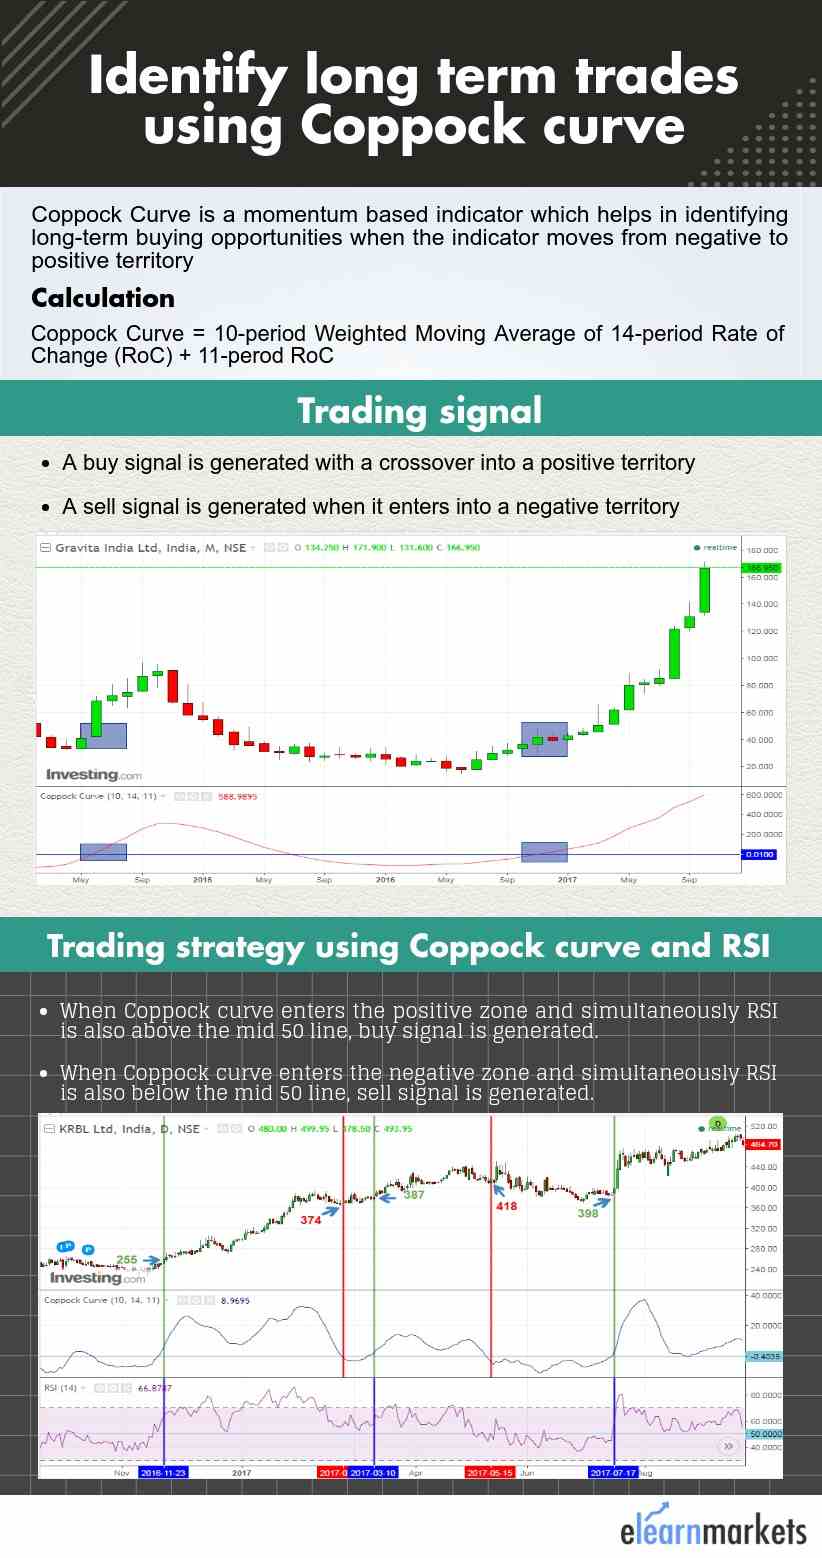
The Coppock Curve is a momentum based indicator invented by Edwin Coppock in the year 1965.

The signals generated by this curve are actually very simple and helps in identifying long-term buying opportunities when the indicator moves from negative to positive territory.

Though Edwin Coppock used this to generate buy signals only, however other analysts also use it as a sell signal when there is a cross from positive to negative zone.

Calculation of Coppock Curve

Coppock Curve = 10-period WMA of 14-period RoC + 11-perod RoC

where,

WMA = Weighted moving average

RoC = Rate-of-Change

Also Read: 5, 30 Moving Average crossover strategy using ROC

Trading Signals

In the monthly chart, you will not get many signals using Coppock curve but these limited signals are very strong either way.

There is a center zero line and above which there is a positive territory and below which is seen as a negative area.

Join TMP Join TMP Join TMP

A buy signal is generated with a crossover into a positive territory while a sell signal is generated when it enters into a negative territory.

Also read: Mastering Inside bar trading strategy

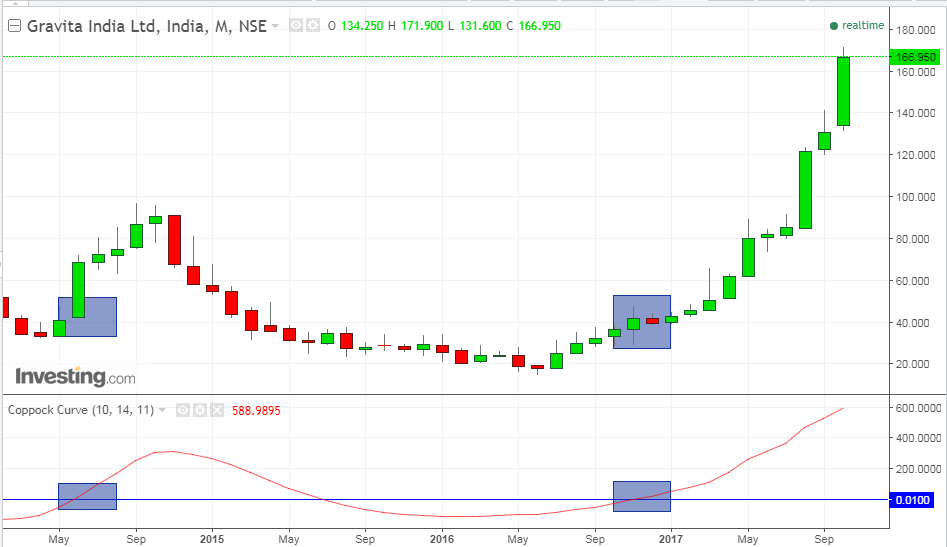
The chart below is the monthly chart of Gravita India where we can see that whenever the Coppock curve has entered the positive territory.

You can expect a positive price movement in the coming months after it enters the zero line from the negative territory.

After the crossover in the mid of the year 2016, the stock has given more than 400% in the span of almost a year.

Coppock curve monthly chart

Flexibility

The Coppock curve is basically a smoothed momentum oscillator where the momentum is measured by ROC and weighted moving average smoothes the data.

Know More: How to trade using moving average on different timeframes?

It implies that we can use this indicator on different time frame including daily, weekly, monthly and in other time frames too.

Higher the timeframe, lower the whipsaws and better the signal.

Coppock curve infographic

Trading strategy using Coppock curve and RSI

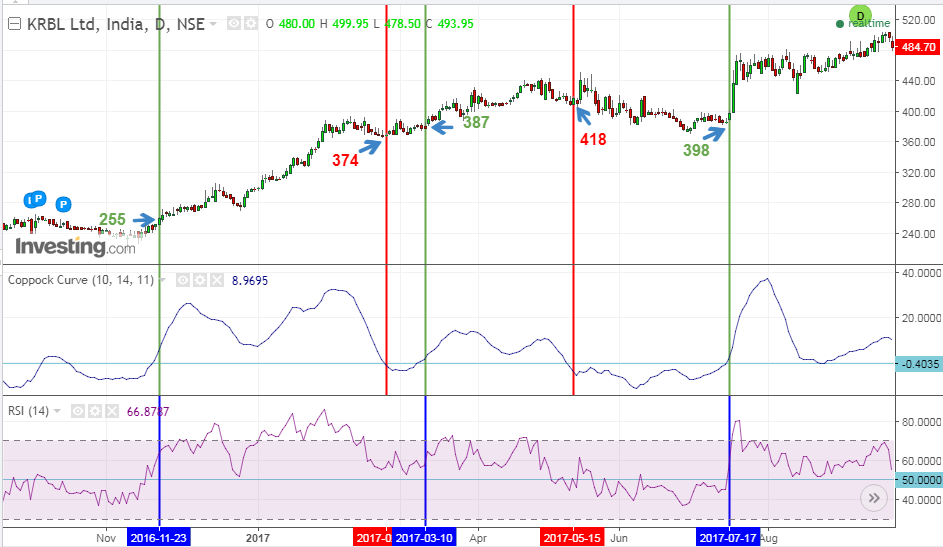
The below is the Daily chart of KRBL and as you can see that there are more signals in the daily chart than in the weekly and the monthly chart.

As you can see in the chart that when the Coppock curve enters the positive zone and simultaneously RSI is also above the mid 50 line, it generates a buy signal.

You can exit the trade either using supertrend or else when the Coppock curve enters the negative territory from the positive zone.

You may do NSE Academy Technical Analysis course to learn the various aspect of Technical Analysis and to also learn trading strategies to trade in the real market.

The traders who are unable to devote much time in analysing charts of various securities may benefit from scan section in StockEdge mobile app.

You can watch the video below to know how to use the StockEdge App for tracking the market in a filtered way:

The first time, we took a position in the stock when it was trading at 255 and booked our position at around 374 when the Coppock curve went below the zero line.

The next position we made at 387and made our exit at 418.

We made the final entry in the stock on 17-07-2017 at 398 and now it is trading at 484.7 and the position is still on hold.

KRBL coppock curve strategy

Conclusion

The main signal using Coppock curve is generated with positive and negative crossover above and below the center zero line.

Though some aggressive chartist uses Coppock curve to look for positive and negative divergence but these divergences do not always result in trend change.

Initially, this curve was designed for the monthly chart, but you may also use in other time frames as well which suits your trading style.

Tags: DivergenceenglishIndicators and oscillatorsrsitechnical analysis
ShareTweetSend
Previous Post

Bank Nifty Closed Above It’s Previous Close After Opening At The High

Next Post

Nifty Consolidates Near Its All Time High

Elearnmarkets

Elearnmarkets

Elearnmarkets (ELM) is a complete financial market portal where the market experts have taken the onus to spread financial education. ELM constantly experiments with new education methodologies and technologies to make financial education effective, affordable and accessible to all. You can connect with us on Twitter @elearnmarkets.

Related Posts

Technical Analysis in Stock Trading 2
Technical Analysis

Technical Analysis in Stock Trading

May 31, 2023
6k
The Ultimate guide to Trading Divergences 3
Technical Analysis

The Ultimate guide to Trading Divergences

May 26, 2023
992
Trading Psychology: Guide to Master Your Mind in 5 Steps 4
Technical Analysis

Trading Psychology: Guide to Master Your Mind in 5 Steps

May 24, 2023
3k
Trading Psychology: 7 Keys to Successful Trading 5
Technical Analysis

Trading Psychology: 7 Keys to Successful Trading

May 22, 2023
3k

Comments 1

  1. froleprotrem says:
    3 years ago

    WONDERFUL Post.thanks for share..extra wait .. …

    Reply

Leave a Reply Cancel reply

Your email address will not be published. Required fields are marked *

Follow Us

Facebook-f Twitter Instagram Linkedin-in Youtube Telegram

Register on Elearnmarkets

Continue your financial learning by creating your own account on Elearnmarkets.com

Register Free Account

Download App

Categories

  • Basic Finance
  • Derivatives
  • Financial Planning
  • Fundamental Analysis
  • Technical Analysis
  • Marketshala
  • Miscellaneous

Popular On Elearnmarkets

  • Market Superheroes:
  • Vivek Bajaj
  • Chetan Panchamia
  • Ashish Kyal
  • Premal Parekh
  • Abhijit Paul
  • Jegan
  • Sivakumar Jayachadran
  • Vishal Malkan
  • Jyoti Budhia
  • Vivek Gadodia
  • Vishal Mehta
  • Piyush Chaudhry
  • Santosh Pasi
  • Gomathi Shankar
  • Market Superheroes:
  • Vivek Bajaj
  • Chetan Panchamia
  • Ashish Kyal
  • Premal Parekh
  • Abhijit Paul
  • Jegan
  • Sivakumar Jayachadran
  • Vishal Malkan
  • Jyoti Budhia
  • Vivek Gadodia
  • Vishal Mehta
  • Piyush Chaudhry
  • Santosh Pasi
  • Gomathi Shankar
  • Courses:​
  • Options Trading
  • Dow Theory
  • Momentum Trading
  • Stock Investing
  • Stock Market for Beginners
  • Harmonic Chart Patterns
  • Algo Trading
  • Elliot Wave Theory
  • Advanced Excel
  • Cryptocurrency
  • NSE Certification Course
  • Courses:​
  • Options Trading
  • Dow Theory
  • Momentum Trading
  • Stock Investing
  • Stock Market for Beginners
  • Harmonic Chart Patterns
  • Algo Trading
  • Elliot Wave Theory
  • Advanced Excel
  • Cryptocurrency
  • NSE Certification Course
  • Webinars:
  • Bank Nifty Scalping
  • Intraday Trading Strategies
  • Options Trading Strategies
  • Options selling
  • Price Action
  • Relative Strength
  • Tax Planning
  • Options Buying
  • Growth Stocks
  • Portfolio Management
  • Relative Strength Index
  • Risk Management
  • Renko Charts
  • Crude Oil
  • Traders Psychology
  • Moving Average
  • Multibagger Stocks
  • Free Learning Modules:
  • Intraday Trading
  • Options Scalping
  • Swing Trading
  • Financial Modelling
  • RSI Indicator
  • Bollinger Bands
  • Pricing of Futures
  • Personal Finance
  • Initial Public Offerings (IPO)
  • Value Investing
  • Technical Indicators
  • Candlesticks
  • Chart Patterns
  • Option Greeks
  • ELSS Funds
  • Banking and Insurance
  • Real Estate
  • Gold
  • Book Summaries:
  • Rich Dad Poor Dad
  • Psychology of Money
  • The Intelligent Investor
  • The Richest Man in Babylon
  • Think and Trade Like a Champion
  • Value Investing and Behavioural Finance
  • Trading in the Zone
  • Learn to Earn
  • Book Summaries:
  • Rich Dad Poor Dad
  • Psychology of Money
  • The Intelligent Investor
  • The Richest Man in Babylon
  • Think and Trade Like a Champion
  • Value Investing and Behavioural Finance
  • Trading in the Zone
  • Learn to Earn
  • Tools:
  • CAGR Calculator
  • SIP Calculator
  • eLearnOptions
  • Future Value Calculator
  • Present Value Calculator
  • Atal Pension Yojana
  • Cost of Delay Calculator
  • Become a Crorepati
  • Tools:
  • CAGR Calculator
  • SIP Calculator
  • eLearnOptions
  • Future Value Calculator
  • Present Value Calculator
  • Atal Pension Yojana
  • Cost of Delay Calculator
  • Become a Crorepati

© 2023 Elearnmarkets. All Rights Reserved

  • Visit Elearnmarkets
  • Courses
  • Webinars
  • Financial Guides
  • Get Free Counselling
  • Visit Elearnmarkets
  • Courses
  • Webinars
  • Financial Guides
  • Get Free Counselling

Get Elearnmarkets App

No Result
View All Result
  • Article Categories
    • Basic Finance
    • Derivatives
    • Financial Planning
    • Fundamental Analysis
    • Technical Analysis
    • Marketshala
    • Miscellaneous
  • Language
    • Hindi
    • Bengali
    • English
  • Courses
  • Webinars

© 2020 Elearnmarkets All Rights Reserved