Support and Resistance (S&R) are predetermined levels from where the price of assets (assets can be in the form stocks, commodities, futures etc) may reverse and if the S&R level is broken then the prices may continue its ongoing trend.
What is Resistance?
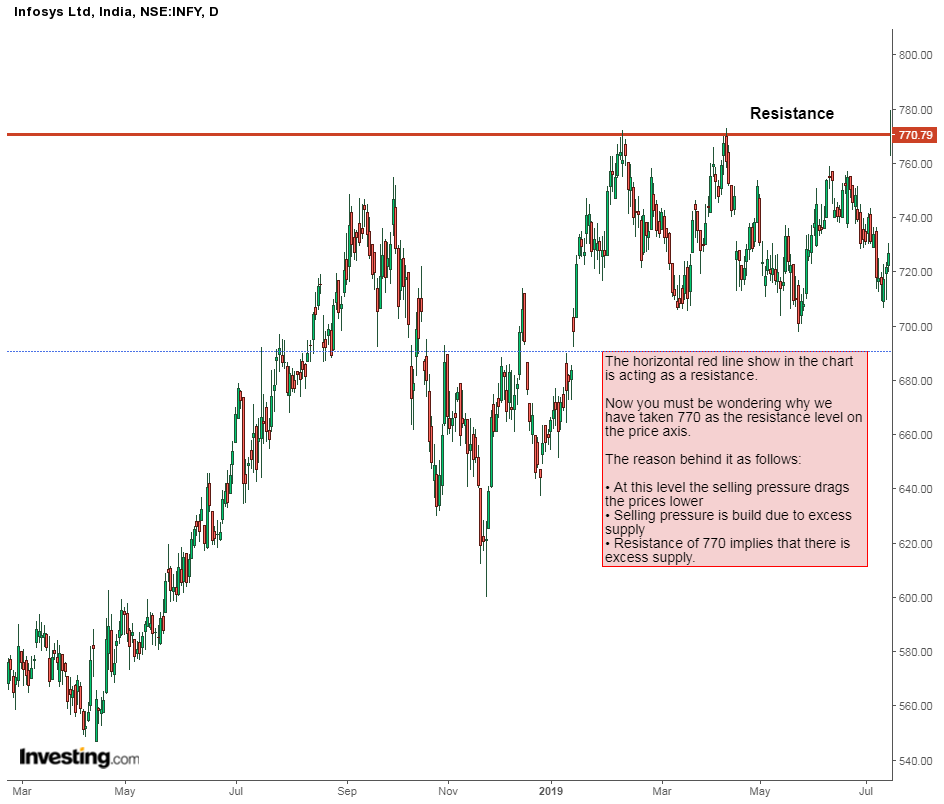
Resistance is a predetermined level from where the prices stop rising.
It can also be referred to as a level on the chart where the traders expect maximum supply for the stock.
The logic behind this is that as the price advances towards resistance, sellers become more inclined to sell and buyers become less inclined to buy.
Learn in 2 hours : Power of Support & Resistance for Trading and Investing
Whenever the prices touch the resistance level it begins to fall and if the prices break the resistance level then it continues to rise.
Resistance is one of the most important tools which the market participants analyze when the market is rising. It often acts as a trigger for selling.
As the process of identification of S&R is the same, first let us discuss support then we will discuss the procedure to identify both S&R.
What is Support?
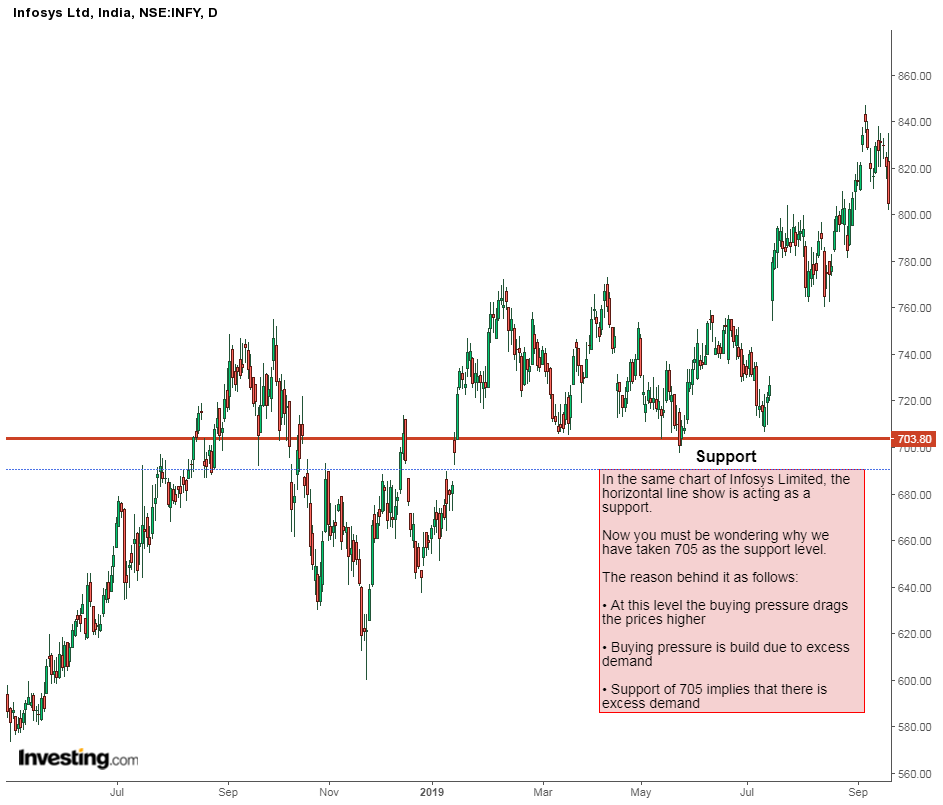
Support is a predetermined level below which the price stopped falling further down.
It is a level at which the traders expect maximum demand for the stock.
The logic dictates that as the price declines towards support and gets cheaper, buyers become more inclined to buy and sellers become less inclined to sell.
Whenever the prices touch the support level it bounces back and begins to rise and if the prices break the support level then it continues to fall down.
Support is one of the most important tools which the market participants analyze when the market is falling down. It often acts as a trigger for buying.
Now that we have understood the concept of S&R, let us understand the procedure for drawing S&R levels.
How to draw Support & Resistance Level in a chart?
Let’s go through three really simple steps for drawing S&R levels.
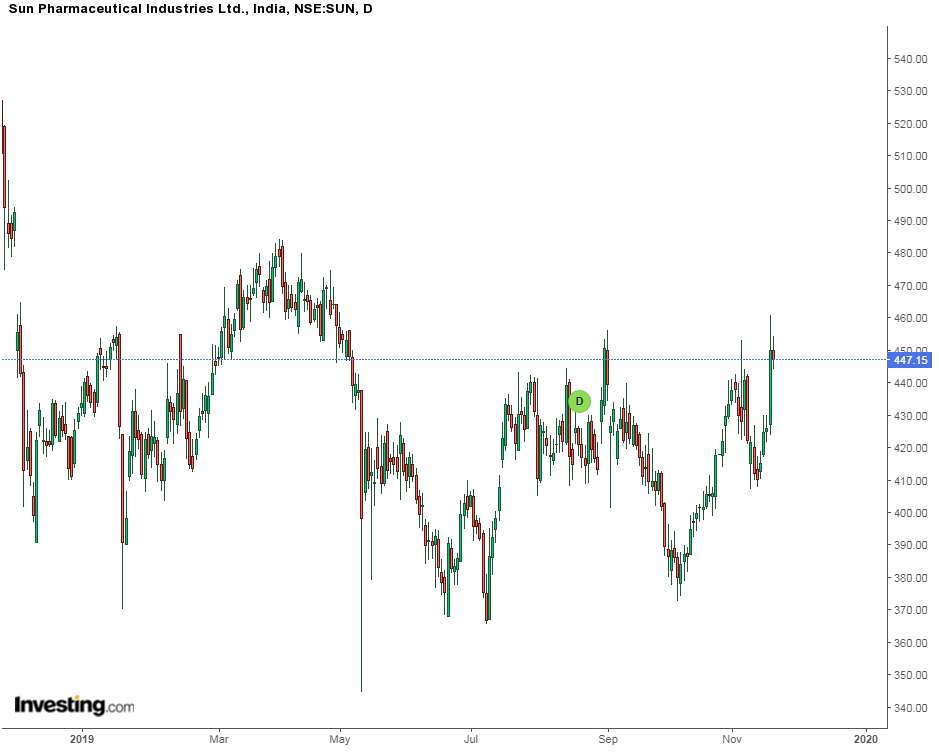
Step 1: Selecting your timeframe
If you want to find S&R for a short time frame, then you should load a price chart of at least 3-6 months. If you want to find S&R for a longer time frame, then you should load a price chart of at least 12- 18 months.

The reason for selecting the above-mentioned timeframes is that:
The chart will get compressed and it will be easier for you to identify
(S&R) levels.
From the below charts we can see that 12 months’ price data chart looks more compressed than the 6 months’ price data chart
Below is the chart for 3 months:—
Below is the chart for 12 months:
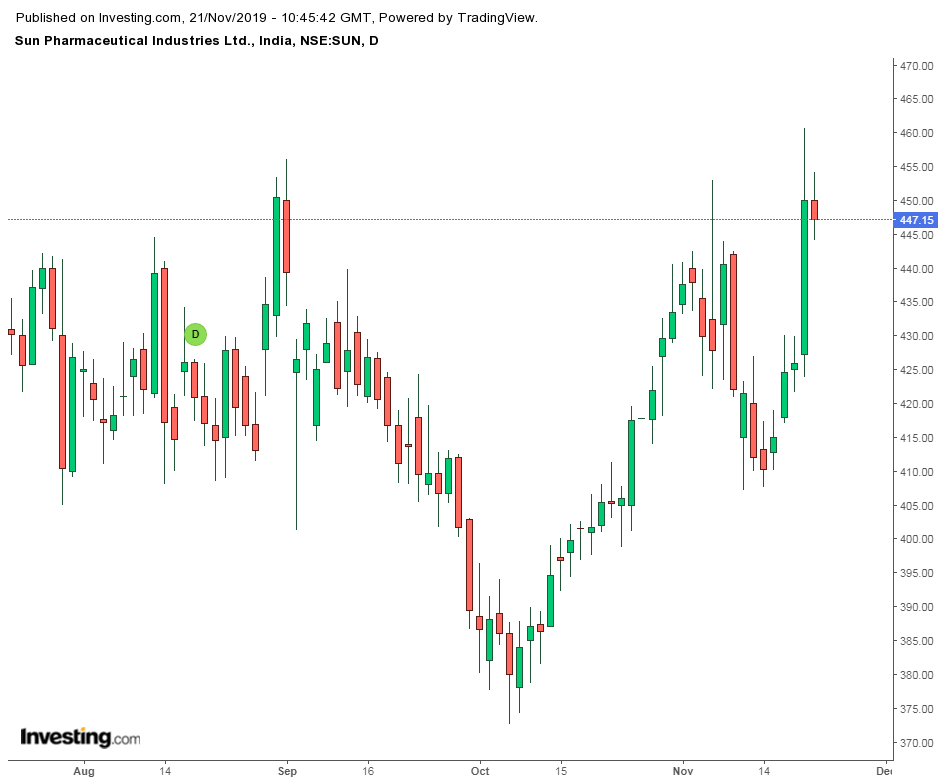
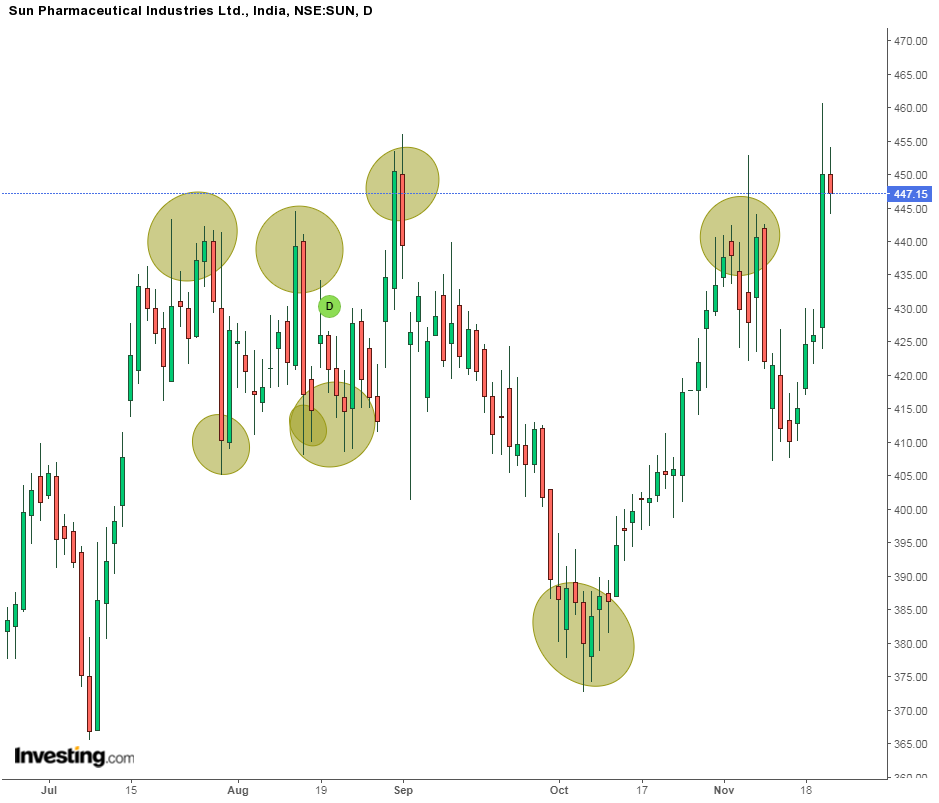
Step 2: Identify highs and lows
After loading the price charts according to your timeframe as mentioned in step 1, mark the areas of low and highs in the chart as shown below:
Step 3: Connecting the highs and lows
After identifying the highs and lows as mentioned in Step 2, join the highs with a line that will act as a resistance and similarly join the lows with a line that will act as a support as shown by the red lines below:
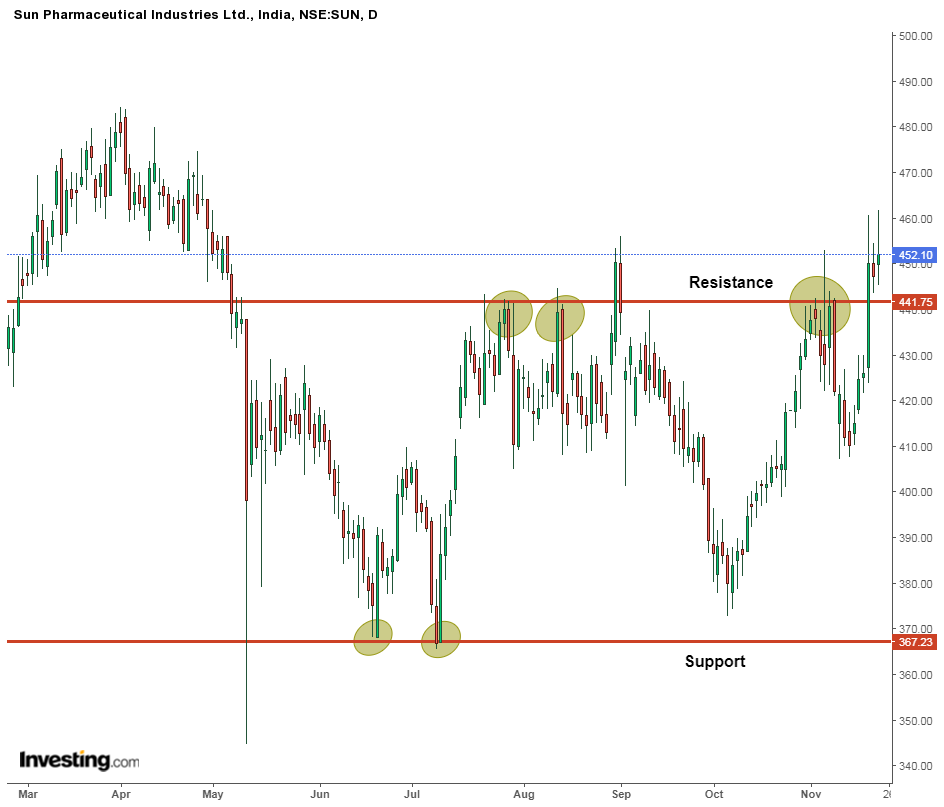
One should note that when drawing a support or resistance line, one should identify at least 2-3 price zones from where the price has shown the below behaviors:
Not able to move further up or down
Reversals have occurred at that point
What is the difference between Support and Resistance?
If the price of an asset does not go below a level, then it is known as support.
Whereas if the price of an asset does not go above a level and reverses from there then it is known as the resistance.
One should just remember support level as a floor and resistance level as the ceiling
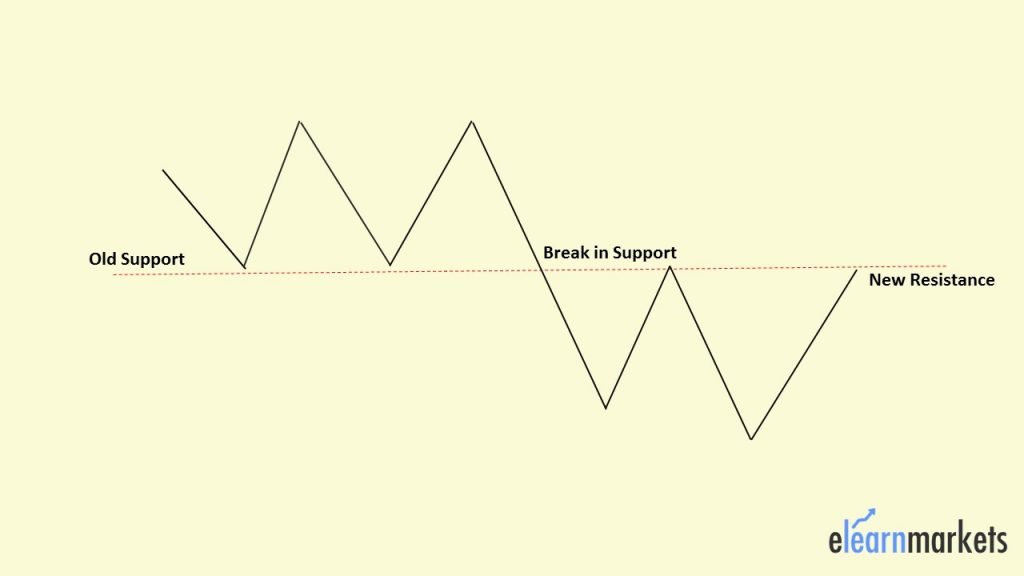
Understanding S&R Reversal and how to use this concept?
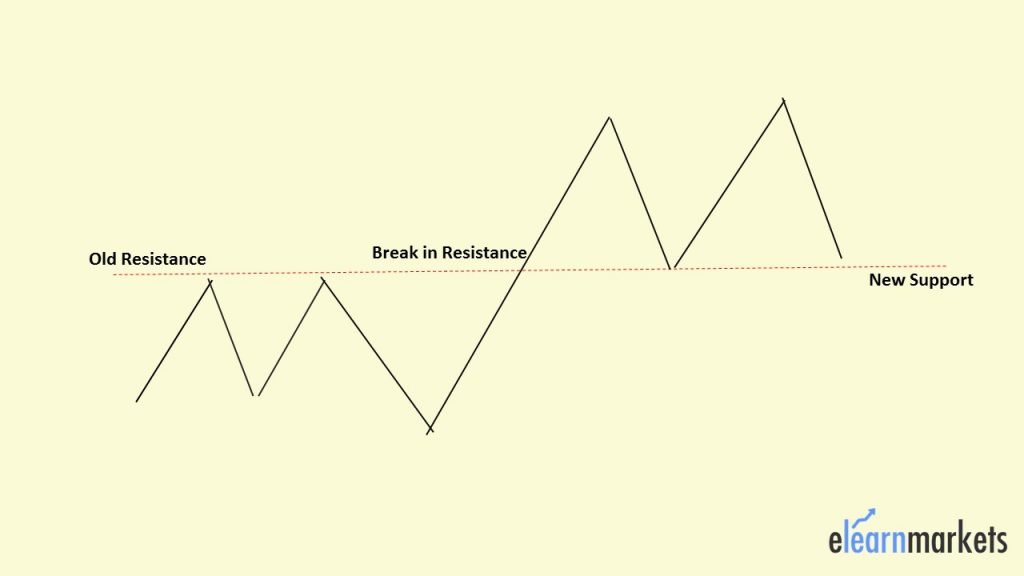
One of the most interesting facts about S&R is that when the price is finally able to break the support or resistance, then it forms a new support or resistance level.
The previous resistance becomes the new support level whereas the previous support level becomes the new resistance level.
Example of Support becoming Resistance:
Example of Resistance becoming Support:
Practical Concept: Trading based on S&R levels
One also need to understand how does the prices move of a particular asset to interpret S&R from this framework.
One should know about the major and minor S&R levels.
Minor S&R can be broken whereas strong S&R may stop the prices to move in the ongoing direction and cause reversals.
Reliability of Support and Resistance
One should remember that the S&R lines only indicate the possibility of reversal of prices.
This by no means should be taken for granted.
Like any other indicators of technical analysis, one should analyze the possibility of an event occurring based on the price patterns in terms of probability.
Thus one should keep the first rule of technical analysis in perspective which is: “History tends to repeat itself” and so will the S&R levels.
To know more about this point, read here: Trading based on S&R levels


VERY VERY USEFULL.
Hello Dilip,
Thank you for your comment.
If you want to read more basic technical analysis blogs, you can read here.
Happy Reading!!
Super sir.. thankyou very much
Hi,
We really appreciated that you liked our blog.
Keep Reading!