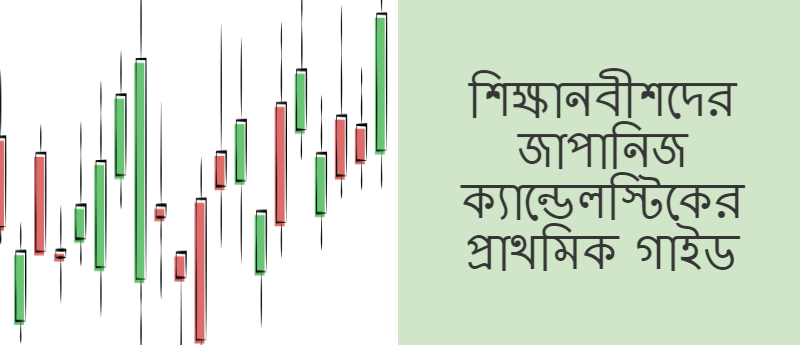
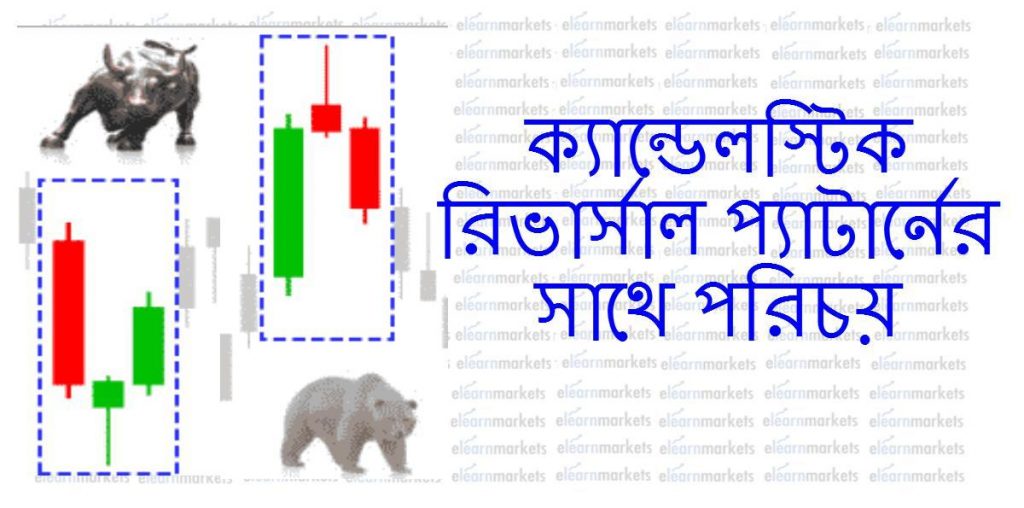
5 Powerful Bearish Candlestick Patterns
May 22, 2025
Top 9 Must Read Fundamental Analysis Books
May 27, 2025
Forex vs Stocks: Which Market Should You Trade First
May 13, 2025
How to Use Collar Option Strategy?
May 2, 2025
According to Wikipedia, Causality (also referred to as causation, or cause and effect) is the agency or efficacy that connects one process (the cause) with another process or state (the effect), where the first is understood to be partly responsible...
ভূমিকা : - আমরা মানুষ, মনুষ্যত্ব থাকার কারণেই আমরা মানুষ নামের অধিকারী | জীবনে চলার ক্ষেত্রে বিচার , বিবেচনা , বিশ্লেষণ প্রভৃতি জিনিস আমরা ধারাবাহিক ভাবে করে থাকি | একটি বাচ্চার জন্ম থেকে শুরু করে শৈশব , কৈশোর , যৌবন...
MACD Indicator- We, the Homo sapiens, want to live within our comfort zone. We love to change but hate being changed. I can hear an echo. Thanks for converging your thought with that of mine. It has to be. After...
Hindi: आप इस लेख को हिंदी में भी पढ़ सकते है| Key Takeaways: A gap is produced when on a particular day a certain stock at its lowest price is traded higher, compared to its highest price at which it...
Have you ever noticed that if you throw a pebble at still water, it create ripples, which is essentially a small wave or series of waves? Presently your thoughts must be crisscrossing your mind with curiosity that it’s a technical...
A Broadening Triangle is a relatively rare triangle pattern which occurs when there is a lot of volatility in a security. It is formed when the prices forge higher highs and lower lows consecutively. Table of Contents What is Broadening...
Bestowed with catchy names these Doji candlestick patterns have important messages to deliver. Before we get into specifications, let’s understand what is a Doji. DOJI A Doji is a candlestick with no real body. Also Read: All you need to know about...
What is a Symmetrical Triangle? Symmetrical Triangle A symmetrical triangle is a technical chart pattern, formed by the fluctuations in price movements. The upper and the lower bounding lines converge to finally cross each other at the ‘Apex’. A...
An outside day is a particular trading day when the high is higher than the previous high and the low is lower than the previous low. The trading range exceeds the range of the previous day on both the upper...
Candlestick charts are a very useful tool for analyzing trader’s psychology and undercurrents in price momentum. Every aspect of a candlestick plays a role, may it be the color of the body, the length of the wick/tail, and size of...
Key Takeaways: RSI indicator (Relative Strength Index) is a technical analysis indicator used to measure the change in price momentum. Above 70 the stock is considered to be overbought and below 30, the stock is considered to be oversold. RSI...
Technical analysis is a vast and diverse field of analysis. It has many tools that make it a successful method to analyze stock markets. The Fibonacci series is one such tool which has stood its test of time. It is...
Elearnmarkets (Kredent InfoEdge Pvt. Ltd.) is a SEBI-registered Research Analyst (RA) entity (SEBI Registration No.: INH300007493). The information provided in this article is for educational and informational purposes only and should not be considered as an offer to buy or sell any securities or investment products.
The stocks, securities, and investment instruments mentioned herein are not recommendations under SEBI (Research Analysts) Regulations, 2014. Readers are advised to conduct their own due diligence and seek independent financial advice before making any investment decisions.
Investments in securities markets are subject to market risks. Please read all related documents carefully before investing. Investing in Equity Shares,
Derivatives, Mutual Funds, or other instruments carry inherent risks, including potential loss of capital. Elearnmarkets (Kredent InfoEdge Pvt. Ltd.) does not provide any guarantee or assurance of returns on any investments. Past performance is not indicative of future performance.